 Open Access Article
Creative Commons Attribution 3.0 Unported Licence
Charge carrier trapping, recombination and transfer in hematite (α-Fe2O3) water splitting photoanodes
Monica
Barroso
*a,
Stephanie R.
Pendlebury
b,
Alexander J.
Cowan
c and
James R.
Durrant
*b
aInorganic Chemistry and Catalysis Group, Debye Institute for Nanomaterials Science, Utrecht University, Universiteitsweg 99, 3584 CG, Utrecht, The Netherlands. E-mail: m.barroso@uu.nl
bDepartment of Chemistry, Imperial College London, London SW7 2AZ, UK. E-mail: j.durrant@imperial.ac.uk
cStephenson Institute for Renewable Energy, Department of Chemistry, The University of Liverpool, Liverpool L69 7ZD, UK. E-mail: a.j.cowan@liverpool.ac.uk
First published on 26th April 2013
Abstract
Hematite is currently considered one of the most promising materials for the conversion and storage of solar energy via the photoelectrolysis of water. Whilst there has been extensive research and much progress in the development of hematite structures with enhanced photoelectrochemical (PEC) activity, relatively limited information has been available until recently concerning the dynamics of photogenerated charge carriers in hematite and their impact upon the efficiency of water photoelectrolysis. In this perspective we present an overview of our recent studies of the dynamics of photoinduced charge carrier processes in hematite, derived primarily from transient absorption spectroscopy of nanostructured photoanodes. The relationship between PEC activity and transient measurements are discussed in terms of a phenomenological model which rationalizes the observations and in particular the impact of external potential bias on the relative rates of charge carrier trapping, recombination and interfacial transfer in hematite photoanodes for water oxidation.
1 Introduction
Increasing demand for sustainable, carbon-free energy generation is motivating the development of solar energy conversion and storage technologies. Photoelectrochemical (PEC) water splitting for solar fuel production offers the possibility of capturing solar photons and storing the corresponding energy directly in the bonds of chemical compounds that can subsequently be used in several applications.1 Significant research efforts are being focused on developing new photoelectrode materials that efficiently harvest sunlight and catalyze the photoelectrolysis of water into molecular oxygen and hydrogen, with semiconductor metal oxides among the most extensively explored for this purpose.2–4Hematite (α-Fe2O3) has long been considered one of the most promising materials for solar water splitting applications. Its bandgap (1.9–2.2 eV)5,6 allows for light absorption in the visible and consequently a potential usage of up to 40% of the solar spectrum. Moreover, hematite is suitable for photoanode applications because its valence band edge (VBE) position is thermodynamically suitable to drive water oxidation (E° (O2/H2O) = 1.23 V) by photogenerated holes.7,8 Also important from the view point of sustainability are the abundance and environmental inertness of hematite, and its chemical stability, particularly in strong alkaline media. However, there are also significant challenges associated with its application to solar driven water oxidation, including long optical absorption depths in the visible part of the solar spectrum (ca. 100 nm at λ = 500 nm),9 poor carrier mobilities,10 and short hole diffusion lengths (2–20 nm).5,8 These together result in substantial electron–hole recombination losses on timescales ranging from picoseconds to milliseconds,11,12 particularly for charge carriers generated in the bulk of thick films. Other important factors that contribute significantly to the loss of conversion efficiency in hematite are the thermodynamically unfavorable position of the conduction band edge (ECB ∼ 0.4 V vs. RHE),7,8 unsuitable for unassisted hydrogen evolution, and the sluggish kinetics of water oxidation at the electrode–electrolyte interface8,13–15 that results in a high overpotential requirement for oxygen evolution. As a consequence of these limitations, high external electric biases are normally required to drive the water photolysis reaction with significant photocurrents. Even in the presence of such electrical bias, solar to hydrogen (STH) conversion efficiencies for hematite, whilst impressive compared to other oxide photoanode materials, are typically significantly lower16 than the theoretically estimated maximum of 12.8–16%.17
Research on hematite photoanodes for water photolysis was initiated nearly four decades ago.5,18–25 Recent advances in nanomaterials science and computational chemistry methods, alongside progress in the understanding of other metal oxide semiconductors, particularly TiO2, has opened the way to new strategies for the development of hematite photoanodes, reinvigorating interest in this material for water photolysis.26–33 Nanostructuring has been shown to allow some decoupling of the pathways for light capture and hole collection, as a response to the problems of long light penetration depths and short hole diffusion lengths in α-Fe2O3.31,34,35 The preparation of hematite nanowires,36,37 nanotubes,38 nanonets,34 and dendritic nanocauliflowers39 are examples of successful attempts to achieve improved light harvesting and charge carrier separation. It has also been shown that the mismatch between the conduction band edge position in hematite and the hydrogen evolution potential can be circumvented by coupling a PV unit (e.g. a dye-sensitized solar cell) to the hematite photoelectrode to supply the bias voltage required.40 Finally, surface treatments of hematite with efficient water oxidation electrocatalysts and other metal oxide layers or junctions have also been extensively investigated.41–46
It is increasingly recognized that alongside new material developments, improved knowledge of the intrinsic optoelectronic, catalytic and carrier dynamic characteristics of photoelectrode materials will be important for their technological development. In this context, recent theoretical studies have focused on understanding the electronic and catalytic properties of hematite, investigating the nature of electronic transitions and the factors that influence the interaction between the metal oxide surface and water.47–51 In parallel, a number of experimental studies,52–55 including those of our group,11,56–59 have recently focused on the dynamics of photogenerated charge carriers in hematite and the impact of the material improvement strategies discussed above on the rates of charge separation, recombination and interfacial transfer, building upon the work of earlier studies.60,61 Using mainly electrochemical impedance spectroscopy (EIS) as source of kinetic information, several groups have investigated the physical–chemical processes involved in the photoelectrochemical response of hematite photoanodes for water photolysis.41,62–64 At the same time, our group has carried out investigations of these dynamics using a combination of transient absorption spectroscopy (TAS), transient photocurrent (TPC) and PEC measurements,11,56–59 which have allowed us to monitor the fates of photoholes and photoelectrons on the timescale of microseconds to seconds, particularly relevant to understanding the efficiency of the water oxidation mechanism.
This perspective will present an overview of the recent developments achieved in our group and our current understanding of the main factors limiting the efficiency of water photo-oxidation in hematite, specifically by addressing the role of an external electrical bias in the rates of electron–hole recombination, trapping and interfacial charge transfer to the electrolyte in hematite photoanodes.
2 Charge carrier dynamics
2.1 Transient absorption spectroscopy of hematite
Excitation of hematite with visible light of energy higher than the bandgap (λ < 620 nm) leads to the formation of electron–hole pairs. TAS can be employed to characterize the dynamics of these photoinduced charge carriers. Typically, this pump–probe method is based upon the excitation of valence band electrons with a pulsed laser source; the dynamics of the transient species formed – valence band holes and conduction band electrons – can be followed by probing their transient absorption in the visible to near infrared regions of the spectrum using a second probe pulse or beam.Most previous reports of transient absorption spectroscopy of hematite have focused on ultrafast timescales, and typically reported very fast (<75–150 ps) decay kinetics assigned to the recombination dynamics of photoinduced electrons and holes. Such studies have reported only a very small percentage of charge carriers remaining a few hundreds of nanoseconds after laser excitation.12,52,54,55,65,66 As such, ultrafast recombination is usually reported as the main fate of the photogenerated charge carriers in hematite, as the short-lived charge carriers are unlikely to have sufficient time to drive the challenging chemistry of water oxidation. It should however be noted that those ultrafast studies are typically carried out with rather high excitation densities, resulting in high photoinduced charge carrier densities, and therefore fast bimolecular (non-geminate) recombination. As a consequence, it is unclear to what extent such ultrafast recombination dynamics impact upon the function of hematite photoanodes under continuous solar irradiation.
Our transient absorption studies on hematite, typically employing rather lower excitation densities, have focused upon the detection of photogenerated charge carriers in the microsecond to second time window. As we discuss below, and indicated by photoelectrochemical analyses, this timescale appears to be highly relevant to photoelectrochemical water oxidation. Fig. 1 shows a typical decay trace obtained upon pulsed laser excitation with UV photons (355 nm, 3.5 eV) of a Si-doped nanostructured hematite film deposited on FTO glass, immersed in an alkaline electrolyte solution and not connected to an external electrical circuit.11 The transients formed under such conditions show highly dispersive, power law decay kinetics on the microsecond timescale. Such power law decay dynamics are typically understood as resulting from non-geminate electron–hole recombination that proceeds via multiple trapping and detrapping steps, characteristic of semiconductor materials with a high density of trap states,67 as expected for hematite. The inset in Fig. 1 shows a typical transient absorption spectrum of hematite, measured 500 ns after laser excitation. This spectrum is characterized by a strong absorption band with a maximum at 580 nm and a tail that extends into the near-IR, both features disappearing within a few milliseconds.
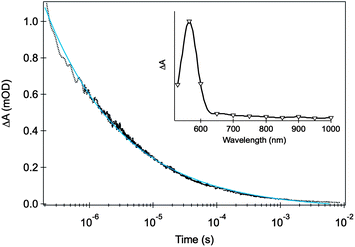 | ||
| Fig. 1 Transient absorption decay signal for an unbiased Si-doped APCVD α-Fe2O3 film upon UV light excitation (355 nm, 200 μJ cm−2, 1 Hz) probed at 580 nm. The inset shows the wavelength dependence of the transient absorption for the same film measured at 500 ns after the excitation pulse. The measurements were performed with the hematite film under Ar, with illumination from the electrolyte/electrode side (front-side or EE illumination). The blue line shows the fit of the transient data with a power law function. Adapted from ref. 11. | ||
The decay dynamics of the photoinduced absorption features shown in Fig. 1 were found to be insensitive to the presence of hole scavengers such as MeOH and KI. This result contrasts with that observed for other metal oxides, particularly with nanocrystalline TiO2 films, where the presence of chemical electron or hole scavengers typically results in the acceleration of electron or hole decays, respectively.68 This suggests that the observed micro- to milli-second decay should be assigned primarily to bulk electron–hole recombination.
The intrinsic short carrier lifetimes measured for hematite colloids, single crystals and thin films are often used to justify poor water splitting conversion efficiencies. However, studies of the corresponding charge carrier dynamics under photoelectrochemical water splitting conditions, that is, when the electrodes are integrated in a photoelectrochemical cell and subjected to an external electrical bias, are relatively limited to date.12 Our own such studies have focused on the bias dependence of transient absorption dynamics on slower microsecond to second timescales. On these timescales, a strong dependence on electrical bias is observed, which we have been able to correlate with the bias dependence of photocurrent.58
Fig. 2 summarizes the evolution of the transient absorption spectra of a typical nanostructured hematite photoanode as a function of the applied bias and the time elapsed after laser excitation. Close to the flatband potential (Fig. 2a), the transient absorption spectra resemble that of the unbiased film, showing a transient absorption band that peaks at 580 nm and extends into the near IR. This transient absorption profile disappears in less than a few milliseconds, as seen previously, due to fast trap-mediated electron–hole recombination. As the external bias is made more positive (Fig. 2b–e), it is clear that the transient lifetime is gradually increased by up to three orders of magnitude throughout the spectral window examined. Two distinctive spectral trends can be easily identified: (1) a broad, long-lived transient absorption band (from 550 to >900 nm, with a maximum at 650 nm) forms at sufficiently high positive bias; (2) a relatively narrow, negative transient absorption (bleach) band centered at 580 nm at early timescales gradually develops, from potentials just slightly positive of the flatband potential, increasing as the bias is made more anodic.
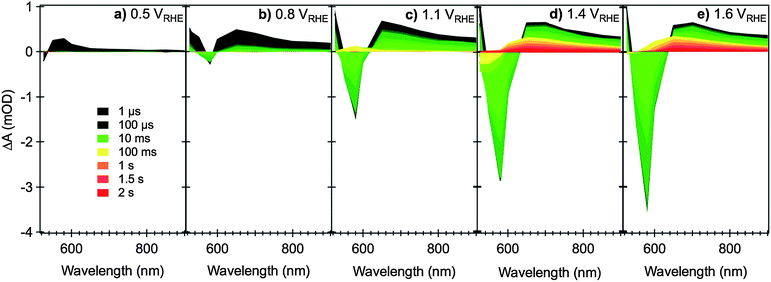 | ||
| Fig. 2 Transient absorption spectra of nanostructured Si-doped CVD hematite photoanodes under different applied electrical bias as indicated in figures (a) to (e), relative to RHE, in 0.1 M NaOH. The measurements are performed in a three-electrode cell, with Pt gauze as counter electrode and Ag/AgCl/0.3 M NaCl as reference. The nanostructure photoanodes are excited from the electrolyte/electrode side (EE illumination) with a UV laser pulse (355 nm, 200 μJ cm−2, 0.33 Hz) and monitored with the output of a monochromated Xe lamp (75 W). The color code for the spectra time delays is shown in (a). Adapted from ref. 59. | ||
Transient decays monitored at 650 nm (Fig. 3a) show a clear biphasic decay. At early times (<10 ms) a relatively fast decay phase is observed, assigned to electron–hole recombination. The kinetics of this recombination are retarded as the anodic bias is increased, assigned to a reduction in the background electron density in the hematite and the concomitant development of a space charge layer.58 In addition, above a threshold potential of ∼0.8 VRHE, a slower decay phase (lifetime ∼ 1 s) is also observed, indicating the generation of a residual population of long lived charge carriers (holes, see Section 2.2 below). In contrast, transient decays monitored at 580 nm (Fig. 3b) show a more complex behavior, as we discuss further below (Section 2.3).
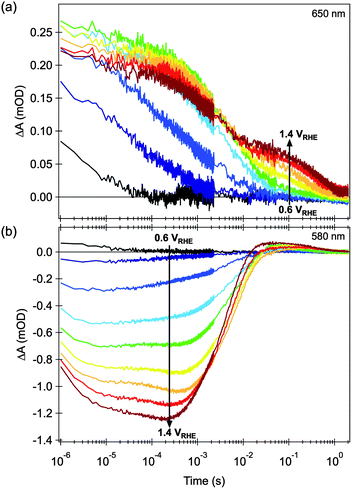 | ||
| Fig. 3 Effect of applied electrical bias in the transient absorption decay dynamics of nanostructured hematite photoanodes, after bandgap excitation with 355 nm laser light. (a) Probed at 650 nm, and (b) probed at 580 nm. The transient decays shown are measured at 0.1 V intervals within the 0.6 to 1.4 V vs. RHE range, as indicated in the figures. Adapted from ref. 58. | ||
2.2 Hole dynamics and water oxidation
The long-lived, broad photoinduced absorption feature peaking at 650 nm is only observed under positive applied voltages, corresponding to conditions where the external circuit will extract photogenerated electrons from hematite film. It is thus reasonable to assign this transient signal to photogenerated hematite holes. The likely physical origin of this 650 nm absorption is illustrated in Scheme 1 (see Section 5 for more discussion).† In the presence of methanol, a well-known hole scavenger, the lifetime of this slow decay phase is reduced ∼5 fold, confirming its assignment to holes and indicating that the decay of this photoinduced absorption is primarily determined by interfacial hole transfer and consequent oxidation of the electrolyte.11 The effect of bias on the transient absorption shown in Fig. 3a can then be interpreted as follows. Due to the external potentiostatic control, anodic of the flatband, traps and intraband states initially filled with electrons are gradually emptied. As the background density of electrons in the film is lowered a depletion region is formed close to the electrode surface and charge separation is facilitated. As a consequence, electron–hole recombination is gradually retarded, the competition with hole transport is diminished and the photogenerated holes accumulate near the surface, giving rise to the broad long-lived photohole absorption band. More importantly, the lifetime of these holes is potentially long enough (>1 s) to promote the oxidation of water.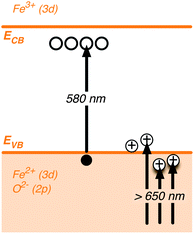 | ||
| Scheme 1 Schematic illustration depicting the nature of electronic transitions responsible for the Vis-NIR transient absorption spectra of hematite photoanodes.‡ | ||
Evidence for the assignment of the slow decay phase observed in water electrolytes under positive bias to water oxidation comes from our observation of a clear correlation between the amplitude of this slow transient absorption decay phase and the PEC performance of hematite. This is shown in Fig. 4a (open circles) revealing a similar threshold potential, and overall bias dependence, for the formation of long-lived photoholes and the observation of anodic photocurrent associated with water oxidation. We have found this correlation is valid for all the hematite photoanodes we have examined so far, regardless of the morphology or doping level,58 confirming that the formation and possibly accumulation of long-lived photoholes is a prerequisite to the observation of an anodic photocurrent, that is, to the oxidation of water by hematite. Indeed we have observed similar correlations between long-lived photohole yields and photocurrent for nanostructured TiO2 (ref. 68 and 69) and WO3 (ref. 70) photoanodes and for hematite photoelectrodes with different surface treatments.59 As such there appears to be strong evidence in favor of assigning this decay phase to water photo-oxidation, at least under the experimental conditions studied.
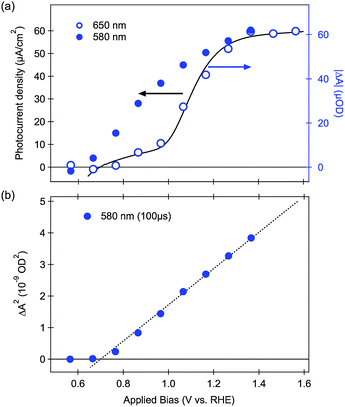 | ||
| Fig. 4 (a) Correlation between the photocurrent (black line) and absolute transient absorption amplitude (blue circles) as a function of applied electrical bias. Open circles are from transient absorption signals probed at 650 nm at 100 ms after the laser pulse; closed circles are from transient signals probed at 580 nm, 100 μs after the laser pulse. (b) Dependence of the square of the transient bleach (580 nm, 100 μs) with the external electric bias. Adapted from ref. 58. | ||
Following this assignment of the slow decay phase to water oxidation, it follows that the rate constant for this phase (∼1 s−1) corresponds to the rate constant for water oxidation by hematite photoholes. A similar rate constant for this reaction has also been obtained for impedance analyses, supporting this assignment.62 The yield of these long-lived photoholes is observed to be bias dependent, assigned to the bias dependence of electron–hole recombination. This rate constant was observed to be relatively independent of the type of hematite photoanode studied (nanostructured versus flat, doped etc.), with measured values ranging from 0.3–3 s−1.
We have measured the temperature dependence of the transient absorption decay dynamics to determine the activation energy for this water oxidation rate constant, found to be 45 kJ mol−1.57 This significant activation energy at least in part explains the slow timescales of hole transfer to water and confirms slow interfacial kinetics as one of the limiting factors to water oxidation by hematite.57 Consistent with this analysis, we note that analogous studies of the activation energy for water oxidation by TiO2 observed no temperature dependence, indicative of significantly smaller activation energy and consistent with the deeper valence band edge for TiO2 relative to hematite. Consideration of the VBE for hematite and this activation energy relative to the thermodynamics of water oxidation71 (see Scheme 2) suggests that water oxidation under these conditions proceeds primarily via a series of single-hole oxidation steps. We have observed that this rate constant for water oxidation is independent of excitation intensity, at least for the range of laser excitation densities studied,58 consistent with a one-hole transfer reaction from hematite, possibly to surface adsorbed OH−, as also suggested by theoretical studies.72
The rate constant for water oxidation observed in our studies (∼1 s−1) indicates that achieving sufficiently long hole lifetimes is a key requirement for efficient water oxidation. However it should be noted that whilst this timescale is slow relative to electron–hole recombination kinetics, it is actually fast relative to typical turn over frequencies (TOF) reported for most water oxidation electrocatalysts. For example, for the widely studied Co3O4 water oxidation catalyst, a TOF ≤ 0.035 s−1 per active Co site has been reported.73 The faster rate constant for water oxidation by hematite holes can most obviously be attributed to the larger thermodynamic driving force for water oxidation by hematite valence band holes (although this is of course at the expense of thermodynamic efficiency). This difference in rate constants might explain, at least in part, a recent controversy over the role of cobalt oxide overlayers in enhancing the water photo-oxidation properties of hematite photoelectrodes.41,42,56,59,74–76 Our transient absorption studies have shown that thin cobalt oxide overlayers do not result in a significant acceleration of the decay dynamics of hematite photoholes assigned to water oxidation, but rather result in a significant reduction of the electron–hole recombination rate in both unbiased hematite photoelectrodes (Fig. 5) and under applied bias.56,58,59 We have assigned this reduction of electron–hole recombination losses to the formation of a hematite/cobalt oxide heterojunction that promotes formation of a thicker space charge layer and thus facilitates charge separation. We have suggested that this effect, rather than a catalytic increase in the rate of water oxidation, appears to be the main factor determining the decrease observed in the overpotential for oxygen evolution on hematite. A similar conclusion has also been reached from electrochemical impedance analyses.41 Other heterostructures have also recently been shown to produce similar results.45,46 Alongside these observations, both we (for example Fig. 5B in ref. 58) and others74 have reported significant oxidation of the cobalt oxide overlayer under positive applied bias. This oxidation is observed even in the dark under biases where no water oxidation is observed.53,56 The slow rate constant for water oxidation by cobalt ‘holes’ relative to hematite holes provides an explanation for why cobalt oxide oxidation appears not to contribute directly to the water oxidation process, at least for the relatively thin cobalt oxide layers employed in our own studies.
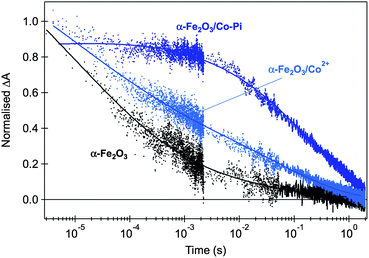 | ||
| Fig. 5 Normalised transient absorption decays of hematite photoholes probed at 700 nm and obtained with front-side low-intensity UV illumination (355 nm, 200 μJ cm−2) of unbiased APCVD hematite photoanodes, immersed in 0.1 M NaOH aqueous solution. Untreated hematite is shown in black, sample treated by Co2+ adsorption is shown in light blue and the composite α-Fe2O3/Co-Pi is shown in dark blue. Adapted from ref. 59. | ||
2.3 Electron dynamics and charge carrier trapping
Section 2.2 focused upon photohole dynamics, as monitored by their broad photoinduced absorption signal peaking at ∼650 nm. We now consider photoelectron dynamics and in particular the role of charge trapping in intraband trap states. In this regard, the second spectral feature apparent in Fig. 2 and 3, namely the sharp absorption/bleaching signal at 580 nm is of particular interest. As we have reported previously,59 spectroelectrochemical data provide the clearest indicator of the assignment of this 580 nm spectral feature. Such data, comprising steady-state optical absorption spectrum of a hematite electrode as a function of applied bias is shown in Fig. 6. It is apparent from these data that as the film is biased positive from flatband, this 580 nm spectral feature appears as an increasing ground state optical absorption.59 Related spectroelectrochemical analyses have previously been employed to determine the flatband potential and charge carrier effective masses in TiO2 and ZnO,77,78 where the appearance of a bleaching band near the bandgap energy under accumulation conditions was interpreted as resulting from band filling, also known as the Moss–Burstein effect.79 The 580 nm transient absorption in hematite is then assigned to an optical transition from the valence band into localized states a few hundred meV below the conduction band, as illustrated in Scheme 1. We note that electrons in the tail of the hematite conduction band are generally reported to be relatively localized,80 such that these states can function as electron traps. The specific nature of these states is further discussed in Section 5.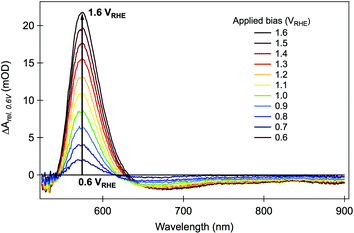 | ||
| Fig. 6 Difference steady-state absorption spectra of hematite photoelectrode under various applied electrical bias. The values plotted in the figure were obtained by subtracting the absorbance at +0.6 VRHE (close to the flatband potential) from the absorbance at each applied potential, in the same range used for the transient absorption studies. Adapted from ref. 59. | ||
Following this assignment, we now turn to the analysis of the transient absorption data measured at 580 nm. A positive increase in the 580 nm absorption feature will correspond to an oxidation of these intraband states (i.e. to hole trapping) whilst a bleaching of this absorption will correspond to a reduction (i.e. electron trapping). In the absence of applied bias, or under cathodic bias close to flatband potential, these intraband states are largely occupied by electrons and therefore function as hole trapping sites. Under these conditions, photoholes can rapidly become trapped in these sites resulting in the appearance of a positive photoinduced absorption signal at 580 nm, as observed in Fig. 1 (inset) and 2a. This absorption signal subsequently decays as photogenerated electrons recombine with these trapped holes (equivalent to electron trapping in vacant electron trap sites). As such these intraband states function as recombination centres for electron–hole recombination. In contrast, under anodic bias, an increasing proportion of these localized band edge states are oxidised, corresponding to those within the space charge layer. Under these anodic bias conditions, photoexcitation in the space charge layer results in trapping of photogenerated electrons in these intraband states, causing the observation of a transient bleach band centered at 580 nm (i.e. loss of ground state absorption) as observed in Fig. 2c–e. The recovery of this bleach signal occurs on the millisecond timescale, assigned at least in part to recombination of hole with these trapped electrons. As such, these intraband states again act as recombination centres. The magnitude of this 580 nm transient bleaching signal increases with the square route of applied voltage (Fig. 4b). This dependence upon applied bias is analogous to the expected dependence of the space charge layer depth W upon applied bias, according to Gärtner's model:81
 | (1) |
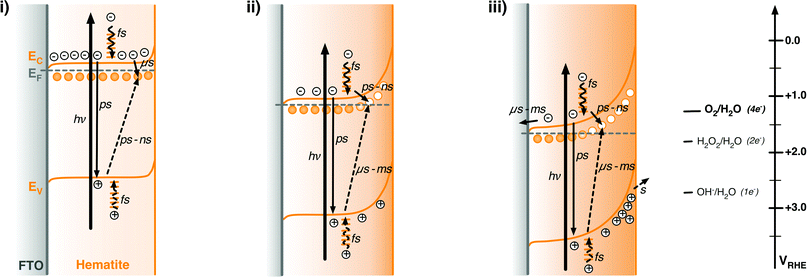 | ||
| Scheme 2 Schematic illustration of the energy diagrams and processes involving photogenerated charge carriers in n-type hematite photoanodes under illumination and under different external potential biases. (i) +0.5 VRHE, corresponding to the results shown in Fig. 2a; (ii) +1.1 VRHE, for Fig. 2c; (iii) +1.6 VRHE, for Fig. 2e. The relative redox potentials for the one-, two-, and four-electron water oxidation reactions are also shown for comparison with the energy of valence band holes.71 In the figure, full line arrows represent electron excitation (thick line) and deactivation processes, and dashed arrows represent photohole deactivation processes, following the excitation laser pulse. | ||
Further confirmation of the assignment of the bleaching feature to trapped electrons is obtained from comparison of the dynamics of transient absorption and transient photocurrent decays, presented in Fig. 7. The transient photocurrent signal is proportional to the rate of charge extraction from a photoelectrode at a given time, from which the charge remaining in the film at a given time can be calculated.58 The similarity between the kinetics of bleach recovery and transient photocurrent decay, particularly at sub-millisecond timescales, is consistent with the competition between electron–hole recombination and charge collection. Trapped electrons are then expected to either recombine with holes, as probed by the decay of the positive 650 nm transient absorption signal, or be swept out of the space charge layer by the electric field present within this layer and then collected in the external circuit, as measured in the transient photocurrent response.
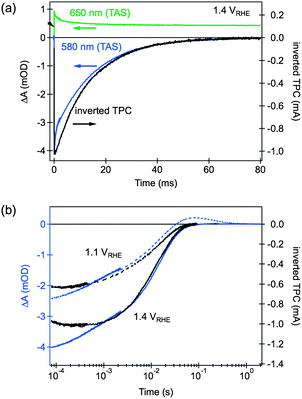 | ||
| Fig. 7 Comparison of TAS and TPC decays.§ (a) TAS decays probed at 650 nm (green line) and 580 nm (blue), and inverted TPC decay (black), for a hematite electrode biased at 1.4 VRHE; (b) the effect of applied bias on the decay dynamics of the TAS signal probed at 580 nm (blue lines) and inverted TPC (black lines). Adapted from ref. 58. | ||
3 Model for photoelectrode function
Scheme 2 illustrates a simple model of hematite photoelectrode function under pulsed laser excitation based upon the results discussed above. This model includes both conduction band electrons and valence band holes, as well as the intraband states located a few 100 mV below the conduction band edge discussed in Section 2.3. These intraband states can function as either electron or hole traps depending upon their oxidation state, in either case they can mediate electron–hole recombination. The model employs the assignments of the 650 and 580 nm spectral features given in Section 3 to explain the bias dependence of the kinetic data shown in Fig. 1–3. It is presented as a model to describe response of hematite under pulsed laser excitation – the relevance of this model to continuous operation under solar irradiation is discussed in Section 2. We note Scheme 2 includes ultrafast (fs–ns) electron–hole recombination as an additional loss pathway, but this is not considered further in this study.Under biases close to or cathodic of flatband (Scheme 2(i)), the Fermi level of the photoelectrode is close to the conduction band edge, with the trap states located within the bandgap being largely reduced (i.e. occupied by trapped electrons). Following photoexcitation of electrons and holes, a significant fraction of photogenerated valence band holes are rapidly (<1 μs) trapped in these intraband states, resulting in the instrument response limited rise in the 580 nm transient absorption apparent in Fig. 1 and 2a. This photoinduced absorption subsequently decays as photogenerated conduction band electrons recombine with these trapped holes (equivalent to electron trapping into these sites).
Positive (anodic) bias relative to the flatband potential results in partial depletion of electrons from the film, resulting in the formation of a space charge layer at the hematite surface (Scheme 2(ii)). Depending upon the degree of doping and nanostructuring, and the magnitude of the applied bias, this space charge layer can extend up to 10's of nanometers into the hematite film.58 Under these conditions, intraband states located below the conduction band and within the space charge layer become oxidized (vacant of electrons), resulting in the appearance of the 580 nm ground state absorption apparent in Fig. 6. Upon photoexcitation, conduction band electrons within the space charge layer are rapidly (<1 μs) trapped into these oxidized intraband states, causing the bleaching of this 580 nm absorption signal. This population of trapped electrons subsequently decays on the microsecond – 10 ms timescale via two distinct processes. At modest anodic biases, recombination of the trapped electrons with photogenerated holes (Fig. 7) dominates. At significantly anodic biases, an increasing proportion of trapped electrons are swept out by the space charge layer electric field and collected by the external circuit (Scheme 2(iii)). Finally, residual holes that did not recombine with photogenerated electrons accumulate at the photoelectrode surface and drive the oxidation of water on the seconds timescale. The proportion of holes that avoid electron–hole recombination, and are thus able to accumulate at the hematite surface to drive water oxidation, increases with increasing anodic bias, as illustrated in Scheme 2(iii).
4 Relevance to photoelectrochemical water splitting under continuous illumination
Most models of hematite photoanode function have been developed on the basis of frequency domain electrochemical studies, or photocurrent/photovoltage transients.7,8,41,62–64,74,82,83 Such analyses are typically undertaken in the presence of continuous irradiation using only a low intensity voltage or optical perturbation, and can therefore be directly related to continuous device operation. However we note that such photoelectrochemical techniques are typically limited to the measurement of electrical output alone (which for n-type materials such as hematite photoanodes corresponds to electron based currents/voltages), and are unable to observe processes occurring faster than the semiconductor electron transport time. For example, in nanostructured hematite photoanodes such as those studied herein, the relatively slow electron collection times (milliseconds, see Fig. 7) prevent observation in impedance studies of the faster electron–hole recombination dynamics apparent for example in Fig. 3. Furthermore, such impedance studies do not directly observe photogenerated hole dynamics, but rather infer their behavior from the observed electron dynamics.The transient absorption data reviewed in this perspective was collected for photoanodes under electrical bias and pulsed laser excitation, but without continuous white light illumination, as this significantly complicates the transient absorption analysis. Several studies employing photoelectrochemical techniques have emphasized that charge accumulation at the semiconductor surface under solar irradiation may have a significant impact upon kinetic competition between recombination and charge transfer.41,62,82,84 In particular the relatively slow rate constant for water oxidation by hematite holes is likely to result in significant accumulation of photogenerated holes at the hematite surface under continuous irradiation. Such hole accumulation will have a substantial impact upon space charge layer formation at the semiconductor/water interface, and increase the likelihood of multi-hole rather than single hole–water oxidation processes. Transient optical studies under such conditions are currently ongoing, but are beyond the scope of this perspective.
Despite the experimental limitations detailed in the preceding two paragraphs, there is considerable agreement between the results of different experimental techniques. Consistent with the model shown in Scheme 2, photoelectrochemical studies have shown that electron–hole recombination in the depletion layer of hematite can be observed64,84 and that the diffusion length for photoholes is negligible relative to the space charge layer depth. These two factors explain the small number of photoholes that reach the interfacial region in the absence of a strong positive bias. Those photoholes that effectively reach the interfacial region have been shown to be efficiently collected by fast one-electron hole scavengers, like [Fe(CN)6]4− and H2O2.14,15 Several electrochemical studies report sluggish water oxidation kinetics on similar timescales to those observed in our transient absorption studies, with these slow water oxidation kinetics limiting photoanode efficiency.41,62,82,84 Overall, the observed correlation between the yield of long-lived holes measured in our transient studies as a function of applied bias with the current/voltage response of the photoanode is a strong indicator of the relevance of our transient absorption studies to operating PEC devices.
Despite these agreements, some areas of controversy remain, particularly over the role of charge trapping and surface states. Our own studies, and the model illustrated in Scheme 2, have focused on the impact of intraband trap states lying a few hundred millivolts below conduction band – and therefore functioning primarily as electron trap states (at least within the space charge layer, where these states lie above the electron Fermi level). Such electron trap states have also been emphasized in recent photoelectrochemical study by Le Formal et al.83 In contrast, most impedance analyses have included hole trap states lying above the valence band in equivalent circuit models of photoanode function. According to several authors, surface trapping of holes is a key process in the water oxidation mechanism,41,64 but others have suggested that the reaction is likely to involve the injection of holes accumulated at the valence band60 (possibly in the form of high valence Fe states). Our own studies do show evidence of hole trapping, apparent as an transient absorption increase at 580 nm in unbiased or cathodically biased films. However our observation that this transient absorption increase inverts to a bleach signal for voltages only a few hundred millivolts positive of flatband suggests that the intraband states associated with this hole trapping lie only a few hundred meV below the hematite conduction band. Within the space charge layer formed under anodic bias, these states primarily function as electron traps, in agreement with Le Formal et al., mediating electron–hole recombination but not directly involved in the water oxidation process.
5 Electronic transitions in hematite
We end by discussing the possible assignment of the electronic transitions in hematite. To do so, it is instructive to start by discussing the nature of its ground state optical transitions, which has remained a subject of debate until recently. In general, three types of electronic transitions are usually associated with α-Fe2O3: (i) ligand field (LF) or d–d transitions associated to Fe3+ ions; (ii) O 2p → Fe 3d ligand to metal charge transfer (LMCT); and (iii) the pair excitations associated with two magnetically coupled neighboring Fe3+ cations. It has been considered for a long time that the transitions responsible for visible light absorption in hematite are indirect Fe3+ d–d while strong direct charge transfer transitions between the O 2p and Fe 3d orbitals occur only for energies higher than 3.2 eV. This assignment would be consistent with the wavelength dependency of the photochemical response of hematite, based on the hypothesis of the formation of two types of holes.7,85,86 Recently, however, theoretical and experimental studies have indicated that two ligand-to-metal charge transfer bands (O 2p–Fe 3d) occur in the region 440–800 nm.86,87Ab initio calculations by Hartree–Fock88 and density functional methods89,90 have predicted that the highest occupied orbital has a strong O 2p character and the lowest unoccupied energy states are mostly Fe 3d in nature, while soft X-ray absorption and emission spectroscopy studies shave shown of evidence that the valence band is at least strongly hybridized and mostly O 2p in character.91,92Following this discussion, bandgap photoexcitation of hematite most likely occurs due to a charge transfer processes of the type
 | (2) |
 | (3) |
We are, at this stage, unable to distinguish between Fe4+ (or higher valence Fe states) and O− photoholes.
Donor states in hematite have been associated to oxygen vacancies (VO) located below the conduction band.93 Donor-type oxygen vacancies close to the conduction band are observed in several metal oxides and partly responsible for the intrinsic n-type conductivity exhibited by these materials. The nature of traps in Fe3+ doped transition metal oxides and perovskites have also been extensively investigated in the early 1970s.94 According to Clark and Broadhead, the photochromism in Fe3+ doped rutile is associated to hole trapping by ferric acceptors; electrons are trapped at a Fe3+–VO complex forming a Fe2+–VO chromophore, and Fe4+ is not involved in the induced optical absorption, but only serves as a recombination site for the bleaching process.95 Conversely, Faughnan and Kiss consider that the electron trap is an oxygen vacancy and the chromophore is the Fe4+ ion created by hole trapping.96 Our results are consistent with Clark and Broadhead's model whereby increased ground state absorption is observed as the states are oxidized. We therefore tentatively assign the localized states responsible for the spectral features observed at 580 nm in our experiments to iron–oxygen vacancy complexes, as summarized in Scheme 1.
6 Conclusions
Transient absorption spectroscopy has previously been shown to be a powerful probe of charge carrier dynamics in photovoltaic devices such as dye sensitised solar cells.97 In contrast, such studies of photoelectrochemical water splitting systems are relatively underdeveloped. The results we have reviewed herein demonstrate that transient absorption studies can indeed provide key insights into the charge carrier kinetics relevant to water photo-oxidation for one such photoanode, hematite. By monitoring the dynamics of transient decays assigned to hematite photogenerated holes and electrons on timescales of μs to s, we were able to propose a phenomenological model that describes the role of external electrical bias on the photoinduced charge carrier dynamics in this material, in the context of photoelectrochemical water splitting applications. Spectral evidence for the formation of long-lived photoholes under external applied biases positive of the flatband, together with the decrease in the electron–hole recombination rate show the importance of decreasing the background electron-density in hematite photoanodes for efficient water oxidation to occur. Furthermore, our studies highlight the role of applied bias on the trapping of electrons and holes at available intraband states, following light excitation.These results are shown to provide information complementary to more conventional electrochemical studies such as impedance analyses. As such, these studies yield key insights into the factors determining the efficiency of solar driven fuel synthesis by hematite photoelectrodes. They moreover demonstrate the potential of transient optical studies as a powerful probe of photoelectrochemical function likely to be applicable to other systems addressing the grand challenge of solar fuel generation.
Acknowledgements
Financial support from the Engineering and Physical Sciences Research Council, and the European Research Council (Project Intersolar), is gratefully acknowledged. We thank Dr Piers Barnes and Dr Florian Le Formal for helpful discussions.Notes and references
- M. Grätzel, Nature, 2001, 414, 338–344 CrossRef CAS.
- F. E. Osterloh, Chem. Mater., 2008, 20, 35–54 CrossRef CAS.
- A. Kudo and Y. Miseki, Chem. Soc. Rev., 2009, 38, 253–278 RSC.
- M. G. Walter, E. L. Warren, J. R. McKone, S. W. Boettcher, Q. Mi, E. A. Santori and N. S. Lewis, Chem. Rev., 2010, 110, 6446–6473 CrossRef CAS.
- J. H. Kennedy and K. W. Frese, J. Electrochem. Soc., 1978, 125, 709–714 CAS.
- L. A. Marusak, R. Messier and W. B. White, J. Phys. Chem. Solids, 1980, 41, 981–984 CrossRef CAS.
- J. H. Kennedy and K. W. Frese, J. Electrochem. Soc., 1978, 125, 723–726 CrossRef CAS.
- M. P. Dareedwards, J. B. Goodenough, A. Hamnett and P. R. Trevellick, J. Chem. Soc., Faraday Trans. 1, 1983, 79, 2027–2041 RSC.
- R. F. G. Gardner, F. Sweett and D. W. Tanner, J. Phys. Chem. Solids, 1963, 24, 1183–1196 CrossRef CAS.
- F. J. Morin, Phys. Rev., 1951, 83, 1005 CrossRef CAS.
- S. R. Pendlebury, M. Barroso, A. J. Cowan, K. Sivula, J. W. Tang, M. Grätzel, D. Klug and J. R. Durrant, Chem. Commun., 2011, 47, 716–718 RSC.
- Z. Q. Huang, Y. J. Lin, X. Xiang, W. Rodriguez-Cordoba, K. J. McDonald, K. S. Hagen, K. S. Choi, B. S. Brunschwig, D. G. Musaev, C. L. Hill, D. W. Wang and T. Q. Lian, Energy Environ. Sci., 2012, 5, 8923–8926 RSC.
- C. Sanchez, K. D. Sieber and G. A. Somorjai, J. Electroanal. Chem., 1988, 252, 269–290 CrossRef CAS.
- H. Dotan, K. Sivula, M. Gratzel, A. Rothschild and S. C. Warren, Energy Environ. Sci., 2011, 4, 958–964 RSC.
- B. M. Klahr and T. W. Hamann, J. Phys. Chem. C, 2011, 115, 8393–8399 CrossRef CAS.
- J. Brillet, J. H. Yum, M. Cornuz, T. Hisatomi, R. Solarska, J. Augustynski, M. Graetzel and K. Sivula, Nat. Photonics, 2012, 6, 823–827 Search PubMed.
- A. Murphy, P. Barnes, L. Randeniya, I. Plumb, I. Grey, M. Horne and J. Glasscock, Int. J. Hydrogen Energy, 2006, 31, 1999–2017 CrossRef CAS.
- K. G. McGregor, M. Calvin and J. W. Otvos, J. Appl. Phys., 1979, 50, 369–373 CrossRef CAS.
- S. M. Wilhelm, K. S. Yun, L. W. Ballenger and N. Hackerman, J. Electrochem. Soc., 1979, 126, 419–424 CAS.
- J. H. Kennedy, R. Shinar and J. P. Ziegler, J. Electrochem. Soc., 1980, 127, 2307–2309 CrossRef CAS.
- H. Morisaki, H. Ono, H. Dohkoshi and K. Yazawa, Jpn. J. Appl. Phys., 1980, 19, L148–L150 Search PubMed.
- M. V. C. Sastri and G. Nagasubramanian, Int. J. Hydrogen Energy, 1982, 7, 873–876 Search PubMed.
- R. Shinar and J. H. Kennedy, Sol. Energy Mater., 1982, 6, 323–335 CrossRef CAS.
- N. Giordano, E. Passalacqua, V. Antonucci and J. C. J. Bart, Int. J. Hydrogen Energy, 1983, 8, 763–766 Search PubMed.
- K. Itoh and J. O. Bockris, J. Appl. Phys., 1984, 56, 874–876 CrossRef CAS.
- T. Lindgren, L. Vayssieres, H. Wang and S. E. Lindquist, Chem. Phys. Nanostruct. Semicond., 2003, 83–110 Search PubMed.
- E. L. Miller, D. Paluselli, B. Marsen and R. E. Rocheleau, Thin Solid Films, 2004, 466, 307–313 CrossRef CAS.
- A. Duret and M. Gratzel, J. Phys. Chem. B, 2005, 109, 17184–17191 CrossRef CAS.
- J. A. Glasscock, P. R. F. Barnes, I. C. Plumb, A. Bendavid and P. J. Martin, Sol. Hydrogen. Nanotechnol., 2006, 6340, U179–U190 Search PubMed.
- L. Vayssieres, Sol. Hydrogen. Nanotechnol., 2006, 6340, U191–U200 Search PubMed.
- K. Sivula, F. Le Formal and M. Grätzel, ChemSusChem, 2011, 4, 432–449 CrossRef CAS.
- M. T. Mayer, Y. Lin, G. Yuan and D. Wang, Acc. Chem. Res., 2013 DOI:10.1021/ar300302z.
- C. X. Kronawitter, L. Vayssieres, S. Shen, L. Guo, D. A. Wheeler, J. Z. Zhang, B. R. Antoun and S. S. Mao, Energy Environ. Sci., 2011, 4, 3889–3899 RSC.
- Y. Lin, S. Zhou, S. W. Sheehan and D. Wang, J. Am. Chem. Soc., 2011, 133, 2398–2401 CrossRef CAS.
- D. A. Wheeler, G. Wang, Y. Ling, Y. Li and J. Z. Zhang, Energy Environ. Sci., 2012, 5, 6682 RSC.
- X. Wen, S. Wang, Y. Ding, Z. L. Wang and S. Yang, J. Phys. Chem. B, 2004, 109, 215–220 Search PubMed.
- Y. Ling, G. Wang, D. A. Wheeler, J. Z. Zhang and Y. Li, Nano Lett., 2011, 11, 2119–2125 CrossRef CAS.
- S. K. Mohapatra, S. E. John, S. Banerjee and M. Misra, Chem. Mater., 2009, 21, 3048–3055 CrossRef CAS.
- A. Kay, I. Cesar and M. Grätzel, J. Am. Chem. Soc., 2006, 128, 15714 CrossRef CAS.
- J. Brillet, M. Cornuz, F. Le Formal, J.-H. Yum, M. Grätzel and K. Sivula, J. Mater. Res., 2010, 25, 17–24 CrossRef CAS.
- L. M. Peter, K. G. U. Wijayantha and A. A. Tahir, Faraday Discuss., 2012, 155, 309 RSC.
- D. K. Zhong, M. Cornuz, K. Sivula, M. Grätzel and D. R. Gamelin, Energy Environ. Sci., 2011, 4, 1759 RSC.
- K. J. McDonald and K.-S. Choi, Chem. Mater., 2011, 23, 1686–1693 CrossRef CAS.
- S. D. Tilley, M. Cornuz, K. Sivula and M. Grätzel, Angew. Chem., Int. Ed., 2010, 49, 6405–6408 CrossRef CAS.
- Y. Lin, Y. Xu, M. T. Mayer, Z. I. Simpson, G. McMahon, S. Zhou and D. Wang, J. Am. Chem. Soc., 2012, 134, 5508–5511 CrossRef CAS.
- Y. Hou, F. Zuo, A. Dagg and P. Feng, Angew. Chem., Int. Ed., 2013, 52, 1248–1252 Search PubMed.
- I. V. Chernyshova, M. F. Hochella and A. S. Madden, Phys. Chem. Chem. Phys., 2007, 9, 1736–1750 RSC.
- S. Yamamoto, T. Kendelewicz, J. T. Newberg, G. Ketteler, D. E. Starr, E. R. Mysak, K. J. Andersson, H. Ogasawara, H. Bluhm, M. Salmeron, G. E. Brown Jr and A. Nilsson, J. Phys. Chem. C, 2010, 114, 2256–2266 CrossRef CAS.
- P. Liao, M. C. Toroker and E. A. Carter, Nano Lett., 2011, 11, 1775–1781 Search PubMed.
- P. Liao and E. A. Carter, J. Phys. Chem. C, 2011, 115, 20795–20805 Search PubMed.
- A. Hellman and R. G. S. Pala, J. Phys. Chem. C, 2011, 115, 12901–12907 CrossRef CAS.
- N. J. Cherepy, D. B. Liston, J. A. Lovejoy, H. M. Deng and J. Z. Zhang, J. Phys. Chem. B, 1998, 102, 770–776 CrossRef CAS.
- B. S. Zou and V. Volkov, J. Phys. Chem. Solids, 2000, 61, 757–764 CrossRef CAS.
- L. Fu, Z. Wu, X. Ai, J. Zhang, Y. Nie, S. Xie, G. Yang and B. Zou, J. Chem. Phys., 2004, 120, 3406–3413 CrossRef CAS.
- A. G. Joly, J. R. Williams, S. A. Chambers, G. Xiong, W. P. Hess and D. M. Laman, J. Appl. Phys., 2006, 99, 053521–053526 CrossRef.
- M. Barroso, A. J. Cowan, S. R. Pendlebury, M. Gratzel, D. R. Klug and J. R. Durrant, J. Am. Chem. Soc., 2011, 133, 14868–14871 CAS.
- A. J. Cowan, C. J. Barnett, S. R. Pendlebury, M. Barroso, K. Sivula, M. Gratzel, J. R. Durrant and D. R. Klug, J. Am. Chem. Soc., 2011, 133, 10134–10140 CrossRef CAS.
- S. R. Pendlebury, A. J. Cowan, M. Barroso, K. Sivula, J. Ye, M. Grätzel, D. R. Klug, J. Tang and J. R. Durrant, Energy Environ. Sci., 2012, 5, 6304–6312 RSC.
- M. Barroso, C. A. Mesa, S. R. Pendlebury, A. J. Cowan, T. Hisatomi, K. Sivula, M. Grätzel, D. R. Klug and J. R. Durrant, Proc. Natl. Acad. Sci. U. S. A., 2012, 109, 15640–15645 Search PubMed.
- T. Pajkossy, J. Electrochem. Soc., 1983, 130, 632–635 Search PubMed.
- P. Mulvaney, V. Swayambunathan, F. Grieser and D. Meisel, J. Phys. Chem., 1988, 92, 6732–6740 CrossRef CAS.
- K. G. U. Wijayantha, S. Saremi-Yarahmadi and L. M. Peter, Phys. Chem. Chem. Phys., 2011, 13, 5264–5270 RSC.
- F. Le Formal, N. Tetreault, M. Cornuz, T. Moehl, M. Grätzel and K. Sivula, Chem. Sci., 2011, 2, 737–743 RSC.
- B. Klahr, S. Gimenez, F. Fabregat-Santiago, T. Hamann and J. Bisquert, J. Am. Chem. Soc., 2012, 134, 4294–4302 CrossRef CAS.
- V. A. Nadtochenko, N. N. Denisov, V. Y. Gak, F. E. Gostev, A. A. Titov, O. M. Sarkisov and V. V. Nikandrov, Russ. Chem. Bull., 2002, 51, 457–461 Search PubMed.
- Y. P. He, Y. M. Miao, C. R. Li, S. Q. Wang, L. Cao, S. S. Xie, G. Z. Yang, B. S. Zou and C. Burda, Phys. Rev. B: Condens. Matter Mater. Phys., 2005, 71, 125411 CrossRef.
- J. Nelson, S. Haque, D. Klug and J. Durrant, Phys. Rev. B: Condens. Matter Mater. Phys., 2001, 63, 205321–205329 CrossRef.
- J. W. Tang, J. R. Durrant and D. R. Klug, J. Am. Chem. Soc., 2008, 130, 13885–13891 CrossRef CAS.
- A. J. Cowan, J. W. Tang, W. H. Leng, J. R. Durrant and D. R. Klug, J. Phys. Chem. C, 2010, 114, 4208–4214 CrossRef CAS.
- F. M. Pesci, A. J. Cowan, B. D. Alexander, J. R. Durrant and D. R. Klug, J. Phys. Chem. Lett., 2011, 2, 1900–1903 Search PubMed.
- A. J. Bard, J. Am. Chem. Soc., 2010, 132, 7559–7567 CrossRef CAS.
- P. Liao, J. A. Keith and E. A. Carter, J. Am. Chem. Soc., 2012, 134, 13296–13309 Search PubMed.
- F. Jiao and H. Frei, Energy Environ. Sci., 2010, 3, 1018–1027 RSC.
- B. Klahr, S. Gimenez, F. Fabregat-Santiago, J. Bisquert and T. W. Hamann, J. Am. Chem. Soc., 2012, 134, 16693–16700 Search PubMed.
- D. R. Gamelin, Nat. Chem., 2012, 4, 965–967 Search PubMed.
- D. K. Zhong and D. R. Gamelin, J. Am. Chem. Soc., 2010, 132, 4202–4207 CrossRef CAS.
- G. Redmond, A. O'Keeffe, C. Burgess, C. MacHale and D. Fitzmaurice, J. Phys. Chem., 1993, 97, 11081–11086 CrossRef CAS.
- B. Enright and D. Fitzmaurice, J. Phys. Chem., 1996, 100, 1027–1035 CrossRef CAS.
- T. S. Moss, Proc. Phys. Soc., London, Sect. B, 1954, 67, 775 CrossRef.
- N. M. Dimitrijevic, D. Savic, O. I. Micic and A. J. Nozik, J. Phys. Chem., 1984, 88, 4278–4283 CrossRef CAS.
- W. W. Gärtner, Phys. Rev., 1959, 116, 84–87 CrossRef CAS.
- B. Klahr, S. Gimenez, F. Fabregat-Santiago, J. Bisquert and T. W. Hamann, Energy Environ. Sci., 2012, 5, 7626–7636 RSC.
- F. Le Formal, K. Sivula and M. Grätzel, J. Phys. Chem. C, 2012, 116, 26707–26720 Search PubMed.
- T. W. Hamann, Dalton Trans., 2012, 41, 7830–7834 RSC.
- N. C. Debnath and A. B. Anderson, J. Electrochem. Soc., 1982, 129, 2169–2174 CAS.
- M. Gaudon, N. Pailhe, J. Majimel, A. Wattiaux, J. Abel and A. Demourgues, J. Solid State Chem., 2010, 183, 2101–2109 Search PubMed.
- N. Pailhe, A. Wattiaux, M. Gaudon and A. Demourgues, J. Solid State Chem., 2008, 181, 2697–2704 CrossRef CAS.
- M. Catti, G. Valerio and R. Dovesi, Phys. Rev. B: Condens. Matter Mater. Phys., 1995, 51, 7441–7450 CrossRef CAS.
- J. Velev, A. Bandyopadhyay, W. H. Butler and S. Sarker, Phys. Rev. B: Condens. Matter Mater. Phys., 2005, 71, 205208 Search PubMed.
- W. H. Butler, A. Bandyopadhyay and R. Srinivasan, J. Appl. Phys., 2003, 93, 7882–7884 CrossRef.
- Y. Ma, P. D. Johnson, N. Wassdahl, J. Guo, P. Skytt, J. Nordgren, S. D. Kevan, J. E. Rubensson, T. Boske and W. Eberhardt, Phys. Rev. B: Condens. Matter Mater. Phys., 1993, 48, 2109–2111 CrossRef CAS.
- C. X. Kronawitter, I. Zegkinoglou, C. Rogero, J. H. Guo, S. S. Mao, F. J. Himpsel and L. Vayssieres, J. Phys. Chem. C, 2012, 116, 22780–22785 Search PubMed.
- K. Kobayashi, G. Okada and J. Kumanotani, J. Mater. Sci. Lett., 1988, 7, 853–854 Search PubMed.
- A. J. Nozik, J. Phys. C: Solid State Phys., 1972, 5, 3147 Search PubMed.
- W. Clark and P. Broadhead, J. Phys. C: Solid State Phys., 1970, 3, 1047 Search PubMed.
- B. W. Faughnan and Z. J. Kiss, Phys. Rev. Lett., 1968, 21, 1331 Search PubMed.
- A. Listorti, B. O'Regan and J. R. Durrant, Chem. Mater., 2011, 23, 3381–3399 CrossRef CAS.
Footnotes |
| † We note Huang et al.12 have reported that hematite conduction band electrons may also show a broad absorption in the red/near IR. This may be the origin of the broad, short lived absorption extending to 1000 nm shown in Fig. 1 inset. |
| ‡ We note the absorption band assigned to hematite holes, peaking at 650 nm, extends as a broad band between 550 and >900 nm. In contrast, the absorption band assigned to optical excitation from the hematite valence band to intraband trap states exhibits a narrow, relatively short lived signal peaking at 580 nm. We note the long lived absorption signal we have reported previously under positive bias at 580 nm (ref. 11) originates from the former broad absorption feature. |
| § Ideally TAS should be compared with the charge remaining to be extracted, but where the TPC kinetics are dominated by electron–hole recombination, as in the present case, both the TPC decay and charge remaining decay will be approximately single exponential. |
| This journal is © The Royal Society of Chemistry 2013 |
