DOI:
10.1039/C2SC21505E
(Edge Article)
Chem. Sci., 2013,
4, 444-453
Nanomechanical properties of molecular-scale bridges as visualised by intramolecular electronic energy transfer†
Received
12th September 2012
, Accepted 16th October 2012
First published on 17th October 2012
Abstract
A series of molecular dyads has been synthesized and fully characterised. These linear, donor–spacer–acceptor compounds comprise terminal dyes selected to exhibit intramolecular electronic energy transfer (EET) along the molecular axis. The spacer is built by accretion of ethynylene–carborane units that give centre-to-centre separation distances of 38, 57, 76, 96, and 115 Å respectively along the series. The probability of one-way EET between terminals depends on the length of the spacer but also on temperature and applied pressure. Throughout the series, the derived EET parameters are well explained in terms of through-space interactions but the probability of EET is higher than predicted for the fully extended conformation except in a glassy matrix at low temperature. The implication is that these spacers contract under ambient conditions, with the extent of longitudinal contraction increasing under pressure but decreasing as the temperature is lowered. Longer bridges are more susceptible to such distortion, which is considered to resemble a concertina effect caused by out-of-plane bending of individual subunits. The dynamics of EET can be used to estimate the strain energy associated with molecular contraction, the amount of work done in effecting the structural change and the Young's modulus for the bridge.
Introduction
Electronic energy transfer (EET) is of major importance in biology, notably photosynthesis1 and photolyase enzymes,2 and in modern opto-electronic devices such as OLEDs.3 The original theoretical frameworks were developed4,5 more than 50 years ago but have been subjected to considerable modification and extension over the past few decades.6 With specific consideration of intramolecular EET, there are three primary mechanisms that combine to cover most cases. These include electron exchange (or through-bond EET), coulombic interactions (or through-space EET), and bridge-mediated EET.7 The latter8 applies to systems where the donor and acceptor are bridged by a conjugated spacer in such a way that the identities of the three components become somewhat blurred in electronic terms. Electron exchange9 demands orbital overlap between donor and acceptor, often facilitated by super-exchange interactions, where the rate is attenuated exponentially with increasing separation between the reactants.10 This mechanism is important for triplet-excited states11 and for EET in conducting polymers.12 A special situation might arise, however, when the reactants share a common connecting vibrational mode.13
Through-space EET, as first formulated by Förster,5 is most often explained within the confines of the ideal dipole approximation but this might not hold at short (<30 Å) separations unless the transition dipole moment vectors are of uncommonly short length.14 The mechanism, which has been applied widely in biology to measure distances and/or orientations,15 does not require orbital contact and can occur over separations exceeding 100 Å. The requirements for efficient Förster-type EET include good spectral overlap between fluorescence from the donor and absorption by the acceptor and a high radiative rate constant for the donor.16 Additional requisites relate to an appropriate alignment of transition dipole moment vectors17 and to the screening factor imposed by the surrounding medium.18 This latter term is likely to be distance dependent for short (<20 Å) separations,19 where higher-order multipoles have to be considered,20 and where the spatial distribution of the transition moment has to be taken into account. There are the additional challenges of dealing with reactants subjected to Brownian motion that perturbs the overall orientation factor21 and in handling cases where the transition dipole moment vectors are degenerate.22
Many experimental and theoretical studies have addressed the basic premise of how separation distance affects the dynamics of EET23 while other research has used the ideal distance dependence to estimate molecular topology.24 Such work is most likely to succeed over modest separations but to become increasing less reliable as the reactants approach each other. The opposite trend, namely increasing the molecular separation, introduces severe problems in terms of establishing the actual distance between the reactants. Early work in this subject relied on random distributions of donors and acceptors where the mean separation is determined by concentration.25 This situation was improved by attaching the reactants to bio-molecules, such as helical proteins26 or DNA,27 thereby allowing the distance to be better defined. Related studies have used polymers28 to bind the reactants but suffer badly from structural heterogeneity.29 In attempting to design new molecular dyads that overcome these structural problems, our attention was drawn to the possible use of carboranes as building blocks by which to assemble linear molecules of unusual length but high structural integrity.
Carboranes are polyhedral clusters built with skeletal boron and carbon atoms terminated by hydrogen atoms which are used extensively as templates for the preparation of soft matter,30 polymers,31 non-linear materials,32 rigid rods33 and self-assembled molecular structures.34 Notably, closo-para-carborane (C2B10H12) is an electronically closed structure stabilised with 26 electrons. This electronic and geometric shell closure makes carboranes electronically, chemically and thermodynamically rather robust.35 Furthermore, these caged clusters are transparent to visible light and do not exhibit redox activity at normally accessible potentials.36 This realisation prompted us to use closo-para-carborane as a platform through which to link photoactive modules in a rod-like manner (Chart 1).37 Note that the blue dye has been chosen from the distyryl-boron dipyrromethene (Bodipy) family38,39 while the dipyrrolopyrrole (DPP) donor is known for its exceptional stability, ease of chemical modification and well-defined structure.40 For both dyes, the presence of adequate functions (BF2 in the acceptor and dimethylamino-propyne in the donor) help to prevent aggregation.
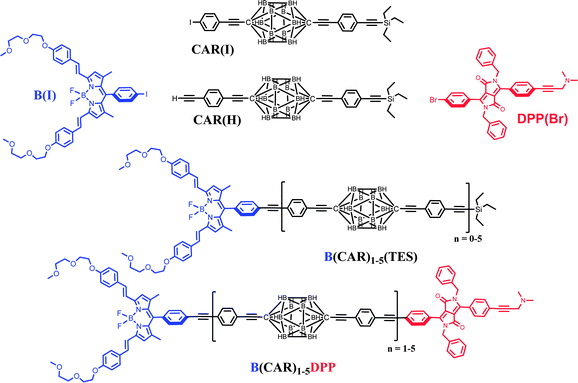 |
| | Chart 1 Chemical structures of the building blocks required to prepare the final B(CAR)nDPP compounds. | |
Results and discussion
Synthesis and characterisation
The compounds of interest here comprise a linear molecular wire of variable length formed by accretion of para-ethynylene–carboranes fitted with terminal chromophores (Chart 1). We used an iterative synthetic protocol starting from the pivotal building blocks B(I), CAR(I), CAR(H) and DPP(Br); see ESI† for synthetic details. Each intermediate B(CAR)nH was used to produce the target dyad and to extend the bridge according to Scheme 1. The initial step requires cross-coupling of B(I) with the carborane CAR(H) in the presence of Pd(0) under mild conditions. Deprotection of the triethylsilane group with NaOH provides the first module for DPP cross-linking, thereby giving subsequent access to the target dyad with N = 1. In fact, the B(CAR)1(H) module is easily coupled to a second carborane unit CAR(I) which could be deprotected or involved in further cross-linking with DPP, thus affording the next target with N = 2. Each member of the family, B(CAR)NDPP, was prepared according to the strategy sketched in Scheme 1 and was characterised fully by NMR (1H, 13C, 11B), ESI-MS, and elemental analysis. The derived spectroscopic data are entirely supportive of the claimed molecular entities. X-Ray crystal structures being unattainable, the critical molecular dimensions were assessed by quantum chemical computations that confirm the fully extended conformations to be the lowest-energy species in each case. In particular, the distances (DCC) between the centres of the terminal fluorophores for the energy-minimised structures are listed in Table 1.
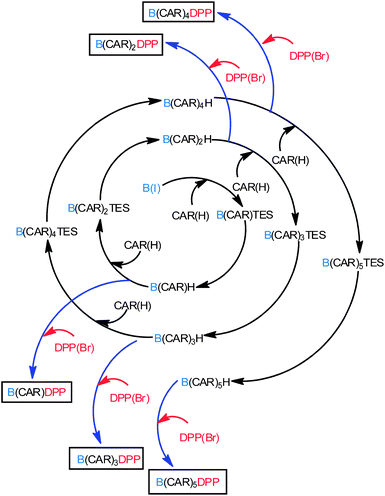 |
| | Scheme 1 Protocol use for the implementation of carborane units and preparation of the target compounds. | |
Table 1 Molecular lengths and selected photophysical properties recorded for the compounds in MTHF solution at 20 °C
| Cmpd |
D
CC/Å |
Φ
F
|
τ
S
/ns |
Φ
F
|
τ
S
/ns |
|
Photophysical data refer to the DPP unit following preferential excitation at 490 nm.
Photophysical data refer to the B unit following selective excitation at 590 nm.
|
| B(CAR)1DPP |
38 |
0.096 |
0.49 |
0.55 |
4.3 |
| B(CAR)2DPP |
57 |
0.44 |
2.48 |
0.55 |
4.3 |
| B(CAR)3DPP |
76 |
0.73 |
4.18 |
0.52 |
4.2 |
| B(CAR)4DPP |
96 |
0.81 |
4.56 |
0.56 |
4.4 |
| B(CAR)5DPP |
115 |
0.84 |
4.75 |
0.54 |
4.3 |
| B(CAR)1(TES) |
NA |
NA |
NA |
0.56 |
4.2 |
| DPP(Br) |
NA |
0.87 |
4.85 |
NA |
NA |
Absorption spectra recorded for the compounds in methyltetrahydrofuran (MTHF) exhibit the expected features characteristic of each chromophore (Fig. 1). In particular, the “blue” Bodipy dye (B) exhibits a strong absorption transition centred at 645 nm (εMAX ≈ 123![[thin space (1/6-em)]](https://www.rsc.org/images/entities/char_2009.gif) 000 M−1 cm−1), with a set of vibronic bands stretching to higher energies.41 The corresponding absorption transition for DPP is easily recognised42 as a series of weaker bands starting at around 497 nm (εMAX ≈ 30
000 M−1 cm−1), with a set of vibronic bands stretching to higher energies.41 The corresponding absorption transition for DPP is easily recognised42 as a series of weaker bands starting at around 497 nm (εMAX ≈ 30![[thin space (1/6-em)]](https://www.rsc.org/images/entities/char_2009.gif) 500 M−1 cm−1). The carborane-based bridge, CAR, absorbs only in the near-UV region, with bands centred in the 300–350 nm region. Band maxima, half-widths and molar absorption coefficients (εMAX) recorded for both B and DPP are insensitive to the molecular length but there is a progressive increase in εMAX for CAR with increasing number of repeat units. Fluorescence spectra (Fig. 2) recorded in MTHF show emission bands characteristic of B41 (λFLU = 662 nm) and DPP42 (λFLU = 570 nm). The blue dye can be excited selectively at 620 nm while the optimal excitation wavelength for DPP is 490 nm, where B absorbs ca. 5% of incident photons. No fluorescence is observed from CAR following excitation at 300 nm. Throughout this work, comparison is made to control compounds for both DPP and B (see ESI† for structures).43
500 M−1 cm−1). The carborane-based bridge, CAR, absorbs only in the near-UV region, with bands centred in the 300–350 nm region. Band maxima, half-widths and molar absorption coefficients (εMAX) recorded for both B and DPP are insensitive to the molecular length but there is a progressive increase in εMAX for CAR with increasing number of repeat units. Fluorescence spectra (Fig. 2) recorded in MTHF show emission bands characteristic of B41 (λFLU = 662 nm) and DPP42 (λFLU = 570 nm). The blue dye can be excited selectively at 620 nm while the optimal excitation wavelength for DPP is 490 nm, where B absorbs ca. 5% of incident photons. No fluorescence is observed from CAR following excitation at 300 nm. Throughout this work, comparison is made to control compounds for both DPP and B (see ESI† for structures).43
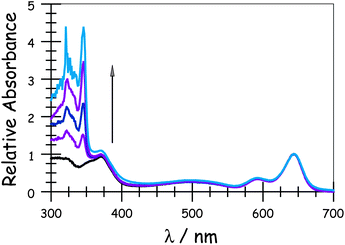 |
| | Fig. 1 Absorption spectra of the target dyads recorded in MTHF: the arrow indicates increases molecular length. | |
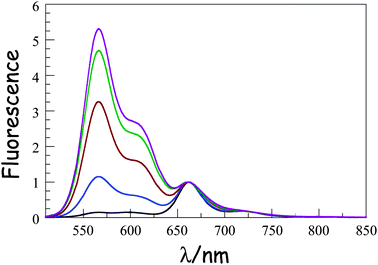 |
| | Fig. 2 Fluorescence spectra recorded for the B(CAR)NDPP compounds in MTHF at room temperature following selective excitation into DPP. The spectra are normalized at the peak of the B emission. N.B The intensity of the DPP band seen around 570 nm increases progressively as the molecular length increases from N = 1 (black curve) to N = 5 (plum curve). | |
Photophysical properties in fluid solution
Fluorescence quantum yields (ΦF) and excited-singlet state lifetimes (τS) recorded for the B and DPP units present in the assembled dyads were compared with those recorded for the isolated control compounds in MTHF at room temperature. The main results are listed in Table 1. In each case, direct excitation into B gives fluorescence characteristic of that unit with ΦF and τS being essentially unperturbed relative to those of the relevant control compound. In contrast, preferential excitation into DPP gives a mixture of fluorescence characteristic of DPP and B, which can be deconvoluted spectrally to allow calculation of the individual ΦF and τS values. It is seen that, in each case, emission from DPP is decreased relative to that recorded for the control compound under identical conditions (taking due account of the 5% photon loss) while emission from B is increased compared to what could be expected on account of the respective absorption spectral profiles. This feature was confirmed by comparison to an equimolar mixture of DPP and B in MTHF. The disparity in ΦF and τS values measured for dyad and control compound in the equimolar mixture increases markedly as the molecular length decreases but becomes difficult to assess with real accuracy for the longest dyad. Indeed, it is more meaningful, at least for the longer analogues, to report the ratio (RDA) of deconvoluted ΦF values measured for DPP relative to B. There is acceptable agreement between the variation in ΦF and τS values along the series, while the time-resolved emission decay curves are well described in terms of mono-exponential fits in each case.
Excitation spectra confirm that quenching of donor emission is due to intramolecular EET from DPP to B under these conditions. The photophysical properties of the acceptor moiety are unaffected by the presence of the donor while the large energy gap between donor and acceptor excited-singlet states (ΔESS = 2400 cm−1) points to unidirectional EET. Rate constants (kEET) and probabilities (PEET) for this step, as derived from the steady-state yields and time-resolved decay profiles, are collected in Table 2. The two sets of data are in good agreement, as are the PEET values determined from the ratio of quantum yields. For the sake of consistency throughout the different sets of experimental results to follow, we have opted to rely on these latter PEET values, which are seen to decrease with increasing molecular length (Table 2).
Table 2 Derived parameters relating to fluorescence quenching in the various dyads as a consequence of intramolecular ETT in MTHF solution at room temperature
| Compound |
D
CC/Å |
P
EET
|
P
EET
|
P
EET
|
P
EET
|
k
EET
/107 s−1 |
d
EFF
,
/Å |
|
Probability of EET calculated on the basis of the IDA and Förster theory.
Calculated from the measured RDA values.
Calculated from the measured τS values.
Calculated from the experimental fluorescence quantum yields.
Calculated on the basis that the IDA is valid for these molecular dyads.
|
| B(CAR)1DPP |
38 |
0.90 |
0.910 |
0.90 |
0.89 |
205 |
37 |
| B(CAR)2DPP |
57 |
0.43 |
0.485 |
0.49 |
0.48 |
19 |
55 |
| B(CAR)3DPP |
76 |
0.12 |
0.166 |
0.14 |
0.16 |
4.1 |
71 |
| B(CAR)4DPP |
96 |
0.032 |
0.064 |
0.060 |
0.073 |
1.4 |
85 |
| B(CAR)5DPP |
115 |
0.011 |
0.020 |
0.022 |
0.025 |
0.42 |
104 |
For the isolated control compounds, the Förster critical distance44 (DCD) is computed to be 54.4 Å for MTHF at room temperature on the basis of the ideal dipole approximation (IDA) being valid for these reactants. Now, the effective separation distance (dEFF) between the centres of the reactants can be estimated from eqn (1) and the derived values are given in Table 2. It is apparent that the probability of Förster-style EET is somewhat higher than expected at the longer separations, although it has to be realised that the experimental uncertainty increases with decreasing extent of fluorescence quenching. Nonetheless, all three estimates of PEET indicate that the effective separation distance is less than that predicted for the fully extended geometries, except for N = 1. These fluorescence experiments were repeated as a function of concentration in order to eliminate any effects due to intermolecular EET, which could be a particular problem for the longer bridges where solubility is limited and neighbouring molecules are necessarily in close contact at modest concentration. However, a 20-fold dilution (from an initial concentration of 2 μM) had no obvious effect on the results.
It can be seen that the IDA allows rather good estimation of the molecular length (i.e., dEFF = 37 Å compared to DCC = 38 Å) for the shortest bridge, thereby confirming an earlier report37 relating to EET across the same bridge but with different terminals. As the molecular length increases, however, dEFF becomes progressively shorter than DCC (Table 2). There are, in fact, several reports45 in the scientific literature to indicate that the reliability of the IDA depends on the distance separating the reactants. Normally it is considered that Förster theory works well at large separations but becomes suspect when the distance between the reactants is comparable to the sum of the lengths of the transition dipole moment vectors. The carborane-based system, which spans an unusually wide variation in separation distance, appears to behave in the opposite sense! The most likely cause of this effect is that the molecular bridges are susceptible to out-of-plane bending that provides access to molecules with decreased DCC.
| |  | (1) |
Effect of lowering the temperature
It has been demonstrated experimentally that the bending rigidity of molecular surfaces is temperature dependent.46 We might expect similar behaviour for the carborane-bridged molecular dyads under investigation here. As such, fluorescence spectra were recorded in MTHF as a function of temperature. On cooling the solution (Fig. 3), the emission maxima recorded for DPP and B undergo modest red shifts due to the temperature-induced change in polarisability of MTHF.47 This effect is more pronounced for B than for DPP because of the increased charge-transfer character inherent to the former chromophore. As a consequence, there is a progressive decrease in the spectral overlap integral associated with intramolecular EET from DPP to B, but this remains a small effect for fluid solution. On approaching the freezing point of MTHF (i.e., 140 K), the emission maximum observed for B continues to be red shifted but that for DPP undergoes a blue shift. This reversal in the hypsochromicity has a marked effect on the spectral overlap integral in the frozen state, which is reduced with decreasing temperature. Lowering the temperature also causes a significant increase in the solvent refractive index,48 which is also a factor involved in controlling kEET. These various changes combine to affect the magnitude of the Förster critical distance, which falls from 54.4 Å at room temperature to 52.8 Å at 77 K.
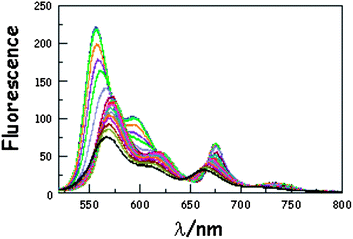 |
| | Fig. 3 Effect of temperature on the emission spectrum recorded for B(CAR)3DPP in MTHF following excitation into DPP. The temperature ranges from 293 to 77 K while the overall intensity increases steadily with decreasing temperature. N.B. The black line corresponds to the spectrum recorded at 293 K. | |
Apart from the above-mentioned spectral shifts, lowering the temperature also affects the relative ratio of intensities of the two emission bands following preferential excitation into DPP. Indeed, RDA tends to increase in favour of emission from DPP as the temperature decreases. Consequently, as shown in Fig. 4, there is a progressive decrease in PEET on lowering the temperature. The longest bridge, N = 5, suffers from limited solubility at low temperature and, in this case, the results should be treated cautiously. The shortest analogue, N = 1, is insensitive to temperature; PEET falls from 91% at room temperature to 88% at 77 K (Table 3). On the basis of EET occurring via the Förster IDA mechanism, this drop in efficacy could be explained in terms of dEFF increasing from 37 Å at room temperature to 38 Å at 77 K. The longer bridges display more significant temperature effects in respect of their PEET values, before approaching a near constant value in the solid at around 100 K (Table 3). One possible explanation for this behaviour is that the average separation distance increases as the temperature falls, perhaps reaching the fully extended conformation in the glassy matrix.
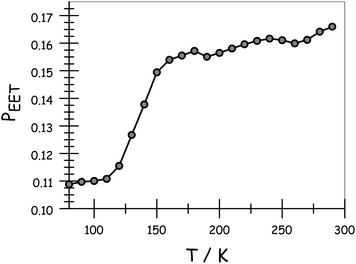 |
| | Fig. 4 Effect of temperature on the probability of EET across the molecular dyad in MTHF. Data are shown for N = 3. Corresponding plot and tabulated data for all compounds are given in the ESI.† | |
Table 3 Various parameters associated with the molecular dyads in frozen MTHF or as a consequence of melting the solvent at ca. 140 K
| Compound |
N
|
P
EET
|
D
77
/Å |
ΔL/Å |
S
T
|
(US/NK)/Å2 |
K
MID/KENDc |
|
Probability of EET measured at 77 K using the fluorescence ratio method.
Center-to-center separation distance at 77 K as calculated from the idealized dipole approximation.
Crude ratio of the spring constants estimated for the “end” and “middle” components of the bridge.
|
| B(CAR)1DPP |
1 |
0.88 |
38 |
0.6 |
0.016 |
0.18 |
NA |
| B(CAR)2DPP |
2 |
0.40 |
56.5 |
1.5 |
0.027 |
0.28 |
3.8 |
| B(CAR)3DPP |
3 |
0.11 |
75 |
2.6 |
0.035 |
0.38 |
5.3 |
| B(CAR)4DPP |
4 |
0.027 |
96 |
4.0 |
0.042 |
0.50 |
6.8 |
| B(CAR)5DPP |
5 |
0.012 |
110 |
4.0 |
0.036 |
0.32 |
3.9 |
Effect of applied pressure
In this experiment, emission spectra were recorded for the various dyads in MTHF at 20 °C as a function of increasing pressure. It is known49 that pressure raises the density of the solvent and has a small effect on the polarisability of MTHF. This latter effect causes a slight red shift for the fluorescence maxima of both emitters (Fig. 5) but the spectral overlap term does not change significantly at pressures below 550 MPa. These spectral shifts are independent of molecular length (see ESI†). Close scrutiny of these latter results indicates that both DPP and B undergo red shifts of ca. 350 cm−1 over the full pressure range; the shift increasing in an almost linear manner with applied pressure.47 In each case, the original fluorescence profile is restored on release of the pressure.
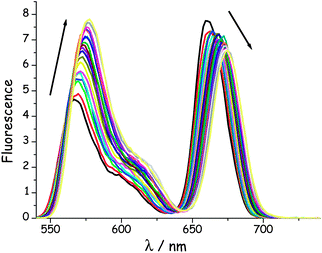 |
| | Fig. 5 Effect of applied pressure on the fluorescence spectrum recorded for B(CAR)3DPP in MTHF at 20 °C after selective excitation into DPP. The pressure range is from atmospheric to 550 MPa. N.B. Pressure causes a steady increase in emission from DPP and a corresponding decrease for B, marked by the respective arrows. | |
On applying pressure to a solution of the carborane-bridged molecular dyads in MTHF at 293 K there is a progressive increase in emission from DPP and a concomitant decrease in fluorescence from B (Fig. 5). As such, we can conclude that the mean PEET decreases under pressure. The origin of this effect can be traced to several factors; the best way to correct for these factors is to focus on the coulombic coupling matrix element VDA rather than simply compare PEET values. This particular term can be determined from eqn (2) where JDA is the spectral overlap integral and s is the solvent screening factor computed from eqn (3). Now, increased pressure causes a small reduction in JDA and a minor change in absorbance at the excitation wavelength due to compression of the solvent.49 Such corrections are trivial, however, and change the derived VDA values by less than 5%. Elevated pressure also serves to increase the refractive index of MTHF,49 which affects the magnitude of PEET by way of altering s. This requires a more significant correction. Indeed, after taking due account of the pressure-induced decrease in s, it becomes clear that increasing pressure causes VDA to increase steadily, regardless of the length of the connection. The rise in VDA is of the order of 6, 20, 21, 13 and 8% for N = 1, 2, 3, 4 and 5, respectively, as measured over the full pressure range. In each case, the rate of change of VDA with pressure is almost linear and does not tend towards a plateau (Fig. 6). Having applied the obvious correction factors, the most reasonable explanation of these results is that high pressure causes the bridge to contract so as to bring the terminals into closer proximity (vide infra).
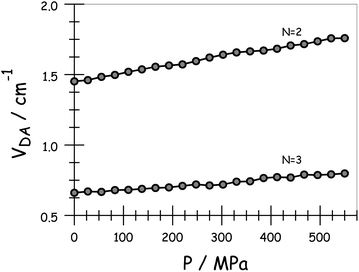 |
| | Fig. 6 Effect of applied pressure on the electronic coupling matrix element for EET across the terminal as derived in MTHF at 20 °C. | |
Using the IDA model,45 the derived VDA terms can be converted into dEFF values on the basis of eqn (4). Here, μD (μA) is the transition dipole moment of the donor (acceptor), as determined50 from absorption spectroscopy in MTHF at that pressure (see ESI†). In fact, pressure has only a minor effect on these latter values. The available data can be interpreted in terms of the molecular length contracting steadily with increasing pressure, with the significance of the effect increasing with the length of the bridge. For example, the shortest bridge is not much affected by applied pressure and undergoes a minor contraction of ca. 1.6 Å. In contrast, N = 4 shows the largest contraction of 6.2 Å over the same pressure range.
| |  | (2) |
| |  | (3) |
| |  | (4) |
Refining the molecular length
With the exception of N = 5, where experimental uncertainty makes the results unreliable, the emission studies can be used to determine the molecular length on the assumption that low temperature favours the fully extended conformation while applied pressure causes the terminals to approach each other. As such, the effective separation distances (d77K) calculated at 77 K on the basis that the IDA45 holds for this system are listed in Table 3. Before attempting to rationalise the variations in molecular length associated with temperature or pressure effects it should be noted that there is excellent agreement between D77K and DCC for N = 1. It is also important to recognise the possible limitations of the IDA approach at distances less than ca. 50 Å. Many of these problems can be overcome by replacing the IDA with the extended dipole method introduced by Kuhn51 and applied by other groups.52 This was not the case here, however, since the same values were derived by both methods.
The variation of dEFF with temperature has the appearance of two separate effects (Fig. 7). The molecular length is reasonably constant over the temperature range where the solvent is frozen but decreases by a significant amount near the melting point. This “spring-like” effect is suggestive of the molecular geometry being somewhat strained in the solid state but becoming more relaxed in the fluid. In each case, the effect occurs at ca. 140 K; this is not the glass transition temperature, believed to be around 90–95 K, but is in agreement with estimates (e.g., 137 K)53 of the melting point of MTHF. The magnitude of this strain, ST, can be computed from eqn (5) and, apart from N = 5, is seen to increase with increasing molecular length (Table 3). In principle, the strain energy per carborane, US/N, can be calculated from eqn (6) on the basis of elastic behaviour but this requires knowledge of the spring constant, K, associated with geometry relaxation at each carborane unit. We have no information on this latter term but, from comparison of the total strain energy (i.e., the product of US and N), it appears that it is not constant across the series. Rather, ΔL increases as the bridge becomes longer. By partitioning the total strain energy into spring constants related to the carborane-to-terminal units (KEND) and to the inter-carborane units (KMID), it becomes clear that the latter are more flexible. Furthermore, these units act cooperatively to increase the total stretching length (Table 3). In order words, these internal linkages are primarily responsible for the geometry relaxation accompanying melting of the solvent.
| |  | (5) |
| |  | (6) |
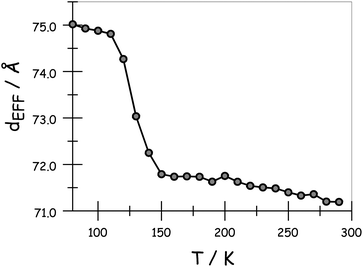 |
| | Fig. 7 Derived effect of temperature on the effective molecular length for N = 3 in MTHF. | |
A more gradual contraction is seen as the temperature continues to rise and this is consistent with out-of-plane bending modes that have vibrational transition energies comparable to kBT.54 Since the carborane unit is unlikely to distort, compression of the molecular length must be confined to the tolane-like linkages, which are known55 to distort under ambient conditions. The extent of molecular contraction in the liquid phase as a function of temperature can be considered in terms of eqn (7), which is a modified form of expressions employed to account for the bending rigidity of graphene56 and related materials.57 Here, LLIQ refers to the projected molecular length in the liquid phase at 0 K and F is a parameter that depends on bridge composition and length; F has units equivalent to force such that the product (W = F × LLIQ:ΔLLIQ = LLIQ − L) corresponds to the total amount of work done in bringing about the structural change and this remains surprisingly constant across the series. Expansion of eqn (7) into a Taylor series allows further refinement of F and shows that this term decreases markedly with increasing N (Table 4). As such, we can conclude that the inherent stiffness, and in particular its sensitivity towards changes in temperature, decreases as the bridge gets longer. Similar behaviour46 has been noted for certain surfactant molecules packed into a lipid membrane.
| |  | (7) |
Table 4 Derived parameters relating to the temperature dependence for EET in the liquid phase
| Compound |
N
|
L
LIQ
/Å |
ΔLb/Å |
F/pN |
W/perg |
|
Center-to-center separation distance extrapolated for the liquid phase to 0 K as calculated from the idealized dipole approximation.
Contraction of the molecular length on heating from 0 to 295 K in the liquid phase.
|
| B(CAR)1DPP |
1 |
38.1 |
1.2 |
33.4 |
0.040 |
| B(CAR)2DPP |
2 |
57.1 |
2.2 |
18.2 |
0.040 |
| B(CAR)3DPP |
3 |
75.0 |
4.8 |
8.2 |
0.039 |
| B(CAR)4DPP |
4 |
97.0 |
10.7 |
3.6 |
0.038 |
| B(CAR)5DPP |
5 |
109.6 |
11.0 |
3.5 |
0.039 |
The same approach can be applied to the pressure effect at ambient temperature (Table 5). From the experimental results highlighted above, it appears that pressure distorts the bridge so as to bring the terminals into closer proximity. It is considered that, under high pressure, the terminals are locked into the contracted geometry – as opposed to sampling a wide distribution of molecular lengths as might be expected at atmospheric pressure.58 Separate studies have shown that the photophysical properties of the DPP donor are insensitive to applied pressure, at least in MTHF. Using the IDA approach,45 the pressure-induced changes in dEFF from atmospheric pressure to 550 MPa are on the order of 1–7 Å and tend to increase progressively with increasing molecular length (Table 5). The driving force for this effect arises from the need to minimise the molecular volume and this is best achieved by compressing the bridge in a zigzag fashion (i.e., an accordion- or concertina-type compression).
Table 5 Summary of the parameters derived from the pressure dependence recorded for the compounds in MTHF solution at 20 °C
| Compound |
N
|
L
p/Å |
ΔLa/Å |
E/GPa |
R
C
/Å |
|
Length contraction measured over the full pressure range from atmospheric pressure to an applied pressure of 550 MPa.
Radius derived from the cross-sectional area assuming the latter is circular.
|
| B(CAR)1DPP |
1 |
37.0 |
1.6 |
12.48 |
1.4 |
| B(CAR)2DPP |
2 |
55.4 |
3.5 |
8.52 |
1.0 |
| B(CAR)3DPP |
3 |
72.8 |
4.7 |
8.34 |
0.7 |
| B(CAR)4DPP |
4 |
84.8 |
6.2 |
7.42 |
0.5 |
| B(CAR)5DPP |
5 |
105.0 |
4.7 |
12.05 |
0.5 |
Applied pressure causes stress on the molecule; stress is normally considered as being force per unit area and has the same units as pressure. It can also be described in terms of the Young's modulus, E, of the compressible material,59 although the relationship is often nonlinear.60 For the various dyads studied here, the isothermal compressibility data are well accounted for in terms of eqn (8) where LP is the molecular length at atmospheric pressure; again the significance of N = 5 is marginal because of experimental limitations. Now, we see that the Young's modulus for a carborane bridge is estimated as being on the order of ca. 10 GPa but that the actual value decreases somewhat with increasing length of the bridge (Table 5). This is clear indication that longer bridges are more amenable to longitudinal distortion under pressure. There is also a significant increase in bulk viscosity of MTHF over this pressure range49 and this is likely to minimize large fluctuations in dEFF. Information on how applied pressure affects the length of semi-rigid molecules, in contrast to flexible polymers,61 is scarce but recent work serves to illustrate that large-scale torsional motions are dampened at high pressure.49 We are unaware of any prior attempts to record E for organic-based molecular bridges, although an E value of ca. 130 GPa has been reported57a for β-SiC nanowires. This same work reports that E increases with decreasing temperature, which is the same general trend as observed in our work.
| |  | (8) |
These results can be tested for self consistency by reference to the fact that Young's modulus can be expressed in terms of stress divided by strain. This leads to eqn (9) where the force, F, is taken from the temperature-dependent studies described earlier and A is the cross-sectional area of the contractor. Taking the latter as a circle, the radius of the contractor, RC, can be estimated from the experimental data (Table 5). It appears that this term has the appropriate dimensions (i.e., RC = 0.86 Å) for a nanowire as might be formed from the carborane bridge.
| |  | (9) |
Conclusion
Molecular surfaces, often represented as flat and smooth plates of well-defined area, appear curved or distorted under closer scrutiny. Such behaviour has been recognised for graphene,62 where curvature is a prerequisite for formation of carbon nanotubes, and for lipid bilayers.63 In the latter case, X-ray scattering64 shows severe bumps and crevices in the surface. It follows that long, linear molecules will also distort in solution at ambient temperature and pressure. This is certainly the case for duplex DNA65 and for conjugated polymers,66 where the importance of cooperative domains has been stressed. Other supposedly rigid, rod-like molecules can distort to such a degree that their orientation in solution might differ dramatically from that of the fully extended species. Molecular dynamic simulations67 offer a means by which to inspect possible torsional motions but do not provide experimental support for a dynamic molecular topology. High-field NMR spectroscopy can give meaningful structural information about molecular rigidity in solution55 but is time consuming and requires careful calibration. Here, we apply fluorescence spectroscopy to probe the effective length of “stiff” molecular dyads equipped with terminal fluorophores. It has been shown that, in the extreme case, a molecular dyad with an extended molecular length of ca. 85 Å contracts by as much as 6 Å under applied pressure at ambient temperature. There is a corresponding extension of ca. 10 Å on cooling to 0 K. A direct consequence of this situation is that the probability of EET between terminal groups depends markedly on the local environment even for seemingly rigid bridges.
The molecular dyads examined herein have the crude appearance of plate-like terminals separated by a semi-rigid cylindrical rod and such topologies might be particularly sensitive to pressure effects. Indeed, we consider the overall pressure and temperature effects in terms of force applied to the flat terminals causing structural distortion (i.e., compression) at the centre of the connector. An interesting feature to emerge from our analysis is that the carborane-based linkages comprising the connector act in a cooperative manner. Thus, the carborane-terminal linkages are robust and possess relatively small spring constants. The carborane–carborane connections, however, take up more strain and the corresponding spring constant increases with increasing number of accreted units. As such, the amount of work needed to compress the molecule decreases substantially with increasing number of carboranes.
Notes and references
-
R. E. Blankenship, Molecular Mechanism of Photosynthesis, Blackwell Science, Oxford, 2002 Search PubMed.
-
(a) A. Sancar, Chem. Rev., 2003, 103, 2203–2237 CrossRef CAS;
(b) K. Brettel and M. Byrdin, Curr. Opin. Struct. Biol., 2010, 20, 693–701 CrossRef CAS.
- K. Hong and J.-L. Lee, Electron. Mater. Lett., 2011, 7, 77–91 Search PubMed.
- D. L. Dexter, J. Chem. Phys., 1952, 21, 836–850 CrossRef.
- T. Förster, Discuss. Faraday Soc., 1959, 27, 7–17 RSC.
-
(a) S. J. Jang, M. D. Newton and R. J. Silbey, Phys. Rev. Lett., 2004, 92, 218301 CrossRef;
(b) H. Sumi, J. Phys. Chem. B, 1999, 103, 252–260 CrossRef CAS;
(c) D. Beljonne, C. Curutchet, G. D. Scholes and R. J. Silbey, J. Phys. Chem. B, 2009, 113, 6583–6599 CrossRef CAS.
- B. Fückel, A. Kohn, M. E. Harding, G. Diezemann, G. Hinze, T. Basche and J. Gauss, J. Chem. Phys., 2008, 128, 074505 CrossRef.
-
(a) J. Seth, V. Palaniappan, T. E. Johnson, S. Prathapan, J. S. Lindsey and D. F. Bocian, J. Am. Chem. Soc., 1994, 116, 10578–10592 CrossRef CAS;
(b) K. Kilsa, J. Kajanus, J. Martensson and B. Albinsson, J. Phys. Chem. B, 1999, 103, 7329–7339 CrossRef;
(c) M. P. Eng and B. Albinsson, Angew. Chem., Int. Ed., 2006, 45, 5626–5629 CrossRef CAS.
- V. May, Dalton Trans., 2009, 10086–10105 RSC.
-
(a) B. Schlicke, P. Belser, L. De Cola, E. Sabbioni and V. Balzani, J. Am. Chem. Soc., 1999, 121, 4207–4214 CrossRef CAS;
(b) R. K. Lammi, R. W. Wagner, A. Ambroise, J. R. Diers, D. F. Bocian, D. Holten and J. S. Lindsey, J. Phys. Chem. B, 2001, 105, 5341–5352 CrossRef CAS.
-
(a) D. M. Guldi, Chem. Soc. Rev., 2002, 31, 22–36 RSC;
(b) A. Harriman and R. Ziessel, Chem. Commun., 1996, 1707–1716 RSC.
-
(a) B. J. Schwartz, Annu. Rev. Phys. Chem., 2003, 54, 141–172 CrossRef CAS;
(b) E. Collini and G. D. Scholes, Science, 2009, 323, 369–373 CrossRef CAS.
- E. Hennebicq, D. Beljonne, C. Curutchet, G. D. Scholes and R. J. Silbey, J. Chem. Phys., 2009, 130, 214505 CrossRef CAS.
- H. Sahoo, D. Roccatano, A. Hennig and W. N. Nau, J. Am. Chem. Soc., 2007, 129, 9762–9772 CrossRef CAS.
-
(a) B. Schuler, E. A. Lipman, P. J. Steinbach, M. Kumke and W. A. Eaton, Proc. Natl. Acad. Sci. U. S. A., 2005, 102, 2754–2759 CrossRef CAS;
(b) D. B. Van Beek, M. C. Zwier, J. M. Shorb and B. P. Krueger, Biophys. J., 2007, 92, 4168–4178 CrossRef CAS.
- F. R. Li, S. I. Yang, Y. Z. Ciringh, J. Seth, C. H. Martin, D. L. Singh, D. H. Kim, R. R. Birge, D. F. Bocian, D. Holten and J. S. Lindsey, J. Am. Chem. Soc., 1998, 120, 10001–10017 CrossRef CAS.
-
(a) K. F. Wong, B. Bagchi and P. J. Rossky, J. Phys. Chem. A, 2004, 108, 5752–5763 CrossRef CAS;
(b) P. M. Dolan, D. Miller, R. J. Cogdell, R. R. Birge and H. A. Frank, J. Phys. Chem. B, 2001, 105, 12134–12142 CrossRef CAS;
(c) A. Harriman, L. J. Mallon and R. Ziessel, Chem.–Eur. J., 2008, 14, 11462–11473 Search PubMed.
- C. Curutchet, G. D. Scholes, B. Mennucci and R. Cammi, J. Phys. Chem. B, 2007, 111, 13253–13265 CrossRef CAS.
- G. D. Scholes, C. Curutchet, B. Mennucci, R. Cammi and J. Tomasi, J. Phys. Chem. B, 2007, 111, 6978–6982 CrossRef CAS.
- M. Challacombe, E. Schwegler and J. Almlöf, Chem. Phys. Lett., 1995, 241, 67–72 CrossRef CAS.
- R. E. Dale, J. Eisinger and W. E. Blumberg, Biophys. J., 1979, 26, 161–194 CrossRef CAS.
- J. Martensson, Chem. Phys. Lett., 1994, 229, 449–456 CrossRef CAS.
-
(a) H. Lu, O. Schops, U. Woggon and C. M. Niemeyer, J. Am. Chem. Soc., 2008, 130, 4815–4827 CrossRef CAS;
(b) J. Zhang, Y. Fu, M. H. Chowdhury and J. R. Lakowicz, J. Phys. Chem. C, 2007, 111, 11784–11792 CrossRef.
-
(a) K. E. Sapsford, L. Berti and I. L. Medintz, Angew. Chem., Int. Ed., 2006, 45, 4562–4588 CrossRef CAS;
(b) M. C. Wilson, D. Meredith and A. P. Halestrup, J. Biol. Chem., 2002, 277, 3666–3672 Search PubMed.
-
(a) V. Balzani and A. Juris, Coord. Chem. Rev., 2001, 211, 97–115 CrossRef CAS;
(b) U. Gosele, Chem. Phys. Lett., 1976, 43, 61–64 CrossRef.
-
(a) C. G. Brouillette, W. J. Dong, Z. R. W. Yano, M. J. Ray, I. I. Protasevich, H. C. Cheung and J. A. Emgler, Biochemistry, 2005, 44, 16413–16425 Search PubMed;
(b) S. Karasawa, T. Araki, T. Nagai, H. Mizuno and A. Miyawaki, Biochem. J., 2004, 381, 307–312 CrossRef CAS.
-
(a) A. M. Brun and A. Harriman, J. Am. Chem. Soc., 1994, 116, 10383–10393 CrossRef CAS;
(b) C. V. Kumar and E. H. Asuncion, J. Am. Chem. Soc., 1993, 115, 8547–8553 CrossRef CAS;
(c) B. H. Yun, J. O. Kim, B. W. Lee, P. Lincoln, B. Norden, J. M. Kim and S. K. Kim, J. Phys. Chem. B, 2003, 107, 9858–9864 CrossRef CAS.
-
(a) S. Wang, B. S. Gaylord and G. C. Bazan, J. Am. Chem. Soc., 2004, 126, 5446–5451 CrossRef CAS;
(b) E. V. Kuzmenkina, C. D. Heyes and G. U. Nienhaus, Proc. Natl. Acad. Sci. U. S. A., 2005, 102, 15471–15476 CrossRef CAS;
(c) B. C. Lee, R. N. Zuckermann and K. A. Dill, J. Am. Chem. Soc., 2005, 127, 10999–11009 CrossRef CAS.
- D. E. Makarov and K. W. Plaxco, J. Chem. Phys., 2009, 131, 085105 Search PubMed.
-
(a) P. Kaszynski, S. Pakhomov, K. F. Tesh and V. G. Young Jr, Inorg. Chem., 2001, 40, 6622–6631 CrossRef CAS;
(b) P. Kaszynski and A. G. Douglass, J. Organomet. Chem., 1999, 581, 28–38 CrossRef CAS.
- M. A. Fox and K. Wade, J. Mater. Chem., 2002, 12, 1301–1306 RSC.
- J. Taylor, J. Cruso, A. Newlon, U. English, K. Ruhlandt-Senge and J. T. Spencer, Inorg. Chem., 2001, 40, 3381–3388 CrossRef CAS.
- J. Vicente, M.-T. Chicote and M. M. Alvarez-Falcon, Organometallics, 2003, 22, 4792–4797 CrossRef CAS.
- H. Jude, H. Disteldorf, S. Fischer, T. Wedge, A. M. Hawkridge, A. M. Arif, M. F. Hawthorne, D. C. Muddiman and P. J. Stang, J. Am. Chem. Soc., 2005, 127, 12131–12139 CrossRef CAS.
- R. E. Williams, Chem. Rev., 1992, 92, 177–207 CrossRef CAS.
- J. Plesek, Chem. Rev., 1992, 92, 269–278 CrossRef CAS.
- R. Ziessel, G. Ulrich, J.-H. Olivier, T. Bura and A. Sutter, Chem. Commun., 2010, 7978–7980 Search PubMed.
-
(a) G. Ulrich, R. Ziessel and A. Harriman, Angew. Chem., Int. Ed., 2008, 47, 1184–1201 CrossRef CAS;
(b) A. Loudet and K. Burgess, Chem. Rev., 2007, 107, 4891–4932 CrossRef CAS;
(c) N. Boens, V. Leen and W. Dehaen, Chem. Soc. Rev., 2012, 41, 1130–1172 RSC.
- R. Ziessel, P. Retailleau, K. J. Elliott and A. Harriman, Chem.–Eur. J., 2009, 15, 10369–10374 CrossRef CAS.
- D. Hablot, P. Retailleau and R. Ziessel, Chem.–Eur. J., 2010, 16, 13346–13351 CrossRef CAS.
-
(a) T. Rousseau, A. Cravino, J. Roncali, T. Bura, G. Ulrich and R. Ziessel, Chem. Commun., 2009, 1673–1675 RSC;
(b) J. H. Olivier, A. Haefele, P. Retailleau and R. Ziessel, Org. Lett., 2010, 12, 408–411 CrossRef CAS.
-
(a) L. Bürgi, M. Turbiez, R. Pfeiffer, F. Bienewald, H. Kimer and C. Winnewisser, Adv. Mater., 2008, 20, 2217–2224 CrossRef CAS;
(b) A. B. Tamayo, B. Walker and T. Nguyen, J. Phys. Chem. C, 2008, 112, 11545–11551 CrossRef CAS.
- D. Hablot, A. Harriman and R. Ziessel, Angew. Chem., Int. Ed., 2011, 50, 7833–7836 Search PubMed.
- S. Saini, H. Singh and B. Bagchi, J. Chem. Sci., 2006, 118, 23–35 Search PubMed.
-
(a) A. Munoz-Losa, C. Curutchet, B. P. Krueger, L. R. Hartsell and B. Mennucci, Biophys. J., 2009, 96, 4779–4788 CrossRef CAS;
(b) E. Dolghih, W. Ortiz, S. Kim, B. P. Krueger, J. L. Krause and A. E. Roitberg, J. Phys. Chem. A, 2009, 113, 4639–4646 CrossRef CAS.
- P. Liu and Y. W. Zhang, Appl. Phys. Lett., 2009, 94, 231912 Search PubMed.
- I. Renge, J. Phys. Chem. A, 2000, 104, 7452–7463 CrossRef CAS.
- P. D. Zoon and A. M. Brouwer, Photochem. Photobiol. Sci., 2009, 8, 345–353 RSC.
- M. A. H. Alamiry, J. P. Hagon, A. Harriman, T. Bura and R. Ziessel, Chem. Sci., 2012, 3, 1041–1048 RSC.
- P. O. Andersson, T. Gillbro, L. Ferguson and R. J. Cogdell, Photochem. Photobiol., 1991, 54, 353–360 CAS.
- V. Czikklely, H. D. Försterling and H. Kuhn, Chem. Phys. Lett., 1970, 6, 207–211 CrossRef CAS.
- D. Markovitsi, S. Marguet, L. K. Gallos, H. Sigal, P. Millié, P. Argyrakis, H. Ringsdorf and S. Kumar, Chem. Phys. Lett., 1999, 306, 163–167 CrossRef.
- D. Zimdars, A. Tokmakoff, S. Chen, S. R. Greenfield, M. D. Fayer, T. I. Smith and H. A. Schwettman, Phys. Rev. Lett., 1993, 70, 2718–2721 CrossRef CAS.
- Y. Tsuda, H. Yasutake, A. Ishijima and T. Yanagida, Proc. Natl. Acad. Sci. U. S. A., 1996, 93, 12937–12942 CrossRef CAS.
- A. A. Bothner-By, J. Dadok, T. E. Johnson and J. S. Lindsey, J. Phys. Chem., 1996, 100, 17551–17557 CrossRef CAS.
- P. Liu and Y. W. Zhang, Appl. Phys. Lett., 2009, 94, 231912 Search PubMed.
-
(a) T. Y. Kim, S. S. Han and H. M. Lee, Mater. Trans., 2004, 45, 1442–1449 Search PubMed;
(b) E. Kurtisovski, N. Taulier, R. Ober, M. Waks and W. Urbach, Phys. Rev. Lett., 2007, 98, 258103 CrossRef.
- D. Badali and C. C. Gradinaru, J. Chem. Phys., 2011, 134, 225102 Search PubMed.
-
(a) A. V. Dobrynin, J.-M. Y. Carrillo and M. Rubinstein, Macromolecules, 2010, 43, 9181–9190 Search PubMed;
(b) T. R. Strick, J.-F. Allemand, D. Bensimon, A. Bensimon and V. Croquette, Science, 1996, 271, 1835–1837 CrossRef CAS.
- N. Schwarzer, Philos. Mag., 2012, 92, 1631–1648 Search PubMed.
-
(a) R. Casalini and C. M. Roland, Macromolecules, 2005, 38, 1779–1788 Search PubMed;
(b) J. Liu, S. Z. Wu, D. P. Cao and L. Q. Zhang, J. Chem. Phys., 2008, 129, 154905 CrossRef.
- O. Frank, G. Tsoukleri, J. Parthenios, K. Papagelis, I. Riaz, R. Jalil, K. S. Novoselov and C. Galiotis, ACS Nano, 2010, 4, 3131–3138 CrossRef CAS.
- N. Unwin, J. Mol. Biol., 1993, 229, 1101–1124 CrossRef CAS.
-
(a) W. Rawicz, K. C. Olbrich, T. McIntosh, D. Needham and E. Evans, Biophys. J., 2000, 79, 328–339 CrossRef CAS;
(b) N. Fuller and R. P. Rand, Biophys. J., 2001, 81, 243–254 CrossRef CAS.
-
(a) S. B. Smith, L. Finzi and C. Bustamante, Science, 1992, 258, 1122–1126 CrossRef CAS;
(b) J. K. Strauss and L. J. Maher, Science, 1994, 266, 1829–1834 CrossRef CAS.
- E. Smela, O. Inganas and I. Lundström, Science, 1995, 268, 1735–1738 CrossRef CAS.
- S. Fernandez-Alberti, V. D. Kleiman, S. Tretiak and A. E. Roitberg, J. Phys. Chem. A, 2009, 113, 7535–7542 CrossRef CAS.
Footnote |
| † Electronic supplementary information (ESI) available: A description of the general methods used for compound characterisation, detailed experimental parts and NMR spectral traces for all compounds and intermediates, effect of pressure on spectral band shapes, extended dipole calculation, and PEET values versus temperature. See DOI: 10.1039/c2sc21505e |
|
| This journal is © The Royal Society of Chemistry 2013 |
Click here to see how this site uses Cookies. View our privacy policy here. 

![[thin space (1/6-em)]](https://www.rsc.org/images/entities/char_2009.gif) 000 M−1 cm−1), with a set of vibronic bands stretching to higher energies.41 The corresponding absorption transition for DPP is easily recognised42 as a series of weaker bands starting at around 497 nm (εMAX ≈ 30
000 M−1 cm−1), with a set of vibronic bands stretching to higher energies.41 The corresponding absorption transition for DPP is easily recognised42 as a series of weaker bands starting at around 497 nm (εMAX ≈ 30![[thin space (1/6-em)]](https://www.rsc.org/images/entities/char_2009.gif) 500 M−1 cm−1). The carborane-based bridge, CAR, absorbs only in the near-UV region, with bands centred in the 300–350 nm region. Band maxima, half-widths and molar absorption coefficients (εMAX) recorded for both B and DPP are insensitive to the molecular length but there is a progressive increase in εMAX for CAR with increasing number of repeat units. Fluorescence spectra (Fig. 2) recorded in MTHF show emission bands characteristic of B41 (λFLU = 662 nm) and DPP42 (λFLU = 570 nm). The blue dye can be excited selectively at 620 nm while the optimal excitation wavelength for DPP is 490 nm, where B absorbs ca. 5% of incident photons. No fluorescence is observed from CAR following excitation at 300 nm. Throughout this work, comparison is made to control compounds for both DPP and B (see ESI† for structures).43
500 M−1 cm−1). The carborane-based bridge, CAR, absorbs only in the near-UV region, with bands centred in the 300–350 nm region. Band maxima, half-widths and molar absorption coefficients (εMAX) recorded for both B and DPP are insensitive to the molecular length but there is a progressive increase in εMAX for CAR with increasing number of repeat units. Fluorescence spectra (Fig. 2) recorded in MTHF show emission bands characteristic of B41 (λFLU = 662 nm) and DPP42 (λFLU = 570 nm). The blue dye can be excited selectively at 620 nm while the optimal excitation wavelength for DPP is 490 nm, where B absorbs ca. 5% of incident photons. No fluorescence is observed from CAR following excitation at 300 nm. Throughout this work, comparison is made to control compounds for both DPP and B (see ESI† for structures).43


