Zhuohua
Sun
,
Zeming
Rong
*,
Yong
Wang
,
Yan
Xia
,
Wenqiang
Du
and
Yue
Wang
State Key Laboratory of Fine Chemicals, School of Chemical Engineering, Dalian University of Technology, Dalian 116024, P. R. China. E-mail: zeming@dlut.edu.cn; Tel: +86 411 84986242
First published on 26th November 2013
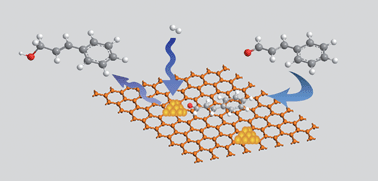
The selective hydrogenation of cinnamaldehyde was investigated with Pt nanoparticles deposited on reduced graphene oxide (Pt/RGO). Compared with carbon nanotubes (CNTs) or activated carbon (AC) as support, Pt/RGO showed the best activity and selectivity for the hydrogenation of CO bond.
The graphene based catalysts have been explored with RGO method, a suitable way for preparing graphene in large scale at a relatively low cost. Nie et al.9 employed ethylene glycol (EG) reduction method to produce Pt/RGO catalyst which showed excellent reactivity in the hydrogenation of nitroarenes. Sheng et al.10 prepared highly-dispersed ultrafine Pt nanoparticles supported on graphene sheets. Using this novel catalyst, various unsaturated compounds were reduced with excellent yields under mild conditions. However, all these work simply focused on promoting activity rather than selectivity.
Selective hydrogenation of α,β-unsaturated aldehydes to the corresponding unsaturated alcohols is important for both fundamental science and applications.11 Accordingly, the development of catalysts for this class of reactions is still challenging, since the CC bond is normally thermodynamically more reactive than the CO one. The key factor controlling the activity and selectivity remains unclear, although it is well known as a general rule that transition metals12 and support morphology13 might affect the process.
Serp et al. used carbon nanotubes (CNTs) and activated carbon (AC) for the selective hydrogenation of cinnamaldehyde to study the support effects.14 CNTs support with mesoporous structure made mass transfer limitations less significant and gave better activities than AC.
In this study, graphene was employed as support for the selective hydrogenation of cinnamaldehyde due to its unique configuration of a 2-dimension (2-D) plane. Compared with Pt based CNTs and AC, Pt/RGO showed the best activity and selectivity for the hydrogenation of CO bonds, which provided a facile, economical, and environmentally benign alternative for the synthesis of unsaturated alcohols.
The colloid of graphene oxide was prepared by improved Hummers' method15 and subsequently treated with sonication and centrifugation. Then GO sample and H2PtCl6 were mixed in a solution containing deionized water and ethylene glycol (EG) with continuous stirring at room temperature for 2 h. The above mixture was treated in an ultrasonic bath (140 W) for 2 h to ensure that most GO were fully exfoliated, and then it was heated to 393 K in a stainless steel autoclave with Teflon inner layer for 24 h (see ESI†). Pt nanoparticles deposited on multi-walled carbon nanotubes and activated carbon were prepared by the same procedures and were denoted as Pt/CNTs and Pt/AC, respectively. EG was selected as a reductant since it could well control the mean particle size of the metal. In addition, as an intercalating agent like pyridine,16 it is favorable to inhibit the re-stacking of GO during the reaction process.
Raman spectroscopy was employed to characterize carbonaceous materials for distinguishing ordered and disordered crystal structures.17 Raman spectra of natural graphite, GO and Pt/RGO were shown in Fig. 1a. G band is assigned to the E2g phonons of sp2 C atoms. D band is assigned to a breathing mode of κ-point photons of A1g symmetry which corresponds to the defects in the curved graphene sheet with staging disorder.18 As a result, the natural graphite powder provided a strong G band at ∼1587 cm−1, but a weak D band at ∼1351 cm−1. After being oxidated, exfoliated and then reduced, the ordered crystal structure of graphite was broken. Therefore the lattice defect obviously increased and the D band became strong for GO and Pt/RGO. Table 1 summarized the Raman band positions and the crystalline size of GO and Pt/RGO. The intensity ratio of D band to G band (ID/IG) was even higher for Pt/RGO than GO since the re-established graphene network processed smaller average size.19 The ratio of the integral intensities of the G and D bands is related to the in-plane crystallite size, which were calculated with the equation: La = (2.4 × 10⁻¹⁰)λlaser4(ID/IG)−1.20 The crystalline domain sizes for GO and Pt/RGO were calculated to be 19.8 nm and 15.0 nm, respectively.
Fig. 1 (a) Raman spectra of GO, Pt/RGO and graphite (b) AFM image and section analysis of GO (c) XPS spectra of C1s region for Pt/RGO (d) XPS spectra of Pt4f region for Pt/RGO. |
Fig. 1b displayed an AFM image of the GO sample, which was prepared by depositing the corresponding dispersions on new cleaved mica surfaces and drying at room temperature. The lateral dimensions for the GO sheets ranged from 0.1 to 1 μm and the height was about 1.0 nm, which was typical for one-atom-thick graphene oxide.21 The height was some thicker than the theoretical value,22 which could be ascribed to individual graphitic sheets bearing oxygen-containing groups on both faces.23
Furthermore, Pt/RGO was analysed by XPS and the results were presented in Fig. 1c and d (XPS results for Pt/CNTs and Pt/AC were presented in Fig. S1†). The asymmetric C1s spectrum was deconvoluted into four peaks at 284.6, 286.6, 287.7 and 289.0 eV, which were assigned to the C element in C–C, C–O, CO and O–CO group respectively.24 Based on the integration of corresponding peaks, the percentage of sp2 hybridized C–C bonds was 77.0% (Table 2), which proved a good reduction of GO.25Fig. 1d showed Pt4f spectra for Pt/RGO. The most intense doublet with binding energies of 71.3 eV (Pt4f7/2) and 74.5 eV (Pt4f5/2) were attributed to the metallic Pt. In contrast, the peaks at 72.2 eV (Pt4f7/2) and 75.6 eV (Pt4f5/2) could be assigned to Ptδ+ that anchored with the C–O group in RGO.9 From the integration of different peaks it could be concluded that 54.1% of Pt existed as metallic state and others existed as oxidized state after reduction. Among three supports, the reduction degree for RGO was higher than CNTs and AC.
Sample | Relative atomic percentage (%) | |||||
---|---|---|---|---|---|---|
CC | C–O | CO | O–CO | Pt | Ptδ+ | |
GO | 38.5 | 13.5 | 11.0 | 37.0 | — | — |
Pt/RGO | 77.0 | 10.1 | 3.9 | 9.0 | 54.1 | 45.9 |
Pt/CNTs | 62.9 | 13.8 | 7.4 | 15.9 | 50.4 | 49.6 |
Pt/AC | 57.7 | 17.7 | 7.3 | 17.3 | 55.2 | 44.8 |
Fig. 2 illustrated the XRD patterns of graphite, GO and Pt-based catalysts. For graphite sample, the sharp and strong diffraction peak at 27° was assigned to (002) facet of graphite and it disappeared after oxidation. A strong diffraction peak appeared at 10.5° which was the reflection of the few-layer graphene structure.21 However, the peak at 10.5° disappeared once again after reduction and was replaced by a weak and broad peak between 17° and 30° which was assigned to the characteristic structure of RGO. This change could be attributed to the formation of “re-graphitized” carbon regions and restacking due to the van der Waals attractive interactions. The sharp diffraction peaks at 39.7° and 46.4° in Pt-based catalysts typically belong to the (111) and (200) facets of Pt. Using Scherrer's equation, the average crystalline sizes of Pt on RGO, CNTs and AC supports were estimated to be about 3.4, 4.0 and 3.6 nm, respectively. It clearly indicated that PtCl62− was reduced by EG with the uniform size in different supports.
Fig. 3 showed the TEM images of three catalysts. Pt nanoparticles uniformly decorated on different supports with almost same average size (2.3 nm for Pt/C, 2.5 nm for Pt/CNTs and 2.4 nm for Pt/RGO), which was slightly smaller than calculated samples with XRD. Moreover, the images for different supports were easily distinguished by the surface morphology. The active carbon possessed numerous pores and Pt nanoparticles closely packed on it with somewhat aggregation. For carbon nanotubes support, many tubes intertwined together and Pt nanoparticles only deposited on its outer surface due to the unopened terminals. The graphene sheets provided typical planar structure and the position with deep color demonstrated a folded region at edges. In addition, Pt nanoparticles deposited on graphene with fine dispersion, indicating a strong metal-support interactions.26
Some properties of the catalysts might dominate the selective hydrogenation of cinnamaldehyde, such as the sorts of transition metal,12 particle size,27 types of support28 and the preparation method29et al. In this study, Pt-based catalysts were controlled between 2.3 nm and 2.5 nm using the same preparation method. The performance of three catalyst supports was investigated by the selective hydrogenation of cinnamaldehyde and the results were summarized in Table 3. Clearly, Pt/RGO showed best activity under the same reaction conditions and it was 1.5 and 1.4 times higher than that of Pt/AC and Pt/CNTs catalysts. Activated carbon (AC) has the largest surface area (1028.7 m2 g−1) but with the lowest activity. The numerous microspores of AC might hinder the diffusion of the liquid medium,14 so the hydrogenation reaction proceeded more slowly. CNTs with mesoporous structure made mass transfer limitations less significant and gave almost same activity like AC but with the least surface area (157.6 m2 g−1). RGO possesses unique 2D morphology and both surfaces of the sheet are accessible for reactants, which obviously decreases the diffusional limitations. So Pt/RGO showed best catalytic performance for the hydrogenation of cinnamaldehyde.
Catalyst | S BET (m2 g−1) | Conversion (%) | Selectivity (%) | Activity (mol-CALD/(mol-Pt h))c | |||
---|---|---|---|---|---|---|---|
CALC | HALD | HALC | Others | ||||
a Reaction conditions: cat. 0.02 g, CALD 0.5 g, isopropanol 10 ml, 313 K, 2 MPa, 2.5 h. b CAL: cinnamaldehyde, CALC: cinnamyl alcohol, HALD: hydrocinnamaldehyde, HALC: hydrocinnamyl alcohol. c Pt content were 2.9 wt%, 4.0 wt% and 4.0 wt% for Pt/RGO, Pt/CNTs and Pt/C respectively. | |||||||
Pt/C | 1028.7 | 84.2 | 30.9 | 27.0 | 35.2 | 6.8 | 310.9 |
Pt/CNTs | 157.6 | 87.2 | 48.3 | 20.8 | 26.2 | 4.7 | 322.0 |
Pt/RGO | 276.1 | 89.6 | 69.6 | 9.2 | 17.6 | 3.6 | 456.4 |
Additionally, the selectivity with Pt/RGO to CALC was higher than that of other two catalysts, which was presumably caused by the support effects. Firstly, graphene had the least oxygen-containing surface groups (Table 2) and outstanding electronic conductivity,6 so the electron was easily transferred from the support to the metal centre,30 which favored the back-bonding interactions with π*CO to a larger extent than π*CC and increased CALC selectivity.31,32 On the other hand, the aromatic rings prefer to orient in parallel with the plane of graphene (Fig. 4) due to π–π interactions.33 The curvature effect forces the aromatic rings far away from the surface of CNTs. Comparing two adsorption modes in Fig. 4, the CO bonds could be selectively hydrogenated over Pt atom sites supported on RGO than CNTs. For AC support, it is difficult to control the selectivity due to the irregular surface and porous properties.
Fig. 4 Proposed model for describing the adsorption mechanism of cinnamaldehyde molecule with CNTs and RGO support. |
In order to clarify the hydrogenation process of cinnamaldehyde over Pt/RGO catalyst, the component concentration versus reaction time were monitored by GC and the results were shown in Fig. 5. It could be seen that the conversion increased almost linearly at the beginning and the selectivity to CALC reached 69.6% at the conversion of 89.6%. Therefore, the catalyst is practically selective for the hydrogenation of CO bonds. The CALC would be sequentially converted into HALC by the further hydrogenation of CC bonds after CAL was completely consumed.
In summary, Pt/RGO catalyst was synthesized by the co-reduction of platinum metals solution and GO with EG. This catalyst was employed for the selective hydrogenation of cinnamaldehyde. Characterizations showed that Pt nanoparticles deposited well on graphene surface and most of the oxygen groups were removed from graphene surface. Compared with catalyst using CNTs or AC as supports, Pt/RGO exhibited better activity and selectivity for the hydrogenation of CO bonds. The unique catalytic performance was not only attributed to its less oxygen-containing surface groups for RGO but also special 2D morphology for the high accessibility of reactants.
Footnote |
† Electronic supplementary information (ESI) available. See DOI: 10.1039/c3ra44962a |
This journal is © The Royal Society of Chemistry 2014 |