 Open Access Article
 This Open Access Article is licensed under a
 Creative Commons Attribution 3.0 Unported Licence
Multicore magnetic FePt nanoparticles: controlled formation and properties†
Luke A. W.
Green
ab,
Trinh T.
Thuy
c,
Derrick M.
Mott
c,
Shinya
Maenosono
c and
Nguyễn Thi
Kim Thanh
*ab
aUCL Healthcare Biomagnetic and Nanomaterials Laboratories, 21 Albemarle Street, London, W1S 4BS
bDepartment of Physics and Astronomy, University College London, London, WC1E 6BT, UK. E-mail: ntk.thanh@ucl.ac.uk; Tel: +44 (0)207 491 6509
cJapan Advanced Institute of Science and Technology, 1-1 Asahidai, Nomi, Ishikawa 923-1292, Japan
First published on 14th November 2013
Abstract
Research on magnetic nanoparticles (NPs) has become one of the most active and exciting fields in materials science. The challenge is to produce magnetic NPs with high magnetic saturation without exceeding the super-paramagnetic limit so that they may be used as non-permanent magnets in biomedicine and catalysis. FePt offers enhanced saturation magnetisation properties compared to iron oxide, however synthetic methods require fine-tuning to achieve these superior properties. Multicore FePt NPs up to 44 nm in diameter and composed of Pt rich FePt nanocrystals within an iron rich FePt matrix not previously seen in the literature are presented here. The results indicate that coordination of Fe and Pt intermediates with oleic acid and oleylamine respectively hinders deposition of each respective metal in the growth of discrete and multicore NPs.
Magnetic nanoparticles (MNPs) show large potential not only in data storage but also in biomedicine, environmental science and catalysis.1–5 Magnetite is a popular choice of magnetic material in biomedicine and has been approved by the food and drugs administration, however it is limited by its saturation magnetisation. Synthesis of FePt NPs via thermal decomposition of iron pentacarbonyl was first published in 2000.6 FePt NPs have the potential to be next generation MNPs for biomedical application such as in separation, immunoassays, gene transfection, cell targeting, drug delivery, hyperthermia and magnetic particle imaging.7
FePt NPs have high Curie temperature, high saturation magnetization (MS, bulk face centred tetragonal phase FePt = 1140 emu.cm−3), and high chemical stability.5–10 Theoretical calculations show that disordered face centred cubic (fcc) FePt NPs are also superior to magnetite in magnetic hyperthermia.9 Fcc FePt NPs of 9 nm, have been shown to exhibit a higher T2 shortening effect than conventional superparamagnetic iron oxide NPs, indicating that they could make good negative contrast agents for magnetic resonance imaging.11 Phase transfer of FePt from organic solvent to water has been successful with cysteamine and tetramethylammonium hydroxide and indicates that use of FePt in biological systems has become a reality. With an improvement in the magnetic properties, FePt NPs are expected to become an alternative to iron oxide in vivo.12,13 Platinum is also an expensive metal which further highlights the need to increase the iron content of FePt MNPs to improve their magnetic properties and reduce the overall cost of production.
Synthetic routes to FePt nanoparticles, and their applications, are comprehensively reviewed elsewhere.14 The challenge is to synthesise superparamagnetic fcc FePt NPs with large MS. Attempts to synthesise large (d ≥ 20 nm) FePt NPs using Fe(CO)5 succeeded, however MS was limited and attributed to the low Fe content.15 Tuneable FePt nanorods were also formed by adjusting the amount of oleylamine (OLA) in the thermal decomposition of Fe(CO)x after formation of OLA–Fe(CO)x complexes, where x is the number of CO ligands.16 Iron(III) ethoxide can be substituted for iron pentacarbonyl in a pyrolysis reaction to give compositionally controlled NPs.17,18 A reaction mechanism describing the formation of NPs via pyrolysis of iron ethoxide with Pt(II) acetylacetonate was previously described by Maenosono et al. In the presence of high amounts of Fe precursor, or low oleic acid (OA) to OLA amount ratio, there was evidence of some aggregation to give multicore FePt magnetic nanoparticles (mcNPs).17 We report the synthesis of large (d ≥ 40 nm) FePt mcNPs and a systematic study of discrete and multicore NP morphology, composition and magnetic properties by tuning the overall amounts and molar ratios of OA to OLA. The term ‘mcNP’ is used to refer to multicore, polycrystalline aggregates of NPs.
Results and discussion
In the thermal decomposition reaction of iron pentacarbonyl to produce FePt NPs, the surfactant amount appears to be proportional to the NP volume.15,19 Similarly, in the pyrolysis of iron ethoxide with platinum acetylacetonate, aggregation of monocrystalline NPs was shown to occur when large amounts of total surfactant (tSf), relative to the amount of precursor were used.17 Oleic acid was suggested to replace ethoxide as a coordinative ligand for Fe, and oleylamine is said to coordinate platinum intermediates, here we present results that take advantage of these observations.17,18 Details of discrete and multicore NP preparation are presented in the ESI (Table S1, samples 1–32†). Transmission electron microscopy (TEM) shows discrete NPs ranging 5.8 ± 0.9 nm to 7.6 ± 1.2 nm and mcNPs increasing in size from 13.6 ± 1.8 nm to 22.4 ± 3.6 nm (ESI, Fig. S1†) as surfactant amount increases from 10 to 20 mmol (samples 1–6). Dynamic light scattering (DLS) data mirror this trend of increasing size, and hydrodynamic diameters reveal a stabilizing shell of approximately 5 nm which is a factor of 2 greater than previously observed6,20 (ESI, Fig. S2†). The absence of a bimodal distribution of hydrodynamic diameters is attributed to the greater scattering effect of larger particulate species, which can lead to the ‘masking’ of a secondary, smaller distribution. Energy dispersive spectroscopic elemental analyses (EDS) show an Fe content of 49% when tSf is at a minimum and is in agreement with the literature, however when tSf is increased from 10 to 20 mmol Fe content rises to 58%.17 X-ray diffraction (XRD) patterns exhibit crystal phases (ESI, Fig. S3†) consistent with face centred cubic (fcc) Pt (ref. 001-1194), and use of the Scherrer equation reveals crystal sizes of 4 to 5 nm which closely match the TEM determined diameters of crystals within mcNPs (ESI, Table S2†).Biomedical applications require size monodispersity for greater predictability of how NPs behave inside living organisms. TEM shows a progression from a unimodal distribution of mcNPs with diameter 16.9 ± 3.6 nm through a bimodal distribution and back to a monomodal distribution 6.2 ± 1.2 nm in diameter (ESI Fig. S4 and S5A†) when OA was changed from 5 to 15 mmol (samples 7–10) and tSf was kept constant (20 mmol). DLS data indicate an initial increase of hydrodynamic diameter from 25 to 40 nm when the amount of OA is increased from 5 to 10 mmol, the hydrodynamic diameter decreases to 13 nm when the OA amount was increased to 15 mmol (ESI Fig. S5B†). The shell thickness was calculated by comparing TEM and DLS data and shown to increase in increments of approximately 3 nm to a maximum of 9 nm with OA = 10 mmol (ESI Fig. S5B†). The proportional relationship between discrete or multicore NP size and hydrodynamic diameter is a clear indication that larger particles require larger stabilizing agents or layering of surfactants in order to disperse them in a liquid. EDS and inductively coupled plasma elemental analyses (ICP) both show an increase of Fe content from 57–67% and 30–46% respectively when OA is increased from 5 to 15 mmol. ICP is performed on mixtures of discrete and multicore NPs while EDS is performed on individual mcNPs. The difference in Fe content indicates that mcNPs contain more Fe than discrete NPs. XRD (ESI Fig. S6†) patterns exhibit fcc crystal phase with increasing angle 2 theta and match closer to the reference pattern corresponding to Fe0.8Pt3.2 as the OA amount increases. XRD patterns match references with lower Fe content than indicated by EDS or ICP, but only detects crystalline materials suggesting that the Fe could be present in an amorphous form. Magnetometry shows that all samples are super-paramagnetic at room temperature and exhibit remanence and coercivity at 5 K (ESI Fig. S7†). Magnetic saturation (MS) at 300 K increases from 0.9 to 11.3 emu.g−1 as the size of mcNPs increases from 6.2 ± 1.2 to 13.9 ± 3.6 nm, and is proportional to the amount of OA. At zero Oe there is a kink in all hysteresis curves which is caused by the presence of materials with different grain sizes or coercivities, this is known as wasp waisting.21 Wasp waisting occurs when magnetic materials with highly contrasting coercivity are present; the effect is strongest when the low coercivity component comprises a large fraction of the magnetic domains.21 Zero field cooled and field cooled (ZFC/FC) measurements show a decrease in blocking temperature (TB) with increasing amount of OA and are inversely proportional to the size of mcNPs. The superparamagnetic size limit of magnetic NPs varies with composition, pure Fe NPs have a limit of approximately 17 nm, and the ordered fct phase of FePt has a limit of approximately 3 nm.2 The large size indicated by TEM and lack of ferromagnetism at room temperature indicate that our mcNPs are composed of smaller, superparamagnetic units.
It is suggested that a lower amount of OA would result in fewer coordinated Fe metal intermediates in solution and hence mcNPs with higher Fe content; ICP, EDS, and magnetometry measurements all agree with this. Conversely, with increased ratio of OA to OLA, more Fe intermediates are coordinated by OA than Pt intermediates are coordinated by OLA. Diffraction patterns match closer to pure Pt with decreasing OLA.17 This explanation is summarized in a scheme found in the supplementary information (ESI Fig. S28†), the round bottomed flask in the middle represents the OLA dependent nucleation of Pt and the four outer beakers represent the products, with varying morphology and composition, which is dependent on the amount of OA used.1 Pt rich FePt is denoted by the color black due to the higher contrast of Pt on TEM, we used a grey shade to represent Fe rich FePt.
It is seen that the amount of OA is important in the aggregation of discrete NPs to give multicore NPs. Doubling of the iron precursor (Na2Fe(CO)4) amount halves the availability of OA per Fe complex, but little is known about the effect of tSf when OA is kept low (OA![[thin space (1/6-em)]](https://www.rsc.org/images/entities/char_2009.gif) :OLA = 1:6). TEM (ESI Fig. S8†) shows that in dioctyl ether, aggregation of discrete NPs to give multicore NPs occurs with low tSf (10.5–17.5 mmol (samples 11–14)), at tSf equal to 24.5 mmol, a bimodal distribution of mcNPs with sizes 53.4 ± 7.9 to 115.6 ± 15.7 nm is seen and the size decreases to 44.3 ± 7.3 nm when tSf is increased to 31.5 mmol. ICP shows little variation in Fe content ranging 63–66% while X-ray photoelectron spectroscopy (XPS) shows an increase of Fe content as tSf is increased from 10.5 to 31.5 mmol (ESI Table S3†). The lower Fe content recorded by XPS when tSf is at a maximum suggests that there is less Fe near the surface of our mcNPs, whereas, the aggregates have comparable Fe content to ICP when the least tSf is employed. XRD indicates the fcc crystal phase in all samples with crystal size approximately 4 nm, whilst a cubic FePt3 phase (ref. 01-089-2050) appears with decreasing intensity and crystal size 65–76 nm with increasing tSf (ESI Fig. S9 and Table S2†). MS increases from 20 to 31 emu.g−1 with increasing tSf, all mcNPs are ferromagnetic at room temperature (ESI Fig. S10†), and the broad nature of ZFC/FC curves makes exact determination of TB difficult. Broad ZFC/FC curves indicate highly polydisperse samples, which can be seen in the TEM (ESI Fig. S8†). Despite an increase in MS mcNPs appear to decrease in size but contain less FePt3 which exhibits less magnetic moment per unit volume than FePt. MS of sample 11 is corrected to 24 emu.g−1 when organic matter (18–21%) is accounted for (Table S4†). The different areas covered by Fe and Pt can also be seen in the HAADF image (Fig. 1A). Elemental mapping of STEM-HAADF images shows Fe distributed homogeneously across the image while Pt is less wide spread and covers more discrete areas, but does not extend to the same perimeter as Fe (Fig. 1D). The discrepancy between mcNP perimeter and Fe distribution can be explained by the observation of a clear lighter region around the edge of the mcNP in a representative HRTEM (Fig. 1E). Lattice spacings indicate Pt rich FePt crystalline regions appear to be fused together with an iron rich FePt alloy and a thin coating of iron oxide at the outer edges of mcNPs.
:OLA = 1:6). TEM (ESI Fig. S8†) shows that in dioctyl ether, aggregation of discrete NPs to give multicore NPs occurs with low tSf (10.5–17.5 mmol (samples 11–14)), at tSf equal to 24.5 mmol, a bimodal distribution of mcNPs with sizes 53.4 ± 7.9 to 115.6 ± 15.7 nm is seen and the size decreases to 44.3 ± 7.3 nm when tSf is increased to 31.5 mmol. ICP shows little variation in Fe content ranging 63–66% while X-ray photoelectron spectroscopy (XPS) shows an increase of Fe content as tSf is increased from 10.5 to 31.5 mmol (ESI Table S3†). The lower Fe content recorded by XPS when tSf is at a maximum suggests that there is less Fe near the surface of our mcNPs, whereas, the aggregates have comparable Fe content to ICP when the least tSf is employed. XRD indicates the fcc crystal phase in all samples with crystal size approximately 4 nm, whilst a cubic FePt3 phase (ref. 01-089-2050) appears with decreasing intensity and crystal size 65–76 nm with increasing tSf (ESI Fig. S9 and Table S2†). MS increases from 20 to 31 emu.g−1 with increasing tSf, all mcNPs are ferromagnetic at room temperature (ESI Fig. S10†), and the broad nature of ZFC/FC curves makes exact determination of TB difficult. Broad ZFC/FC curves indicate highly polydisperse samples, which can be seen in the TEM (ESI Fig. S8†). Despite an increase in MS mcNPs appear to decrease in size but contain less FePt3 which exhibits less magnetic moment per unit volume than FePt. MS of sample 11 is corrected to 24 emu.g−1 when organic matter (18–21%) is accounted for (Table S4†). The different areas covered by Fe and Pt can also be seen in the HAADF image (Fig. 1A). Elemental mapping of STEM-HAADF images shows Fe distributed homogeneously across the image while Pt is less wide spread and covers more discrete areas, but does not extend to the same perimeter as Fe (Fig. 1D). The discrepancy between mcNP perimeter and Fe distribution can be explained by the observation of a clear lighter region around the edge of the mcNP in a representative HRTEM (Fig. 1E). Lattice spacings indicate Pt rich FePt crystalline regions appear to be fused together with an iron rich FePt alloy and a thin coating of iron oxide at the outer edges of mcNPs.
 | ||
| Fig. 1 STEM-HAADF images and elemental mapping of sample 14, mcNPs prepared in dioctyl ether with 4.5 mmol (17%) OA and tSf equal to 31.5 mmol; A, STEM-HAADF, B, Fe distribution; C, Pt distribution; D, overlay of Fe and Pt layers; E, HRTEM. | ||
For comparison, the same series of syntheses were performed in dibenzyl ether (samples 20–23). TEM showed greater decrease in size of mcNPs from 45.3 ± 6.6 nm to 23.0 ± 2.0 nm and improved monodispersity than when synthesised in dioctyl ether (Fig. 2). No cubic FePt3 phase is observed, the fcc phase matches closest to a high Fe content crystal phase (Fe0.44Pt0.55, ESI Fig. S12†) and MS increases from 19 to 25 emu.g−1 with increasing tSf (ESI Fig. S13†). ZFC/FC loops show no trend and indicate highly polydisperse samples. MS of sample 23 is corrected to 26 emu.g−1 when organic matter is accounted for (Table S4†). XRD and ICP/magnetic data appear to be contradictory, XRD peaks decrease in degrees 2θ which suggests lower Fe content of NPs while ICP elemental analysis and magnetic studies suggest increased Fe content with increasing tSf (ESI Table S3†). With larger Pt rich FePt crystalline regions, the ‘packing’ of these regions within the mcNPs is poorer and allows more Fe rich FePt alloy to pack into the spaces between these areas. For analogy, different sized balls fitting into a glass are considered. Fewer large Pt rich FePt balls than small balls would fit into the glass and would occupy less volume, allowing more empty space to be filled with Fe rich FePt.
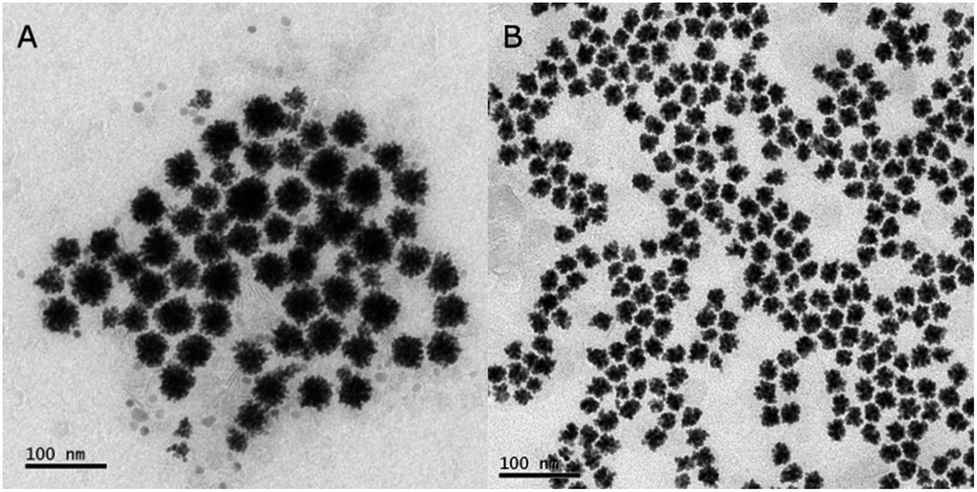 | ||
| Fig. 2 Caption TEM images of samples 20 and 23, synthesised in dibenzyl ether with a 1:6 amount ratio of OA to OLA, and increasing tSf; A, 10.5 mmol and B, 31.5 mmol. | ||
The opposite ratio of OA to OLA (6:1) yielded discrete NPs ranging 5.9 ± 1.2 to 8.8 ± 0.8 nm in dioctyl and dibenzyl ether (ESI Fig. S15 and S16†). XRD patterns match closely to the pure platinum reference (ESI Fig. S17 and S18†) and crystal sizes are all approximately 4 nm in diameter (ESI Table S2†). MS is limited to 4 emu.g−1 and TB to 80 K however it is noted that dibenzyl ether yielded higher magnetic properties than dioctyl ether (ESI Fig. 19 and 20†). ICP and XPS techniques offer comparable Fe content varying between 22 and 26% Fe (ESI Table S3†).
Varying tSf with a constant low ratio of OA to OLA (1:6) does not allow careful control over the mcNP size. TEM show mcNPs decrease in size from 41.0 ± 8.2 to 8.2 ± 1.3 nm when tSf is kept constant (17.5 mmol) and the ratio of OA to OLA was changed from 1:6 to 6:1 in dioctyl ether (samples 12, 15–19, ESI Fig. S21†). XRD shows peaks with lower angle 2 theta with increasing OA, the absence of any peaks for iron oxide indicate a change in the alloy composition of the crystalline regions of FePt discrete and multicore NPs (Fig. 3). Diameters of crystalline regions, as determined by the Scherrer equation increase from 3 to 5.5 nm with increasing amount of OA (ESI Table S2†). ICP determined Fe content is proportional to the XRD peak positions; decreasing the OA amount leads to crystalline regions with greater Fe content. MS decreases from 23 to 1.9 emu.g−1 with increasing OA amount and with low amount of OA there is evidence of ferromagnetism (Fig. 4). MS of sample 12 is corrected to 29 emu.g−1 when organic matter is accounted for (Table S4†). A broad ZFC/FC curve is an indication of high polydispersity. TB decreases and the curves narrow in shape with increasing OA which is in agreement with the decreasing standard deviation of discrete and multicore NPs viewed under TEM (ESI Fig. S21†). It has been suggested that the availability (or lack of) of Fe could play an important part in causing the NPs to aggregate into mcNPs. We suggest Fe behaves like an adhesive, holding Pt rich cores together. Elemental mapping of the STEM-HAADF image shows polycrystalline mcNPs (Fig. 1A–E) with regions of high Pt concentration in the middle of the mcNPs while Fe predominates across the mcNPs and beyond the perimeters of the Pt edge. It is commonly known that Fe is coordinated by OA, and Pt by OLA.22 Infrared spectroscopy shows evidence for C–O− stretches which indicates our NPs are stabilized by OA (ESI Fig. S22†). These observations are all also true for dibenzyl ether (ESI Fig. S23–S26†) with the notable exception that with minimal OA, aggregation of mcNPs does not occur and the standard deviation from the mean is lower than observed for dioctyl ether.
 | ||
| Fig. 3 XRD patterns of products synthesised in dioctyl ether with an increasing amount of OA, and constant tSf of 17.5 mmol; sample 12, 2.5 mmol (14%); sample 15, 5 mmol (29%); sample 16, 7.5 mmol (43%); sample 17, 10 mmol (57%); sample 18, 12.5 mmol (71%); sample 19, 15 mmol (86%); A, full diffraction pattern; B range 45 to 50° 2θ. | ||
 | ||
| Fig. 4 Hysteresis loops at 300 K and B, ZFC/FC (100 Oe) curves of samples prepared in dioctyl ether with constant tSf equal to 17.5 mmol and increasing amount of OA; sample 12, 2.5 mmol (14%); sample 15, 5 mmol (29%); sample 17, 10 mmol (57%); sample 19, 15 mmol (86%). | ||
The emission spectrum of the Fe 2p3/2 peak in XPS (ESI, Fig. S27†) has energy of ∼710–711 eV which matches the energy of Fe2O3, the lack of evidence for iron oxide in XRD suggests that this layer of iron oxide is thin and is further supported by the observation of thin layers of iron oxide under HRTEM (Fig. 1E).23 However it has also been suggested that small discrete NPs can exhibit shifted Fe 2p spectra, the same effect may be observed here and would support the lack of evidence for iron oxide in the XRD patterns.24 The more intense Pt 4f peak always appears in the region 71.3–71.4 eV which corresponds to Pt (0) (71.2 eV).23 Pt 4f emission spectra exhibit tailing to the higher binding energy region, which is typically attributed to the Doniach–Sunjic line broadening effect; however, non-uniform composition distribution of Pt could also contribute to an asymmetric Pt 4f peak.25,26 The Doniach–Sunjic line broadening effect is observed in spectra following excitement of high energy electrons (usually with X-rays) and is caused by the interaction of conduction electrons near the Fermi level with the resulting hole.27
Conclusions
Multicore NPs with high magnetic saturation composed of FePt were synthesised in a controlled manner. Low OA amounts are shown to give large polycrystalline mcNPs of FePt not previously observed in the literature. The uneven distribution of Fe and Pt within the mcNPs resulted in lower MS values than expected. However the atomic structure of FePt is much closer packed and denser (Fe0.44Pt0.51, d = 15.5 g.cm−3) than materials such as iron oxide (magnetite, d = 5.22 g.cm−3) so the magnetic saturation is higher per unit volume. We obtained a maximum magnetic saturation of 31 emu.g−1/480 emu.cm−3 (assuming density of 15.5 g.cm−3). Magnetic properties of mcNPs are size dependent, in dioctyl ether and dibenzyl ether and with decreasing OA, MS and TB increase with size. Crystallographic studies indicated that the diffraction pattern angle 2θ changes depending on the overall Fe and Pt content. For confirmation of the hypothesis that Fe and Pt metal intermediates are coordinated in solution, a detailed in situ analysis of intermediate species is underway. A comparison of solvent shows improved monodispersity of mcNPs with dibenzyl ether. A discussion of interactions between OA with Fe intermediates, and OLA with Pt intermediates is presented. Multicore iron oxide NPs have shown improved properties for magnetic particle imaging.28 The multicore nature of our FePt mcNPs paves the way for nano-engineering and is not limited to magnetic materials; noble metals, semiconducting quantum dots, and their hybrids, can all take advantage of these insights to vastly expand their repertoire of applications. Iron oxide was shown to offer varying peroxidase activity with differing coatings in the oxidation of glucose, and the different facets of iron oxide offers oxidative behaviour in the catalysis of CO to CO2.29,30 Conversely, hydrogenation of alkene and alkyne functional groups was successful using iron–iron oxide NPs.31 FePt mcNPs exhibit thin iron oxide coatings which are expected to offer similar levels of catalytic activity.Acknowledgements
Nguyễn TK Thanh would like to thank the Royal Society for her University Research Fellowship. Luke Green would like to thank UCL for his PhD Stipend. The authors would like to thank Quentin Pankhurst, Paul Southern, Daniel Ortega and Cristina Blanco-Andujar for helpful discussions.Notes and references
- Q. A. Pankhurst, J. Connolly, S. K. Jones and J. Dobson, Applications of magnetic nanoparticles in biomedicine, J. Phys. D: Appl. Phys., 2003, 36, R167–R181 CrossRef CAS.
- K. M. Krishnan, Biomedical nanomagnetics: a spin through possibilities in imaging, diagnostics, and therapy, IEEE Trans. Magn., 2010, 46, 2523–2558 CrossRef CAS PubMed.
- P. A. Xu, G. M. Zeng, D. L. Huang, C. L. Feng, S. Hu, M. H. Zhao, C. Lai, Z. Wei, C. Huang and G. X. Xie, et al. Use of iron oxide nanomaterials in wastewater treatment: a review, Sci. Total Environ., 2012, 424, 1–10 CrossRef CAS PubMed.
- Y. H. Zhu, L. P. Stubbs, F. Ho, R. Z. Liu, C. P. Ship, J. A. Maguire and N. S. Hosmane, Magnetic nanocomposites: a new perspective in catalysis, ChemCatChem, 2010, 2, 365–374 CrossRef CAS.
- Q. A. Pankhurst, N. K. T. Thanh, S. K. Jones and J. Dobson, Progress in applications of magnetic nanoparticles in biomedicine, J. Phys. D: Appl. Phys., 2009, 42 DOI:10.1088/0022-3727/42/22/224001.
- S. H. Sun, C. B. Murray, D. Weller, L. Folks and A. Moser, Monodisperse FePt nanoparticles and ferromagnetic FePt nanocrystal superlattices, Science, 2000, 287, 1989–1992 CrossRef CAS.
- N. T. K. Thanh, Magnetic nanoparticles: from fabrication to clinical applications: theory to therapy, chemistry to clinic, bench to bedside, CRC; London: Taylor & Francis, Boca Raton, 2012 Search PubMed.
- R. M. Taylor, D. L. Huber, T. C. Monson, A. M. S. Ali, M. Bisoffi and L. O. Sillerud, Multifunctional iron platinum stealth immunomicelles: targeted detection of human prostate cancer cells using both fluorescence and magnetic resonance imaging, J. Nanopart. Res., 2011, 13, 4717–4729 CrossRef CAS PubMed.
- S. Maenosono and S. Saita, Theoretical assessment of FePt nanoparticles as heating elements for magnetic hyperthermia, IEEE Trans. Magn., 2006, 42, 1638–1642 CrossRef CAS.
- M. S. Seehra, V. Singh, P. Dutta, S. Neeleshwar, Y. Y. Chen, C. L. Chen, S. W. Chou and C. C. Chen, Size-dependent magnetic parameters of fcc FePt nanoparticles: Applications to magnetic hyperthermia, J. Phys. D: Appl. Phys., 2010, 43 DOI:10.1088/0022-3727/43/14/145002.
- S. Maenosono, T. Suzuki and S. Saita, Superparamagnetic FePt nanoparticles as excellent MRI contrast agents, J. Magn. Magn. Mater., 2008, 320, L79–L83 CrossRef CAS PubMed.
- V. Salgueirino-Maceira, L. M. Liz-Marzan and M. Farle, Water-based ferrofluids from FexPt1−x nanoparticles synthesized in organic media, Langmuir, 2004, 20, 6946–6950 CrossRef CAS PubMed.
- S. W. Chou, Y. H. Shau, P. C. Wu, Y. S. Yang, D. B. Shieh and C. C. Chen, In vitro and in vivo studies of FePt nanoparticles for dual modal CT/MRI molecular imaging, J. Am. Chem. Soc., 2010, 132, 13270–13278 CrossRef CAS PubMed.
- S. H. Sun, Recent advances in chemical synthesis, self-assembly, and applications of FePt nanoparticles, Adv. Mater., 2006, 18, 393–403 CrossRef CAS.
- D. Ung, L. D. Tung, G. Caruntu, D. Delaportas, I. Alexandrou, I. A. Prior and N. T. K. Thanh, Variant shape growth of nanoparticles of metallic Fe–Pt, Fe–Pd and Fe–Pt–Pd alloys, CrystEngComm, 2009, 11, 1309–1316 RSC.
- B. Bian, W. Xia, J. Du, J. Zhang, J. P. Liu, Z. Guo and A. Yan, Growth mechanisms and size control of FePt nanoparticles synthesized using Fe(Co)x (x < 5)-oleylamine and platinum(II) acetylacetonate, Nanoscale, 2013, 5, 2454–2459 RSC.
- S. Saita and S. Maenosono, Formation mechanism of FePt nanoparticles synthesized via pyrolysis of iron(III) ethoxide and platinum(II) acetylacetonate, Chem. Mater., 2005, 17, 6624–6634 CrossRef CAS.
- S. Saita and S. Maenosono, FePt nanoparticles with a narrow composition distribution synthesized via pyrolysis of iron(III) ethoxide and platinum(II) acetylacetonate, Chem. Mater., 2005, 17, 3705–3710 CrossRef CAS.
- S. Momose, H. Kodama, T. Uzumaki and A. Tanaka, Fine tuning of the sizes of FePt nanoparticles, Jpn. J. Appl. Phys., Part 1, 2005, 44, 1147–1149 CrossRef CAS.
- D. J. Shaw, Introduction to colloid and surface chemistry, Butterworth-Heinemann, 1992 Search PubMed.
- A. P. Roberts, Y. L. Cui and K. L. Verosub, Wasp-waisted hysteresis loops – mineral magnetic characteristics and discrimination of components in mixed magnetic systems, J. Geophys. Res.: Solid Earth, 1995, 100, 17909–17924 CrossRef.
- N. Shukla, C. Liu, P. M. Jones and D. Weller, FTIR study of surfactant bonding to FePt nanoparticles, J. Magn. Magn. Mater., 2003, 266, 178–184 CrossRef CAS.
- J. F. Moulder and J. E. Chastain, Handbook of X-ray photoelectron spectroscopy: a reference book of standard spectra for identification and interpretation of XPS data, Perkin-Elmer Corporation, Physical Electronics Division, Eden Prairie, MN, 1992 Search PubMed.
- Thuy T. Trinh, Derrick Mott, Nguyen T. K. Thanh and Shinya Maenosono, One-pot synthesis and characterization of well defined core–shell structure of FePt@CdSe nanoparticles, RSC Adv., 2011, 1, 100–108 RSC.
- S. Maenosono, J. Lee, A. T. N. Dao and D. Mott, Peak shape analysis of ag 3d core-level X-ray photoelectron spectra of Au@Ag core–shell nanoparticles using an asymmetric Gaussian–Lorentzian mixed function, Surf. Interface Anal., 2012, 1611–1614 CrossRef CAS.
- Z. Bayindir, P. N. Duchesne, S. C. Cook, M. A. MacDonald and P. Zhang, X-ray spectroscopy studies on the surface structural characteristics and electronic properties of platinum nanoparticles, J. Chem. Phys., 2009, 131 DOI:10.1063/1.3276917.
- S. Doniach and M. Sunjic, Many-electron singularity in X-ray photoemission and X-ray line spectra from metals, J. Phys. C: Solid State Phys., 1970, 3 DOI:10.1088/0022-3719/3/2/010.
- D. Eberbeck, C. L. Dennis, N. F. Huls, K. L. Krycka, C. Gruttner and F. Westphal, Multicore magnetic nanoparticles for magnetic particle imaging, IEEE Trans. Magn., 2013, 49, 269–274 CrossRef.
- F. Q. Yu, Y. Z. Huang, A. J. Cole and V. C. Yang, The artificial peroxidase activity of magnetic iron oxide nanoparticles and its application to glucose detection, Biomaterials, 2009, 30, 4716–4722 CrossRef CAS PubMed.
- A. K. Kandalam, B. Chatterjee, S. N. Khanna, B. K. Rao, P. Jena and B. V. Reddy, Oxidation of Co on Fe2O3 model surfaces, Surf. Sci., 2007, 601, 4873–4880 CrossRef CAS PubMed.
- R. Hudson, A. Riviere, C. M. Cirtiu, K. L. Luska and A. Moores, Iron–iron oxide core–shell nanoparticles are active and magnetically recyclable olefin and alkyne hydrogenation catalysts in protic and aqueous media, Chem. Commun., 2012, 48, 3360–3362 RSC.
Footnote |
| † Electronic supplementary information (ESI) available. See DOI: 10.1039/c3ra44319a |
| This journal is © The Royal Society of Chemistry 2014 |