DOI:
10.1039/C2RA22572G
(Communication)
RSC Adv., 2013,
3, 64-67
A quinoline-based turn-off fluorescent cation sensor†
Received
18th October 2012
, Accepted 23rd October 2012
First published on 23rd October 2012
Abstract
A quinoline-based cation sensor shows turn-off fluorescent behavior in the presence of Hg2+, Fe3+ and Cu2+ over other cations and offers discrimination of these cations from each other on the basis of the extent of quenching. The observed electronic absorption perturbations are in good agreement with theoretical (DFT, TD-DFT) calculations.
Development of functional chemosensors for the detection and quantification of important physiological and environmental analytes such as Hg2+, Cu2+ and related cations has received increased interest in recent years.1 Effective operational usage of these chemosensors requires their high sensitivity and selectivity towards the analytes. Although a large variety of highly selective2 single as well as multianalyte chemosensors3 have been reported, the development of sensors for multianalyte detection in real time is still a challenge. With this aim, the emphasis in recent years has been placed on the development of optically responsive sensors for the detection of analytes. The use of fluorescence as the signal transducing method in optical sensors offers distinct advantages in terms of sensitivity, selectivity and response time.4 Consequently, fluorescent molecular sensors have attracted considerable recent interest.5 Moreover, the development of fluorescent sensors for transition metals is of increasing importance for biological and environmental applications. In continuation of our interest in the development of chemosensors and chemodosimeters,6 herein we report a quinoline-based turn-off fluorescent cation sensor 5 (Scheme 1) which additionally discriminates between the detected cations by differential fluorescence emission quenching. The quinoline-based sensing reported so far is mainly based on dynamic and/or static quenching processes in the presence of analytes. Receptor 5 was synthesized7 by following the steps described in Scheme 1 and was fully characterized using different spectroscopic techniques (S1, ESI†) before use.
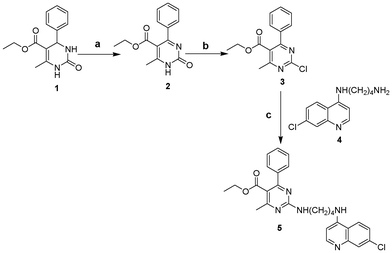 |
| | Scheme 1 Reagents and conditions: (a) pyridinium chlorochromate, CH2Cl2, 24 h; (b) POCl3, 105 °C, 45 min; (c) THF, K2CO3, r.t., 48 h. | |
Our preliminary investigation revealed that the emission (Fig. 1) as well as absorption spectra (Fig. S1, ESI†) of 5 were perturbed only in the presence of Fe3+, Hg2+ and Cu2+ and not by the other cations, which led us to quantify the results for these three ions only. The fluorescence emission spectrum (λex = 330 nm) of 5 (30 μM in CH3OH) exhibits an emission band at 376 nm. The calculated quantum yield is 0.024 (ESI†) which is relatively low compared to the usual values.
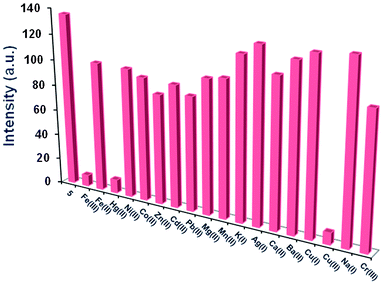 |
| | Fig. 1 Fluorescence intensities of 5 (30 μM) in CH3OH upon addition of different metal ions (60 μM) in distilled H2O (λex = 330 nm) at pH 7.4. | |
The incremental addition of Hg2+, Fe3+ and Cu2+ solutions (0–1.0 equiv. in distilled H2O) caused 69–94% quenching of the emission which was stabilized when the addition of 1 equiv. of the cation was achieved (Fig. 2a, Table 1). No significant change in the position of the emission maximum was observed up to the addition of 1 equiv. of Hg2+ as depicted in Fig. 2(a). (For the fluorescence spectra upon addition of 0–1.5 equiv. see Fig. S2†). Furthermore, a Job plot suggested 1![[thin space (1/6-em)]](https://www.rsc.org/images/entities/char_2009.gif) :1 stoichiometry where the maximum emission change was observed when the mole fraction of 5versus the cation was 0.5 in each case (Fig. 2b, Fig. S2†). The detection limits (DL) for Fe3+, Hg2+ and Cu2+ ions using 5 were determined from the calibration curves of absorbance versus composition and were found to be 9.24 × 10⁻⁵ M, 2.94 × 10⁻⁴ M and 4.17 × 10⁻⁴ M, respectively.8 During competition experiments under similar experimental conditions, no interference from other metal ions was observed (Fig. 3, Fig. S3†). Further, the sensing event was reversed upon addition of CN−, which snatches away the metal ions from 5, forming the metal cyanide complexes (Fig. 4).9
:1 stoichiometry where the maximum emission change was observed when the mole fraction of 5versus the cation was 0.5 in each case (Fig. 2b, Fig. S2†). The detection limits (DL) for Fe3+, Hg2+ and Cu2+ ions using 5 were determined from the calibration curves of absorbance versus composition and were found to be 9.24 × 10⁻⁵ M, 2.94 × 10⁻⁴ M and 4.17 × 10⁻⁴ M, respectively.8 During competition experiments under similar experimental conditions, no interference from other metal ions was observed (Fig. 3, Fig. S3†). Further, the sensing event was reversed upon addition of CN−, which snatches away the metal ions from 5, forming the metal cyanide complexes (Fig. 4).9
![(a) Fluorescence spectra of 5 (30 μM) in CH3OH upon addition of Hg2+ (0–1.0 equiv.) in distilled H2O (λex = 330 nm) at pH 7.4 (for 0–1.5 equiv. see Fig. S2); (b) Job plot of Hg2+ complex formation, x = [5]/[5] + [Hg2+] is the mole fraction of 5, F0 is the fluorescence intensity when x = 1 and F is the fluorescence intensity at respective values of x (for Fe3+ and Cu2+ titration profiles for 0–1.5 equiv., see Fig. S2).](/image/article/2013/RA/c2ra22572g/c2ra22572g-f2.gif) |
| | Fig. 2 (a) Fluorescence spectra of 5 (30 μM) in CH3OH upon addition of Hg2+ (0–1.0 equiv.) in distilled H2O (λex = 330 nm) at pH 7.4 (for 0–1.5 equiv. see Fig. S2†); (b) Job plot of Hg2+ complex formation, x = [5]/[5] + [Hg2+] is the mole fraction of 5, F0 is the fluorescence intensity when x = 1 and F is the fluorescence intensity at respective values of x (for Fe3+ and Cu2+ titration profiles for 0–1.5 equiv., see Fig. S2†). | |
Table 1 Fluorescence quantum yield (Φ) and % fluorescence quenching of 5
| Compound |
Fluorescence quantum yieldaΦ |
% Fluorescence quenchingb,c |
|
Quinine sulfate was used as standard with a quantum yield of 0.55 in 0.1 N H2SO4 at λex = 320 nm.
Calculated at 1 equiv. of metal ions.
Values in parentheses correspond to 1.5 equiv. of metal ions.
|
|
5
|
0.024 |
— |
|
5:Fe3+ |
0.002 |
94 (94) |
|
5:Hg2+ |
0.003 |
87 (92) |
|
5:Cu2+ |
0.004 |
69 (80) |
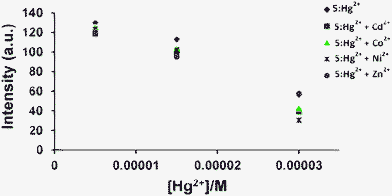 |
| | Fig. 3 Changes in the fluorescence intensity of 5 (30 μM) in CH3OH at 376 nm upon titration with increasing concentration of Hg2+ (5, 15 and 30 μM) in distilled H2O, in the presence of other metal ions (30 μM) in distilled H2O at pH 7.4. | |
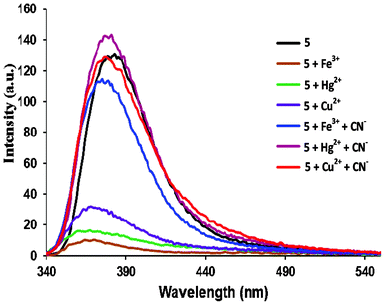 |
| | Fig. 4 Changes in the fluorescence spectra of metal complexes (5:Fe3+, 5:Hg2+ and 5:Cu2+) in the presence of CN− (60 μM) in distilled H2O. | |
Stern–Volmer plots were created for the titration of these cations (Fig. 5). Typically, Stern–Volmer plots are linear for dynamic (collisional) quenching which occurs when the excited fluorophore experiences interaction with an atom or molecule which can facilitate non-radiative transitions to the ground state, and for static quenching due to the formation of a non-fluorescent stable complex with a quencher. They deviate from linearity when both of these quenching mechanisms operate in combination. The non-linear nature of the Stern–Volmer plot with an upward curvature (Fig. 5) indicates the possible involvement of combined dynamic and static quenching.10 However, it is interesting to note that the degree of quenching is large for Fe3+ followed by Hg2+ and lower for Cu2+, which is important for discriminating these cations from each other (Fig. 5). A similar type of Stern–Volmer plot behaviour has been reported by Giri et al.11 for fluorescein, rhodamine 6G and quinine sulfate in the presence of single walled carbon nanotubes.
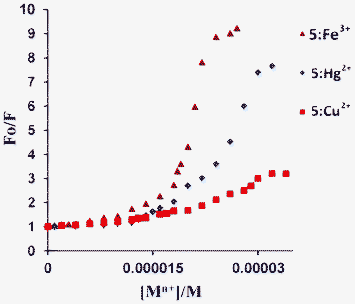 |
| | Fig. 5 Stern–Volmer plots for Mn+, where Mn+ = Fe3+, Hg2+, and Cu2+. | |
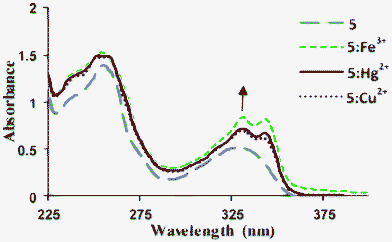
The UV-vis absorption spectrum of 5 exhibited bands at 330 nm (εmax 15733 L mol−1 cm−1) and 255 nm (εmax 46433 L mol−1 cm−1) (Fig. 6, Fig. S4†). Addition of aqueous solutions of Hg2+, Fe3+ and Cu2+ ions (0–1.5 equiv., as ClO4− salts) to a solution of 5 (30 μM in CH3OH) resulted in the appearance of twin absorption bands at 330 and 343 nm with increased variable intensities [330 nm: εmax 21633 L mol−1 cm−1 (Hg2+), 24566 L mol−1 cm−1 (Fe3+), 22433 L mol−1 cm−1 (Cu2+); 343 nm: εmax 20126 L mol−1 cm−1 (Hg2+), 24194 L mol−1 cm−1 (Fe3+), 19393 L mol−1 cm−1 (Cu2+)]. The high energy band at 255 nm was not perturbed significantly other than some broadening. Fitting the titration data using HypSpec, a non-linear least squares fitting programme,12 established the1:1 stoichiometry of the most stable species present in the solution with binding constant values, log β1,1 = 5.20 (Fe3+), 4.69 (Hg2+) and 4.45 (Cu2+), respectively.
 |
| | Fig. 6 Changes in the UV-vis absorption spectra of 5 (30 μM) in CH3OH and its complexes with Fe3+ (32 μM), Hg2+ (35 μM) and Cu2+ (40 μM) in distilled H2O at pH 7.4. | |
In order to understand the nature of these transitions in terms of the participation of different frontier orbitals in the observed electronic changes, we carried out TD-DFT calculations for 5 and 5:Mn+ using the Gaussian 09 suite of programs.13 The best optimized structures are shown in Fig. S5†. The TD-DFT calculations (Table S1†) predict that the low energy band of 5 has a main contribution from the H → L + 1 transition and these orbitals are located on the quinoline part of 5 with some contribution from the H → L transition (Fig. 7). The high energy band at 255 nm has contributions from the H → L + 3, H − 2 → L + 2, H − 4 → L + 2, H − 4 → L, H − 7 → L + 3 transitions (Table S1†). In the case of 5:Hg2+, the twin absorption band has contributions from the H → L + 1 and H → L + 2 transitions (Table S2†). As shown in Fig. 7, we noticed that on interaction with Hg2+, the HOMO (located on quinoline) was stabilized (ΔE 0.14 eV) in comparison to 5 and the L + 1 was raised in energy to a very small extent (ΔE 0.03 eV). This suggests that the interaction of Hg2+ with the quinoline part of the molecule is responsible for the quenching of the fluorescence emission. On the other hand, in the case of Cu2+, of the twin absorptions at 330 and 343 nm, the high energy dominating absorption band is suggested to have a main contribution from the H → L + 3 transition (Fig. 7, Table S3†). Although the HOMO in this case is more stabilized (ΔE 0.76 eV) as compared to 5:Hg2+ (Fig. 7), the close values of the appropriate HOMO–LUMO gap (ΔE2, ΔE3 and ΔE4) corroborate the calculated binding constant values of the complexes of Hg2+ and Cu2+ with 5. DFT calculations on the 5:Fe3+ system did not yield reproducible results.
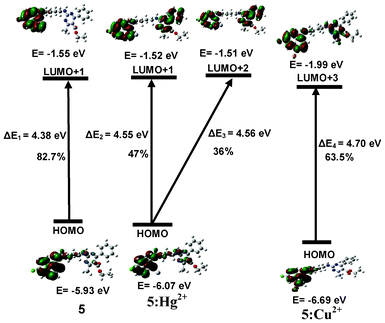 |
| | Fig. 7 Energy level diagrams of HOMO (H) and LUMO (L) orbitals (isovalue 0.02) of 5, 5:Hg2+ and 5:Cu2+ calculated at the DFT level (for optimized structures of 5, 5:Hg2+ and 5:Cu2+ see Fig. S5†). | |
Conclusions
In conclusion, the present study demonstrates that the quinoline-based chemosensor detects Hg2+, Fe3+ and Cu2+ through fluorescence quenching to different extents which is helpful in discriminating these cations from each other. Dynamic and static quenching mechanisms have been proposed to operate in combination. The perturbation in the electronic behaviour of 5 in the presence of these cations is well correlated with the results of TD-DFT studies.
Acknowledgements
PK thanks CSIR [01(2265)/08-EMR(II)], New Delhi, KS thanks UGC, New Delhi for the project 37-188/2009 (SR) and SAP (DRS-1). HK acknowledges CSIR (F.No. 09/254 (0195)/2009-EMR-I), New Delhi for a senior research fellowship.
References
-
(a) J. Due, M. Hu, J. Fan and X. Peng, Chem. Soc. Rev., 2012, 41, 4511–4535 RSC;
(b) G. Aragay, J. Pons and A. Merkoci, Chem. Rev., 2011, 111, 3433–3458 CrossRef CAS;
(c) D. T. Quang and J. S. Kim, Chem. Rev., 2010, 110, 6280–6301 CrossRef CAS;
(d) W. S. Han, H. Y. Lee, S. H. Jung, S. J. Lee and J. H. Jung, Chem. Soc. Rev., 2009, 38, 1904–1915 RSC;
(e) P. A. Gale, S. E. Garcia-Garrido and J. Garric, Chem. Soc. Rev., 2008, 37, 151–190 RSC;
(f) E. M. Nolan and S. J. Lippard, Chem. Rev., 2008, 108, 3443–3480 CrossRef CAS.
-
(a) H. Zheng, M. Yan, X.-X. Fan, D. Sun, S.-Y. Yang, L.-J. Yang, J.-D. Li and Y.-B. Jiang, Chem. Commun., 2012, 48, 2243–2245 RSC;
(b) L. Huang, J. Cheng, K. Xie, P. Xi, F. Hou, Z. Li, G. Xie, Y. Shi, H. Liu, D. Bai and Z. Zeng, Dalton Trans., 2011, 40, 10815–10817 RSC;
(c) H. S. Jung, P. S. Kwon, J. W. Lee, J. Kim, C. S. Hong, J. W. Kim, S. Yan, J. Y. Lee, J. H. Lee, T. Joo and J. S. Kim, J. Am. Chem. Soc., 2009, 131, 2008–2012 CrossRef CAS;
(d) S. Voutsadaki, G. K. Tsikalas, E. Klontzas, G. E. Froudaskis and H. E. Katerinopoulos, Chem. Commun., 2010, 46, 3292–3294 RSC;
(e) M. Hu, J. Fan, J. Cao, K. Song, H. Zhang, S. Sun and X. Peng, Analyst, 2012, 137, 2107–2111 RSC;
(f) J. Yao, W. Dou, W. Qin and W. Liu, Inorg. Chem. Commun., 2009, 12, 116–118 CrossRef CAS;
(g) D.-N. Lee, G.-J. Kim and H.-J. Kim, Tetrahedron Lett., 2009, 50, 4766–4768 CrossRef CAS.
-
(a) F. Hou, J. Cheng, P. Xi, F. Chen, L. Huang, G. Xie, Y. Shi, H. Liu, D. Bai and Z. Zeng, Dalton Trans., 2012, 41, 5799–5804 RSC;
(b) M. Li, H.-Y. Lu, R.-L. Liu, J.-D. Chen and C.-F. Chen, J. Org. Chem., 2012, 77, 3670–3673 CrossRef CAS;
(c) A. -B. Bon, A. M. Costero, S. Gil, M. Parra, J. Soto, R. Martinez-Manez and F. Sancenon, Chem. Commun., 2012, 48, 8407 RSC;
(d) X. Zeng, L. Dong, C. Wu, L. Mu, S. Xue and Z. Tau, Sens. Actuators, B, 2009, 141, 506–510 CrossRef;
(e) A. K. Mandal, M. Suresh, E. Suresh, S. K. Mishra, S. Mishra and A. Das, Sens. Actuators, B, 2010, 145, 32–38 CrossRef;
(f) B. N. Ahamed, I. Ravikumar and P. Ghosh, New J. Chem., 2009, 33, 1825–1828 RSC;
(g) S. Ghosh, R. Chakarbarty and P. S. Mukherjee, Inorg. Chem., 2009, 48, 549–556 CrossRef CAS.
-
(a) Z. Xu, K.-H. Baek, H. N. Kim, J. Cui, X. Quan, D. R. Spring, I. Shin and J. Yoon, J. Am. Chem. Soc., 2010, 132, 601–610 CrossRef CAS;
(b) Q. Li, M. Peng, H. Li, C. Zhong, L. Zhang, X. Cheng, X. Peng, Q. Wang, J. Qin and Z. Li, Org. Lett., 2012, 14, 2094–2097 CrossRef CAS;
(c) H. Zheng, X.-J. Zhang, X. Cai, Q.-N. Bian, M. Yan, G.-H. Wu, X. W. Lai and Y.-B. Jiang, Org. Lett., 2012, 14, 1986–1989 Search PubMed;
(d) X. Qu, Q. Liu, X. Ji, H. Chen, Z. Zhou and Z. Shen, Chem. Commun., 2012, 48, 4600–4602 RSC.
-
(a) W. Xuan, C. Chen, Y. Cao, W. He, W. Jiang, K. Liu and W. Wang, Chem. Commun., 2012, 48, 7292–7294 RSC;
(b) S. Kotha, D. Goyal, S. Banerjee and A. Datta, Analyst, 2012, 137, 2871–2875 RSC;
(c) X. Sun, Y.-W. Wang and Y. Peng, Org. Lett., 2012, 14, 3420–3423 Search PubMed;
(d) X. Wang, J. Hu, T. Liu, G. Zhang and S. Liu, J. Mater. Chem., 2012, 22, 8622–8628 RSC;
(e) H. L. Li, J. L. Fan, J. J. Du, K. X. Guo, S. G. Sun, X. J. Liu and X. J. Peng, Chem. Commun., 2010, 46, 1079–1081 RSC;
(f) J. Wang, W. Lin, L. Yuan, J. Song and W. Gao, Chem. Commun., 2011, 47, 12506–12508 RSC;
(g) Z. X. Han, H. Y. Luo, X. B. Zhang, R. M. Kong, G. L. Shen and R. Q. Yu, Spectrochim. Acta, Part A, 2009, 72, 1084–1088 CrossRef;
(h) C. Huang, J. Fan, X. Peng, Z. Lin, B. Guo, A. Ren, J. Cui and S. Sun, J. Photochem. Photobiol., A, 2008, 199, 144–149 CrossRef CAS;
(i) S. Young, Spectrochim. Acta, Part A, 2007, 68, 705–709 CrossRef;
(j) M. Shamsipur, M. Hosseini, K. Alizadeh, N. Alizadeh, A. Yari, C. Caltagirone and V. Lippolis, Anal. Chim. Acta, 2005, 533, 17–24 CrossRef CAS;
(k) S. Y. Moon, N. R. Cha, Y. H. Kim and S. K. Chang, J. Org. Chem., 2004, 69, 181–183 CrossRef CAS;
(l) A. B. Descalzo, R. Martinez-Manez, R. Radeglia, K. Rurack and J. Soto, J. Am. Chem. Soc., 2003, 125, 3418–3419 CrossRef CAS.
-
(a) P. Kaur, D. Sareen and K. Singh, Dalton Trans., 2012, 41, 9607–9610 RSC;
(b) P. Kaur, D. Sareen and K. Singh, Dalton Trans., 2012, 41, 8767–8769 RSC;
(c) P. Kaur, S. Kaur and K. Singh, Org. Biomol. Chem., 2012, 10, 1497–1501 RSC;
(d) P. Kaur, S. Kaur, K. Singh, P. R. Sharma and T. Kaur, Dalton Trans., 2011, 40, 10818–10821 RSC;
(e) P. Kaur, D. Sareen and K. Singh, Talanta, 2011, 83, 1695–1700 CrossRef CAS;
(f) P. Kaur and D. Sareen, Dyes Pigm., 2011, 88, 296–300 CrossRef CAS;
(g) P. Kaur, S. Kaur, Y. Kasetti, P. V. Bharatam and K. Singh, Talanta, 2010, 83, 644–650 CrossRef CAS;
(h) P. Kaur, S. Kaur and K. Singh, Inorg. Chem. Commun., 2009, 12, 978–981 CrossRef CAS;
(i) P. Kaur, D. Sareen, S. Kaur and K. Singh, Inorg. Chem. Commun., 2009, 12, 272–275 CrossRef CAS;
(j) P. Kaur, S. Kaur, A. Mahajan and K. Singh, Inorg. Chem. Commun., 2008, 11, 626–629 CrossRef CAS;
(k) P. Kaur, S. Kaur and K. Singh, Tetrahedron Lett., 2007, 48, 7191–7193 CrossRef CAS.
- K. Singh, H. Kaur, K. Chibale, J. Balzarini, S. Little and P. V. Bharatam, Eur. J. Med. Chem., 2012, 52, 82–97 Search PubMed.
- Detection limit (DL) is given as DL = (0.03 × RSDB)/(xA/c0), where RSDB (relative standard deviation of the background expressed as a percentage) is the sensitivity (the slope of the calibration curve of intensity versus composition), xA is the net analyte signal (i.e. signal above background) and c0 is the composition of the element in the sample.
-
(a) X. Lou, D. Ou, Q. Li and Z. Li, Chem. Commun., 2012, 48, 8462–8477 RSC;
(b) A. Helal, S. Kim and H.-S. Kim, Bull. Korean Chem. Soc., 2011, 32, 3123–3126 Search PubMed;
(c) Z. Xu, J. Pan, D. R. Spring, J. Cui and J. Yoon, Tetrahedron, 2010, 66, 1678–1683 CrossRef CAS;
(d) Q. Zeng, P. Cai, Z. Li, J. Qin and B. Z. Tang, Chem. Commun., 2008, 1094–1096 RSC;
(e) X. Lou, L. Zhang, J. Qin and Z. Li, Chem. Commun., 2008, 5848–5850 RSC.
-
J. R. Lakowicz, Principles of fluorescence spectroscopy, Springer, New York, 3rd edn, 2006 Search PubMed.
- D. K. Singh, P. K. Iyer and P. K. Giri, Carbon, 2012, 50, 4495–4505 Search PubMed.
- P. Gans, A. Sabatini and A. Vacca, Talanta, 1996, 43, 1739–1753 CrossRef CAS.
-
M. J. Frisch
et al., Gaussian 09, Revision B.01, Gaussian, Inc., Wallingford, CT, 2010 Search PubMed, complete reference in ESI†.
Footnote |
| † Electronic supplementary information (ESI) available: Synthetic procedures, characterization and spectral data of 5, additional fluorescence, UV-vis and TD-DFT data, Gaussian optimized structures, calculation of quantum yield and complete ref. 13. See DOI: 10.1039/c2ra22572g |
|
| This journal is © The Royal Society of Chemistry 2013 |
Click here to see how this site uses Cookies. View our privacy policy here.