Modelling fluorescence in clinical photodynamic therapy†
Ronan M.
Valentine
*a,
Sally H.
Ibbotson
a,
Kenny
Wood
b,
C. Tom A.
Brown
b and
Harry
Moseley
a
aPhotobiology Unit, Ninewells Hospital and Medical School, University of Dundee, Dundee, DD1 9SY, UK. E-mail: r.y.valentine@dundee.ac.uk
bSUPA, School of Physics and Astronomy, University of St Andrews, North Haugh, St Andrews, Fife, KY16 9SS, UK
First published on 25th October 2012
Abstract
Understanding the interactions of non-ionizing radiation with living organisms has been the focus of much research over recent decades. The complex nature of these interactions warrants development of theoretical and experimental studies to gain an insight into predicting and monitoring the success of photodynamic therapy (PDT) protocols. There is a major impetus towards evidence-based recommendations for patient diagnosis, treatment and management. Knowledge of the biophysical aspects of PDT is important for improving dosimetry protocols. Fluorescence in clinical PDT may be used to detect and diagnose pre-malignant and malignant conditions, while photobleaching can monitor changes in fluorescence during treatment. Combining empirical fluorescence photobleaching clinical data with computational modelling enables clinical PDT dosimetry protocols to be investigated with a view to optimising treatment regimes. We will discuss how Monte Carlo radiation transfer (MCRT) modelling has been intercalated in the field of fluorescence detection and PDT. In this paper we highlight important aspects of basic research in PDT by reporting on the current utilisation of fluorescence in clinical PDT from both a clinical and theoretical perspective. Understanding and knowledge of light propagation in biological tissue from these perspectives should have a positive impact on treatment planning.
1. Background and introduction
Photodynamic therapy (PDT) is an effective but not yet optimised therapy for patients presenting with superficial non-melanoma skin cancers (NMSC) and dysplasia.1,2 PDT employs the use of photosensitisers, which are drugs that become activated in the presence of light. Initially, a photosensitiser is either topically or systemically administered to a patient. Following a time delay of hours to days, optimal localisation of the photosensitiser in the tumour occurs and the tumour is then irradiated with visible light. The light is absorbed by the photosensitiser, which triggers photochemical reactions producing cytotoxic species3 that generate PDT-induced tumour damage.PDT dates back as far as 1900, when Oscar Raab was the first to accidently demonstrate that the combination of acridine red and light elicited a detrimental effect on in vitro paramecium.4 Lipson et al. were largely responsible for initiating the modern era of PDT when studies involving hematoporphyrin derivative (HpD) were performed in the 1960s.5,6 In 1978, Dougherty first demonstrated the clinical effectiveness of PDT by performing treatments on 25 patients presenting with a total of 113 skin tumours.7 Kennedy et al. introduced the concept of topical PDT employing 5-aminolaevulinic acid (5-ALA) and reported his clinical experience in 1990.8 As a result, PDT in dermatology typically employs photosensitiser pro-drugs, usually 5-aminolaevulinic acid (5-ALA) or its methyl ester, methyl aminolevulinate (MAL).
Following administration of these pro-drugs to skin lesions, uptake and conversion to protoporphyrin IX (PpIX) occurs via the haem biosynthetic pathway resulting in the accumulation of PpIX in lesional cells. PDT occurs when PpIX is activated with wavelengths around 630 nm and this is chosen due to its depth of tissue penetration. Fluorescence detection (FD) takes place when PpIX is excited at around 405 nm, which then emits a characteristic red fluorescence peak at approximately 635 nm. FD is widely used as an adjunct to PDT. In 1924, Policard reported on the fluorescence of tumours under illumination with UV/violet light.9 Since then there have been many fluorescence studies pertaining to PDT in dermatology.10–13 The observation of surface PpIX fluorescence is typically used as a detector of pre-malignant and malignant diseases. Also, the decrease in surface PpIX fluorescence during PDT (photobleaching) serves to monitor the treatment progress. An optical technique, known as fluorescence spectroscopy, may be employed to detect this surface PpIX fluorescence by using light–tissue interactions. The diagnostic potential of fluorescence spectroscopy lies in its sensitivity to various biochemical and structural changes in tissue that accompany the developments from normal tissue to cancer.14,15
Implicit dosimetry is a technique, which uses fluorescence photobleaching as a dose metric and a surrogate for measuring the generation of singlet oxygen.16 Therefore, monitoring in vivo PpIX fluorescence and photobleaching during PDT may provide information about the amount of photosensitiser in the tissue that has become photobleached during treatment, allowing singlet oxygen production to be inferred.17 While surface PpIX fluorescence is diminished at the end of standard treatment, PpIX fluorescence may still be present at depth in the tumour. Modelling fluorescence can extract pertinent photosensitiser and singlet oxygen information at depth, which should optimise clinical PDT treatment times.
Fluorescence signals depend on the characteristics of the fluorophore in question but are also strongly influenced by tissue optical properties.18 Further optimisation warrants investigation into the propagation of light through biological tissue. In order to gain more of an understanding of fluorescence in clinical PDT and to fully optimise clinical PDT treatments, radiation transfer simulations may be used. One approach is to use Monte Carlo radiation transfer (MCRT) modelling. Our three-dimensional (3D) MCRT model can tag PpIX fluorescence photons enabling us to infer where exactly they originate from within the tumour and subsequently track them to the tumour surface. Also, the position of the singlet oxygen generated within the tumour can be recorded. Monte Carlo radiation transfer (MCRT) modelling can enable predictions to be made about the efficacy of clinical PDT treatments.19
Based on the assumption of implicit dosimetry and a clinically derived photobleaching dose constant, β, as a model input parameter, we have used our MCRT model to address the question of whether it is advisable to increase treatment times beyond the disappearance of surface PpIX fluorescence. We believe there is an opportunity to provide more effective PDT at depth in the tumour by delivering a larger treatment light dose.
2. Photodiagnosis
Detection and diagnosis of NMSCs are typically undertaken by clinical assessment by a dermatologist and biopsies are often taken for histopathology confirmation. The clinical applications of these techniques are still recognised as the gold standard for diagnosing suspicious tissue. However, biopsies are invasive, inconvenient, expensive and of course add to the treatment burden. Consequently, non-invasive optical investigation of suspicious tissue may be carried out. Such investigations may be performed by employing different optical diagnostic techniques, which collectively may be termed photodiagnosis. Photodiagnosis may be used to identify and characterise cancers, which should assist in optimising treatment efficacies. Rather than requiring tissue excision, optical diagnosis depends on the interaction of light with biological tissue, which is advantageous insofar as it offers real time, non-invasive in vivo tissue diagnostic signatures. These non-intrusive techniques provide quantitative information relating to the state of the tissue, without the need for invasive tissue removal.20Fig. 1 illustrates pertinent light–tissue interactions, which are the crux of photodiagnosis.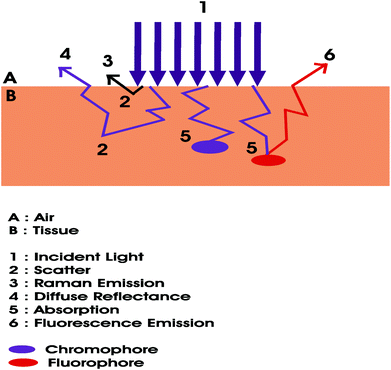 | ||
| Fig. 1 Light–tissue interactions upon which optical diagnostic techniques operate. The chromophore is used to imply that a molecule absorbs light, while the fluorophore indicates that a molecule emits light. | ||
Here we focus our attention on fluorescence signals obtained from tissue. There are many clinical advantages associated with fluorescence spectroscopy such as earlier diagnosis and immediate treatment. Also, it can assist in pharmacokinetic studies of drug-induced fluorescence. Fluorescence detection may potentially provide a higher predictive accuracy in locating optimal biopsy sites and assist in defining surgical margins for tumour excision.21 Importantly, changes in fluorescence spectra pertains to biochemical changes in tissue that precede morphological changes in tissue, which may potentially offer earlier detection of disease.22
2.1 Fluorescence in clinical PDT
Fluorescence detection may be performed on normal skin as well as NMSC. Fluorescence observed from naturally occurring endogenous skin chromophores – nicotinamide adenine dinucleotide (NADH), collagen and tryptophan – is known as autofluorescence, which exhibits relatively broad spectral emission and has been used to discriminate normal skin tissue from NMSC.23Table 1 lists well known skin chromophores and fluorophores.24 Brancaleon et al.25 have previously shown that in vivo autofluorescence of NMSC is different from that of normal tissue due to variations in tryptophan and dermal collagen crosslinks. Also, due to the selective build-up of PpIX in tumours, in vivo fluorescence spectroscopy shows the preferential accumulation of PpIX in lesional cells, which can be used diagnostically for NMSC. The measured fluorescence signals contain information pertaining to the concentration and distribution of a fluorophore. Investigating PpIX fluorescence has the potential to optimise PDT treatment parameters and monitor the drug during treatment.17Fig. 2 illustrates the characteristic PpIX absorption spectrum together with the typical PpIX fluorescence spectrum.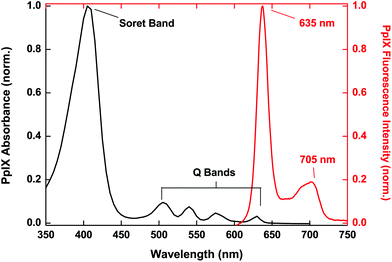 | ||
| Fig. 2 Broad PpIX absorption spectrum together with characteristic PpIX fluorescence emission with a dominant peak at 635 nm. | ||
| Skin chromophore | Absorption spectral range | Fluorescence | Absorption maxima (nm) | Emission maxima (nm) |
|---|---|---|---|---|
| Oxyhaemoglobin | UV-visible | No | 412, 542, 577 | — |
| Deoxyhaemoglobin | UV-visible | No | 430, 555, 760 | — |
| Melanin | UV-visible | No | Increases with decreasing wavelengths | — |
| Water | IR-long visible | No | 760, 900, 1250, 1400 | — |
| Porphyrins | Visible | Yes | Ex: ∼405 nm | Em: 630 nm |
| NADH | UV | Yes | Ex: ∼350 nm | Em: 460 nm |
| Tryptophan | UV | Yes | Ex: 295 nm | Em: 340–350 nm |
| Collagen | UV | Yes | Ex: 335, 370 nm | Em: 380, 460 nm |
| Elastin | UV-visible | Yes | Ex: 420, 460 nm | Em: 500, 540 nm |
Prodrug-induced PpIX generation depends on the enhanced retention at the site of application, the augmented rate of pro-drug uptake and also on the rate of enzymatic conversion of the pro-drug into PpIX.26 The success of PDT may be limited by the transport and distribution of the pro-drug in the tumour.27
Fluorescence spectroscopy commonly employs fibre optic probes – placed in contact with the tissue surface – which deliver excitation light to a tissue site.28 Also, studies involving fluorescence imaging have been carried out, allowing larger suspicious areas to be inspected.29,30 We have used an optical biopsy system (OBS) operating on the principle of fluorescence spectroscopy to investigate and compare ALA and MAL-induced PpIX fluorescence in vivo in patients presenting with Bowen's Disease (BD) and superficial basal cell carcinoma (sBCC) receiving PDT.31Fig. 3 illustrates differences in PpIX fluorescence from a sBCC and surrounding normal skin and Fig. 4 depicts mean PpIX fluorescence intensity spectra and photobleaching of PpIX recorded from patients presenting with BD and sBCC and with varying cream application times. In all cases, the mean PpIX fluorescence intensities recorded during treatment and after treatment are less than 10% and 5%, respectively of their corresponding mean PpIX fluorescence intensity recorded before treatment.
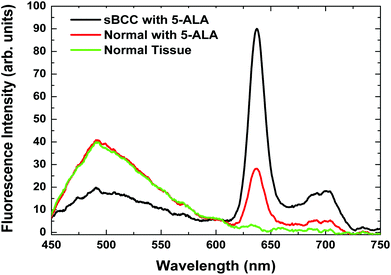 | ||
Fig. 3 Fluorescence intensity spectra illustrating the differences in PpIX fluorescence, from a sBCC lesion (-) and surrounding normal skin tissue ( ) 6 h after ALA application. Normal skin tissue that has not been incubated with ALA is also shown ( ) 6 h after ALA application. Normal skin tissue that has not been incubated with ALA is also shown ( ). Reduced autofluorescence from the lesion (-) is typical when compared to the surrounding normal skin tissue.31 ). Reduced autofluorescence from the lesion (-) is typical when compared to the surrounding normal skin tissue.31 | ||
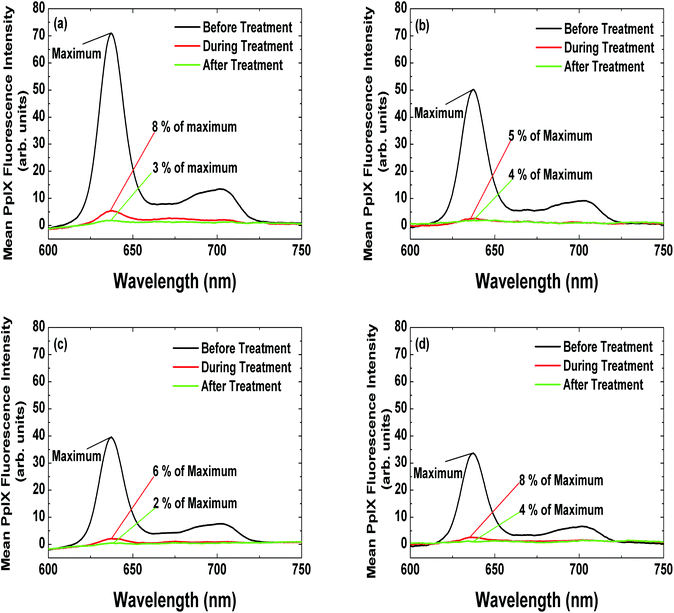 | ||
Fig. 4 Mean PpIX fluorescence intensity spectra from patients presenting with (a) sBCC after ALA application (6 h) (n = 10); (b) sBCC after MAL application (3 h) (n = 10); (c) BD after ALA application (4 h) (n = 10); and (d) BD after MAL application (3 h) (n = 10), recorded immediately before PDT (-), mid-irradiation ( ) and immediately post-PDT ( ) and immediately post-PDT ( ).31 ).31 | ||
2.2 Fluorescence photobleaching
Derived from Fig. 4, each point in Fig. 5 represents normalised (to their individual maximum PpIX fluorescence intensity) PpIX fluorescence intensity values recorded at ∼635 nm during their treatment. Assuming photobleaching follows a single exponential decay curve, a photobleaching time constant, τ (corresponding to a 1/e (∼37%) reduction in PpIX fluorescence) of 170 seconds, 165 seconds, 165 seconds and 176 seconds for Fig. 5(a), (b), (c) and (d), respectively represents the best fit to each data set. A photobleaching dose constant, β = 14 J cm−2, was used as an input parameter in our 3D MCRT model and calculated according to| β = τ (Ψ) |
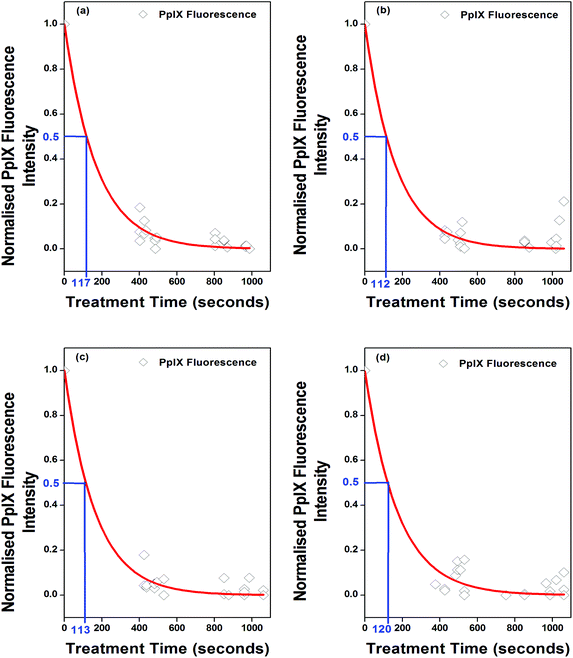 | ||
| Fig. 5 Reduction in mean normalised PpIX fluorescence intensity during PDT recorded from patients presenting with (a) sBCC after ALA application (6 h) (n = 10); (b) sBCC after MAL application (3 h) (n = 10); (c) BD after ALA application (4 h) (n = 10); and (d) BD after MAL application (3 h) (n = 10), allows for the monitoring of in vivo photobleaching. Diamonds (◊) are representative of data from individual lesions. A best-fit exponential is shown, and the time for fluorescence reduction to 50% is indicated.31 | ||
β is defined as the light dose that causes a 37% reduction in the photosensitiser fluorescence signal.32 PpIX fluorescence photobleaching occurs during treatment leading to a decrease in the observed PpIX fluorescence as the photosensitiser is photochemically destroyed by light. During PDT, singlet oxygen evolves from the interaction between excited triplet state photosensitiser molecules in tumour cells and molecular oxygen where an energy transfer occurs leading to singlet oxygen production3 (Fig. 6). Singlet oxygen is regarded as the main PDT-induced cytotoxic agent.33 The photobleaching mechanism is assumed to rely on singlet oxygen16 where reactions occur between the ground state photosensitiser and singlet oxygen causing irreversible photosensitiser destruction.
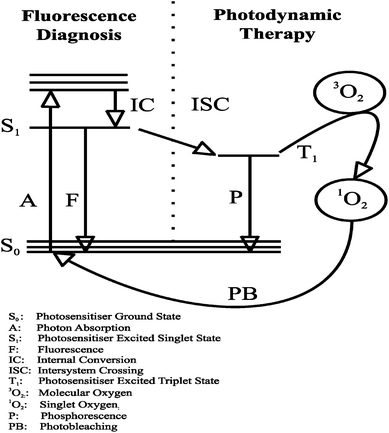 | ||
| Fig. 6 Jablonski diagram illustrating PDT reactions. | ||
PpIX fluorescence photobleaching may indirectly predict singlet oxygen generation and thus be indicative of the photodynamic dose (PDD) delivered during PDT treatment.49 The PDD may be defined as the local yield of singlet oxygen generation per unit volume of tumour tissue and is assumed to be proportional to the number of photons absorbed by the photosensitiser per unit volume of tumour tissue.34
PpIX fluorescence photobleaching may be used as a dose metric and has previously been modelled using the following equation
The PDD is directly related to the photosensitiser concentration and the light fluence rate as shown in
2.3 PDT dosimetry
A successful PDT treatment relies on optimal reactions occurring between the three critical PDT components; light, photosensitiser concentration and oxygen concentration. PDT dosimetry is complicated due to the dynamic interactions of these three treatment factors. As mentioned previously, the singlet oxygen yield during a PDT treatment may be used as a measure of the PDT dose33 In keeping with this, Wilson et al.,47 characterised and described different PDT dosimetry models, where a specific dose metric may be used to predict tissue damage.(1) Direct dosimetry depends on the detection and measurement of singlet oxygen during treatment. This may be achieved through singlet oxygen luminescence dosimetry (SOLD), which detects singlet oxygen luminescence at 1270 nm and in doing so can quantify the amount of singlet oxygen generated.36
(2) Explicit dosimetry refers to predicting the singlet oxygen generation by measuring the interdependent quantities, light, photosensitiser and oxygen individually during a PDT treatment. This dosimetry approach is challenging as it requires the measurement of the different treatment factors, which through their interdependency will impact on each other.
(a) Photosensitiser dosimetry refers to determining the photosensitiser concentration in the target tissue, which may be quantified through optical spectroscopy techniques, such as fluorescence and absorption.37
(b) Oxygen dosimetry is the least evolved in PDT. However, there have been several interesting studies performed.38,39
(c) Light dosimetry is described by calculations of the light dose, which can be practically measured and clinically implemented into routine PDT treatment protocols. The light dose is calculated by integrating the light irradiance over the time of exposure.
(3) Implicit dosimetry uses a surrogate measure – fluorescence photobleaching of the photosensitiser – during treatment to predict the generation of singlet oxygen and therefore the biological response. In vivo studies have shown a positive correlation between PpIX photobleaching and tissue damage.32
3. The radiative transfer equation
The radiative transfer equation (RTE) is associated with the theory of light transport in tissue and thus forms the basis to all light propagation models.40 The transport of photons in highly scattering tissue may be described by the RTE. The propagation of individual photons through biological tissue is affected by scattering, absorption and emission. The RTE considers changes in the flow of energy due to traversing photons and is used to describe the balance of specific intensity within a tissue volume, which can be expressed as follows41,42where c is the speed of light in the medium, Iυ(r,ŝ,t) is the specific intensity of light at position r travelling in the direction ŝ in units W cm−2 sr−1 Hz−1, ŝ is the directional unit vector, P(ŝ,ŝ′) is the scattering phase function, which describes the angular distribution of a single scattering event, dΩ′ is the differential solid angle and jυ(r,ŝ,t) – volume emissivity – in units W cm−3 sr−1, denotes a source term, which represents a local source of photons.
3.1 Light–tissue interactions
The light–tissue interactions of absorption are attributed to melanin and haemoglobin concentration, while lipids and collagen are responsible for optical scattering in tissue. Scattering in tissue is either elastic, which results in no energy transfer between the incident photon and the scattering molecule or inelastic, which occurs when there is an energy transfer from such photons.43 Tissue optical properties, such as the absorption coefficient, μa, scattering coefficient, μs, scattering anisotropy factor, g and the refractive index, n are responsible for the behaviour of light within tissue.Tissue optical properties are wavelength dependent and therefore this dependency strongly affects how deep the light may penetrate into the tissue. The therapeutic window between 600 and 1000 nm is the spectral region ideal for diagnostic and therapeutic medical applications such as PDT and fluorescence spectroscopy.23 In the visible region, the depth of light penetration increases as the wavelength increases.44 Wavelengths within this range penetrate the deepest into tissue, partly due to lower scattering but mainly because of lower absorption.45 Haemoglobin absorption greatly affects the attenuation of 405 nm light more so than 630 nm light.46 Tissue optical properties are influenced by the photosensitiser concentration and blood oxygenation, and during PDT the distribution of photosensitiser and oxygen may be altered due to photobleaching.47 The fluence rate has a dominant effect in PDT and this has been shown through several studies.32,48,49 It is important to note that the optical properties affect the fluence rate, which in turn has an impact on the PDD.
The fluence rate will increase sharply at the air-tissue boundary and then exponentially decrease with increasing depth. This sub-surface peak is attributed to the loss of backscattered light through the tissue surface.16 The penetration depth describes the optical transparency of tissue and is defined as the depth in the tissue at which the intensity of the propagating light falls to approximately 37% (1/e) of the incident value.46 The penetration depth is given by
| δ = 1/μeff |
 .
.
Wilson and Patterson50 have reported the depth of a PDT treatment, dt with typical clinical photosensitisers as
| dt ∼ 3−5δ |
A comprehensive review of optical properties has been carried out by Cheong et al.40 and Sandell and Zhu.47 Non-invasive optical properties measurements may be obtained by absorption spectroscopy and theoretically using the diffusion approximation47 and Monte Carlo modelling.
3.2 Methods for solving the radiative transfer equation
Several approaches have been employed to describe the propagation of light in biological tissue. These light propagation models solve the RTE and essentially describe the distribution of light in tissue. The diffusion approximation offers an approximate solution to the RTE. It assumes isotropic scattering within the medium and best results are achieved when scattering is much larger than absorption.41 The accuracy of the diffusion approximation is affected by anisotropic scattering, which is typical of highly forward scattering biological tissue. In tissue regions close to the surface and the illumination source, the diffusion approximation breaks down due to the scattering being highly anisotropic. Furthermore, the angular distribution of the light is poorly approximated by the diffusion approximation.51One of the most common techniques used to simulate light propagation through tissue is the Monte Carlo radiation transfer (MCRT) method.52–54 The MCRT method is a technique that solves the RTE in order to compute the distribution of light in tissue. MCRT modelling is the most flexible approach to describing photon transport in biological tissue offering information about the trajectories of individual photons through a medium, which builds up an accurate depiction of where and how the light traversed the medium.55 It is often chosen to simulate light transport in tissue as it can handle anisotropic scattering, complicated geometries, acquire tissue optical properties and compute the light dose administered to structures similar to those observed in PDT.52
It is statistical in nature and describes the propagation of light by utilising probability distribution functions (PDFs). By sampling randomly from PDFs using cumulative distribution functions (CDFs), variables such as the optical depth, τ, the albedo, a, and photon scattering angles; cosine of the deflection angle, cos θ and the azimuthal angle, ϕ, may be randomly chosen at interaction sites, enabling the position, direction and path of a photon to be determined. A computer generated pseudo-random number is used to represent a variable that is to be determined. Random numbers are the crux of the MCRT method.
The scattering of a photon is described by two directional angles; the deflection angle, θ and the azimuthal angle, ϕ. The Henyey–Greenstein scattering phase function56 is adopted to approximate scattering in tissue and is expressed mathematically in the form
g is defined as
Jacques et al.57 have shown that scattering within skin tissue can be represented quite well by the Henyey–Greenstein scattering phase function. Typical values for g are in the region of 0.7 to 0.95.
Furthermore, the azimuthal angle is taken into account by the following equation
where P(ϕ) is the probability distribution function and ϕ is the azimuthal angle, which is sampled over the interval 0 to 2π thus
| ϕ = 2πξ |
where ξ is a random number in the range 0 to 1.
3.3 Monte Carlo radiation transfer models to simulate fluorescence spectra
Light transport in tissue has been widely studied and extended to biomedical applications such as fluorescence spectroscopy and PDT.58 Jacques et al.35 and Farrell et al.17 reported on fluorescence photobleaching during PDT. Following on from this, we extended the clinical role of fluorescence spectroscopy by using spectroscopic information as inputs into our MCRT model. To more accurately represent clinical PDT, we modelled a tumour of finite size embedded and surrounded in normal tissue and subjected to a finite uniform superficial irradiation (Fig. 7).19 Our MCRT model was based on a 3D cube shaped geometry59,60 and removed the assumption of an optically semi-infinite tissue volume. The total dimensions of the cube were 20 × 20 × 20 mm (x, y, z) and the modelled tumour had a diameter of 10 mm and a thickness of 4 mm. The code was written and developed to simulate scattering, absorption, fluorescence and photobleaching in PDT. Also, an algorithm was incorporated into the code to determine singlet oxygen generation. Wavelength dependent optical properties61 were used as inputs into this model along with the addition of a photosensitiser, PpIX into the tumour.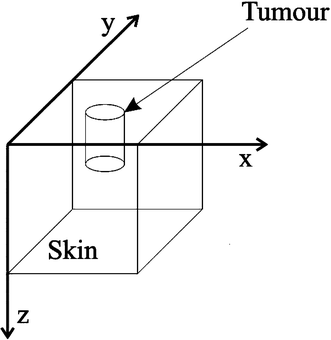 | ||
| Fig. 7 Three-dimensional (3D) MCRT model geometry, where x, y are mutually orthogonal axes in the skin surface and z represents depth within the skin tissue.19 | ||
A photobleaching dose constant, β, was obtained from in vivo ALA-induced PpIX fluorescence photobleaching data recorded from patients presenting with sBCC (Fig. 5(a)) This clinically derived value was calculated and found to be 14 J cm−2. A range of values for β have been reported in the literature ranging from 1.8 J cm−2–33 J cm−2.17,18,32,49 Therefore, from an implicit dosimetry perspective, this key parameter determines the rate at which singlet oxygen is generated in the tumour during treatment. A surface irradiance, of 82 mW cm−2 was delivered over a simulated treatment time of approximately 30 minutes, thus administrating a simulated total treatment light dose of 150 J cm−2.
PpIX fluorescence detection was simulated at particular time points in the treatment in the presence of photobleaching. PpIX fluorescence photons were tagged in our model enabling us to ascertain exactly where they originated from within the tumour. Fig. 8(a) illustrates the simulated PpIX fluorescence detected at the tumour surface, which has originated from varying tumour depths. At the beginning of the treatment simulation, PpIX fluorescence photons generated from superficial regions were high, which decreased rapidly with depth. PpIX fluorescence photons generated at shallower tumour depths have a higher probability of escape than those photons generated at deeper tumour depths. As the treatment simulation progressed and photobleaching occurred, the PpIX fluorescence photons generated near the surface decreased with more PpIX fluorescence photons originating from deeper within the tumour, contributing more to the PpIX fluorescence detected at the tumour surface.
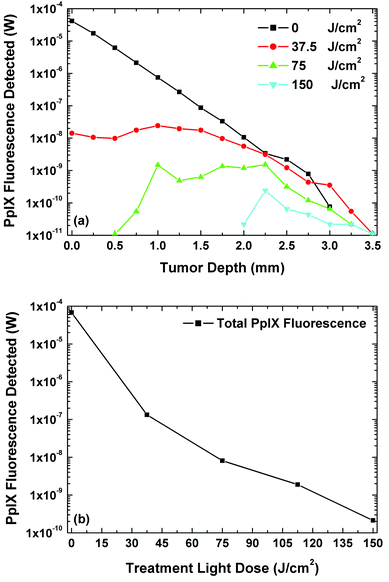 | ||
| Fig. 8 (a) PpIX fluorescence detected at the surface that has originated from varying depths in the tumour with increasing light dose in the treatment and fluorescence simulations. (b) Total PpIX fluorescence detected at the surface of the tumour with increasing light dose in the treatment and fluorescence simulations.19 | ||
Fig. 8(b) depicts the total PpIX fluorescence detected at the tumour surface with increasing treatment light dose.
We also recorded the position of the singlet oxygen generated within the tumour during the treatment simulation in the presence of photobleaching. Fig. 9 depicts the singlet oxygen production in units of 1O2 cm−3 generated in the tumour by the photosensitiser as a function of treatment light dose at varying tumour depths (1, 2, 3 and 4 mm) for a set of optical properties.61 In our model, the threshold photodynamic dose, PDT, assumed to be 8.60 × 10¹⁷ 1O2 cm−3 generated by the photosensitiser34 was signified by a horizontal line. Tissue necrosis was assumed when PDD > PDT (Fig. 9).
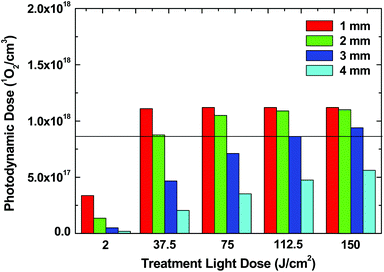 | ||
| Fig. 9 Singlet oxygen production in units of 1O2 cm−3 generated by the photosensitiser in the tumour, as a function of light dose at varying tumour depths (1, 2, 3 and 4 mm) with chosen optical properties.19 | ||
4. Conclusions
While PpIX fluorescence monitoring is widely recognised as being a potential adjunct to PDT, it has not yet gained full acceptance in the clinical setting. Fluorescence detection could improve knowledge of photosensitiser delivery and evidently PDT dosimetry. Current research is aiming to improve sensitivity and specificity values pertaining to fluorescence detection in NMSC, which are obvious pre-requisites before clinical implementation. From an empirical perspective, fluorescence signals emitted from tissues are convoluted and understanding the transport of light should assist in untangling this information. Thus, it is important to be cautious in one's interpretation of empirical PpIX fluorescence data.MCRT modelling of fluorescence and photobleaching enables predictions to be made relating to the origin of fluorescence and generation of the singlet oxygen.19 Light dosimetry planning in PDT involves estimating the fluence rate in the tissue, which is used to determine the depth of light penetration along with the value and position of the maximum light dose delivered within the tissue.62 Although accurate determination of optical properties in vivo is difficult, new technologies are paving the way for larger data sets from a range of human tissues.47
Our simulated data (Fig. 8 and 9) should facilitate predictions for PDT dosimetry pertaining to the light dose and photodynamic dose. While our model incorporates some simplifications such as assuming a constant β, unlimited oxygen availability and uniform PpIX distribution throughout the tumour, our results suggest that delivering a larger treatment light dose beyond the disappearance of surface PpIX fluorescence may continue to provide effective treatment at deeper locations in the tumour. Oseroff et al.63 previously reported on the need for a treatment light dose of at least 100 J cm−2 for effective PDT. Optimal PDT treatment regimes would provide minimal damage to normal skin while delivering an effective therapeutic result to both superficial and thicker NMSCs. Further in vivo studies are required and new provisions undertaken in order to further knowledge pertaining to PpIX fluorescence photobleaching in clinical PDT of NMSC. Also, further modelling of photon transport in tissue and calculations of photon distribution based on the RTE, which require knowledge of the absorption and scattering coefficients and the anisotropy factor can assist in optimising PDT treatment parameters, dose metrics and treatment regimes.
References
- L. R. Braathen, R.-M. Szeimies, N. Basset-Seguin, R. Bissonnette, P. Foley, D. Pariser, R. Roelandts, A.-M. Wennberg and C. A. Morton, Guidelines on the use of photodynamic therapy for nonmelanoma skin cancer: an international consensus, J. Am. Acad. Dermatol., 2007, 56, 125–143 CrossRef.
- C. A. Morton, K. E. McKenna and L. E. Rhodes, Guidelines for topical photodynamic therapy: update, Br. J. Dermatol., 2008, 159, 1245–1266 CrossRef CAS.
- S. Nonell and R. W. Redmond, On the determination of quantum yields for singlet molecular oxygen photosensitization, J. Photochem. Photobiol., B., 1994, 22, 171–172 Search PubMed.
- O. Raab, Uber die Wirkung fluoreszierender Stoffe auf Infusorien, Z. Biol., 1900, 39, 524–546 Search PubMed.
- R. L. Lipson and E. J. Baldes, The photodynamic properties of a particular hematoporphyrin derivative, Arch. Dermatol., 1960, 82, 508–516 CAS.
- R. L. Lipson, E. J. Baldes and A. M. Olsen, The use of a derivative of hematoporphyrin in tumor detection, J. Natl. Cancer Inst., 1961, 26, 1–11 CAS.
- T. J. Dougherty, Photoradiation therapy for the treatment of malignant tumours, Cancer Res., 1978, 36, 2628–2635 Search PubMed.
- J. C. Kennedy, R. H. Pottier and D. C. Pross, Photodynamic therapy with endogenous protoporphyrin IX: basic principles and present clinical experience, J. Photochem. Photobiol., B, 1990, 6, 143–148 CrossRef CAS.
- A. Policard, Etudes sur les aspects offerts par des tumeurs experimentales examinees a la lumiere de Woods, C. R. Soc. Biol., 1924, 91, 1423–1425 Search PubMed.
- A. Lesar, J. Ferguson and H. Moseley, A time course investigation of the fluorescence induced by topical application of 5-aminolevulinic acid and methyl aminolevulinate on normal human skin, Photodiagn. Photodyn. Ther., 2011, 8(2), 97–103 Search PubMed.
- A. Lesar, J. Ferguson and H. Moseley, An investigation of the fluorescence induced by topical application of 5-aminolevulinic acid and methyl aminolaevulinate at different body sites on normal human skin, Photodermatol. Photoimmunol. Photomed., 2009, 25(4), 191–195 Search PubMed.
- S. H. Ibbotson, C. Jong, A. Lesar, J. S. Ferguson, M. Padgett, M. O'Dwyer, R. Barnetson and J. Ferguson, Characteristics of 5-aminolaevulinic acid-induced protoporphyrin IX fluorescence in human skin in vivo, Photodermatol. Photoimmunol. Photomed., 2006, 22(2), 105–110 Search PubMed.
- N. van der Beek, J. de Leeuw, C. Demmendal, P. Bjerring and H. A. M. Neumann, PpIX fluorescence combined with auto-fluorescence is more accurate than PpIX fluorescence alone in fluorescence detection of non-melanoma skin cancer: an intra-patient direct comparison study, Lasers Surg. Med., 2012, 44, 271–276 Search PubMed.
- J. Q. Brown, K. Vishwanath, G. M. Palmer and N. Ramanujam, Advances in quantitative UV-visible spectroscopy for clinical and pre-clinical application in cancer, Curr. Opin. Biotechnol., 2009, 20, 119–131 Search PubMed.
- N. Rajaram, T. J. Aramil, K. Lee, J. S. Reichenberg, T. H. Nguyen and J. W. Tunnell, Design and validation of a clinical instrument for spectral diagnosis of cutaneous malignancy, Appl. Opt., 2010, 49(2), 142–152 Search PubMed.
- B. C. Wilson, M. S. Patterson and L. Lilge, Implicit and explicit dosimetry in photodynamic therapy: a new paradigm, Lasers Med. Sci., 1997, 12, 182–199 CrossRef.
- T. J. Farrell, R. P. Hawkes, M. S. Patterson and B. C. Wilson, Modeling of photosensitizer fluorescence emission and photobleaching for photodynamic therapy dosimetry, Appl. Opt., 1998, 37(31), 7168–7183 Search PubMed.
- A. J. L. Jongen and H. J. C. M. Sterenborg, Mathematical description of photobleaching in vivo describing the influence of tissue optics on measured fluorescence signals, Phys. Med. Biol., 1997, 42, 1701–1716 CrossRef CAS.
- R. M. Valentine, C. T. A. Brown, H. Moseley, S. Ibbotson and K. Wood, Monte Carlo modeling of in vivo protoporphyrin IX fluorescence and singlet oxygen production for patients presenting with superficial basal cell carcinoma, J. Biol. Opt., 2011, 16(4), 048002 Search PubMed.
- K. Badizadegan, V. Backman, C. W. Boone, C. P. Crum, R. R. Dasari, I. Georgakoudi, K. Keefe, K. Munger, S. M. Shapshay, E. E. Sheets and M. S. Feld, Spectroscopic diagnosis and imaging of invisible pre-cancer, Faraday Discuss., 2004, 126, 265–279 RSC.
- G. A. Wagnieres, W. M. Star and B. C. Wilson, In vivo fluorescence spectroscopy and imaging for oncological applications, Photochem. Photobiol., 1998, 68(5), 603–632 CAS.
- L. Coghlan, U. Utzinger, R. Richards-Kortum, C. Brookner, A. Zuluaga, I. Gimenez-Conti and M. Follen, Fluorescence spectroscopy of epithelial tissue throughout the dysplasia-carcinoma sequence in an animal model: spectroscopic changes precede morphological changes, Lasers Surg. Med., 2001, 29, 1–10 Search PubMed.
- R. Richards-Kortum and E. Sevick-Muraca, Quantitative optical spectroscopy for tissue diagnosis, Annu. Rev. Phys. Chem., 1996, 47, 555–606 CrossRef CAS.
- N. Kollias, G. Zonios and G. N. Stamatas, Fluorescence spectroscopy of skin, Vib. Spectrosc., 2002, 28(1), 17–23 Search PubMed.
- L. Brancaleon, A. J. Durkin, J. H. Tu, G. Menaker, J. D. Fallon and N. Kollias, In vivo fluorescence spectroscopy of nonmelanoma skin cancer, Photochem. Photobiol., 2001, 73(2), 178–183 CAS.
- R. F. V. Lopez, N. Lange, R. Guy and M. V. L. B. Bentley, Photodynamic therapy of skin cancer: controlled drug delivery of 5-ALA and its esters, Adv. Drug Delivery Rev., 2003, 56, 77–94 Search PubMed.
- L. O. Svaasand, B. J. Tromberg, P. Wyss, M.-T. Wyss-Desserich, Y. Tadir and M. W. Berns, Light and drug distribution with topically administered photosensitizers, Lasers Med. Sci., 1996, 11(4), 261–165 Search PubMed.
- J. C. Finlay, L. Jun, X. Zhou and T. C. Zhu, Patient-specific dosimetry for photodynamic therapy, Proc. SPIE-Int. Soc. Opt. Eng., 2008, 12III, 115–125 Search PubMed.
- J. Tyrrell, S. M. Campbell and A. Curnow, Monitoring the accumulation and dissipation of the photosensitizer protoporphyrin IX during standard dermatological methyl-aminolevulinate photodynamic therapy utilizing non-invasive fluorescence imaging and quantification, Photodyn. Photodiagn. Ther., 2011, 8(1), 30–38 Search PubMed.
- Y. Won, S. H. Hong, H. Y. Yu, Y. H. Kwon, S. J. Yun, S. C. Lee and J. B. Lee, Photodetection of basal cell carcinoma using methyl 5-aminolaevulinate-induced protoporphyrin IX based on fluorescence image analysis, Clin. Exp. Dermatol., 2007, 32(4), 423–429 CrossRef CAS.
- R. M. Valentine, S. H. Ibbotson, C. T. A. Brown, K. Wood and H. Moseley, A quantitative comparison of 5-aminolaevulinic acid- and methyl aminolevulinate-induced fluorescence, photobleaching and pain during photodynamic therapy, Photochem. Photobiol., 2011, 87(1), 242–249 Search PubMed.
- D. J. Robinson, H. S. de Bruin, N. van der Veen, M. R. Stringer, S. B. Brown and W. M. Star, Fluorescence photobleaching of ALA-induced protoporphyrin IX during photodynamic therapy of normal hairless mouse skin: the effect of light dose and irradiance and the resulting biological effect, Photochem. Photobiol., 1998, 67(1), 140–149 CrossRef CAS.
- K. R. Weishaupt, C. J. Gomer and T. J. Dougherty, Identification of singlet oxygen as cytotoxic agent in photo-inactivation of a murine tumor, Cancer Res., 1976, 36, 2326–2329 CAS.
- M. S. Patterson, B. C. Wilson and R. Graff, In vivo tests of the concept of photodynamic threshold dose in normal rat liver photosensitized by aluminium chlorosulphonated phthalocyanine, Photochem. Photobiol., 1990, 51, 343–349 CAS.
- S. L. Jacques, R. Joseph and G. Gofstein, How photobleaching affects dosimetry and fluorescence monitoring of PDT in turbid media, Proc. SPIE-Int. Soc. Opt. Eng., 1993, 1881, 168–179 Search PubMed.
- M. J. Niedre, C. S. Yu, M. S. Patterson and B. C. Wilson, Singlet oxygen luminescence as an in vivo photodynamic therapy dose metric: validation in normal mouse skin with topical amino-levulinic acid, Br. J. Cancer, 2005, 92(2), 298–304 CAS.
- T. C. Zhu and J. C. Finlay, The role of photodynamic therapy (PDT) physics, Med. Phys., 2008, 35(7), 3127–3136 CrossRef CAS.
- B. W. Henderson, T. M. Busch, L. A. Vaughan, N. P. Frawley, D. Babich, T. A. Sosa, J. D. Zollo, A. S. Dee, M. T. Cooper, D. A. Bellnier, W. R. Greco and A. R. Oseroff, Photofrin photodynamic therapy can significantly deplete or preserve oxygenation in human basal cell carcinomas during treatment, depending on fluence rate, Cancer Res., 2000, 60, 525–529 CAS.
- J. Tyrrell, C. Thorn, A. Shore, S. Campbell and A. Curnow, Oxygen saturation and perfusion changes during dermatological methylaminolaevulinate photodynamic therapy, Br. J. Dermatol., 2011, 165(6), 1323–1331 Search PubMed.
- W.-F. Cheong, S. A. Prahl and A. J. Welch, A review of the optical properties of biological tissues, IEEE J. Quantum Electron., 1990, 26(12), 2166–2185 CrossRef.
- L. V. Wang and H.-I. Wu, Biomedical Optics: Principles and Imaging, John Wiley & Sons, Inc., 2007, 88 Search PubMed.
- S. Chandrasekhar, Radiative Transfer, Dover Publications, Inc., 1960, 1 Search PubMed.
- P. Prasad, Introduction to Biophotonics, John Wiley & Sons, Inc., 2003, 169 Search PubMed.
- L. Carroll and T. R. Humphreys, Laser–tissue interactions, Clin. Dermatol., 2006, 24, 2–7 Search PubMed.
- J. Swartling, J. Svensson, D. Bengtsson, K. Terike and S. Andersson-Engels, Fluorescence spectra provide information on the depth of fluorescent lesions in tissue, Appl. Opt., 2005, 44(10), 1934–1941 Search PubMed.
- A. E. Profio and D. R. Doiron, Transport of light in tissue in photodynamic therapy, Photochem. Photobiol., 1987, 46(5), 591–599 Search PubMed.
- J. L. Sandell and T. C. Zhu, A review of in vivo optical properties of human tissues and its impact on PDT, J. Biophotonics, 2011, 4, 773–787 CrossRef.
- W. J. Cottrell, A. D. Paquette, K. R. Keymel, T. H. Foster and A. R. Oseroff, Irradiance-dependent photobleaching and pain in δ-aminolevulinic acid-photodynamic therapy of superficial basal cell carcinomas, Clin. Cancer Res., 2008, 14(14), 4475–4483 CrossRef CAS.
- M. B. Ericson, C. Sandberg, B. Stenquist, F. Gudmundson, M. Karlsson, A.-M. Ros, A. Rosen, O. Larko, A.-M. Wennberg and I. Rosdahl, Photodynamic therapy of actinic keratosis at varying fluence rates: assessment of photobleaching, pain and primary clinical outcome, Br. J. Dermatol., 2004, 151, 1204–1212 CrossRef CAS.
- B. C. Wilson and M. S. Patterson, The physics, biophysics and technology of photodynamic therapy, Phys. Med. Biol., 2008, 53, R61–R109 CrossRef CAS.
- G. Yoon, S. A. Prahl and A. J. Welch, Accuracies of the diffusion approximation and its similarity relations for laser irradiated biological media, Appl. Opt., 1989, 28(12), 2250–2255 Search PubMed.
- L. Wang, S. L. Jacques and L. Zheng, MCML – Monte Carlo modeling of light transport in multi-layered tissues, Comput. Methods Prog. Biomed., 1995, 47, 131–146 Search PubMed.
- S. A. Prahl, M. Keijzer, S. L. Jacques and A. J. Welch, A Monte Carlo model of light propagation in tissue, Proc. SPIE-Int. Soc. Opt. Eng., 1989, IS 5, 102–111 Search PubMed.
- R. M. Valentine, Biophysical Aspects of Photodynamic Therapy, PhD Thesis, University of St Andrews, 2011 Search PubMed.
- M. L. de Jode, Monte Carlo simulations of light distributions in an embedded tumour model: studies of selectivity in photodynamic therapy, Lasers Med. Sci., 2000, 15, 49–56 Search PubMed.
- L. G. Henyey and J. L. Greenstein, Diffuse radiation in the galaxy, Astrophys. J., 1941, 93, 70–83 CrossRef.
- S. L. Jacques, C. A. Alter and S. A. Prahl, Angular dependence of HeNe laser light scattering by human dermis, Lasers Life Sci., 1987, 1, 309–333 Search PubMed.
- I. Pavlova, C. R. Weber, R. A. Schwarz, M. Williams, A. El-Naggar, A. Gillenwater and R. Richards-Kortum, Monte Carlo model to describe depth selective fluorescence spectra of epithelial tissue: applications for diagnosis of oral precancer, J. Biol. Opt., 2008, 13(6), 064012 Search PubMed.
- K. Wood, J. E. Bjorkman, B. Whitney and A. D. Code, The effect of multiple scattering on the polarization from axisymmetric circumstellar envelopes. I. Pure Thomson scattering envelopes, Astrophys. J., 1996, 461, 828–846 Search PubMed.
- K. Wood, J. E. Bjorkman, B. Whitney and A. D. Code, The effect of multiple scattering on the polarization from axisymmetric circumstellar envelopes. II. Thomson scattering in the presence of absorptive opacity sources, Astrophys. J., 1996, 461, 847–857 Search PubMed.
- E. Salomatina, B. Jiang, J. Novak and A. N. Yaroslavsky, Optical properties of normal and cancerous human skin in the visible and near-infrared spectral range, J. Biol. Opt., 2006, 11, 064026 Search PubMed.
- C. Gardner, S. L. Jacques and A. J. Welch, Light transport in tissue: accurate expressions for one-dimensional fluence rate and escape function based upon Monte Carlo simulation, Lasers Surg. Med., 1996, 18, 129–138 Search PubMed.
- A. R. Oseroff, S. Shieh, N. P. Frawley, R. Cheney, L. E. Blumenson, E. K. Pivnick and D. A. Bellnier, Treatment of diffuse basal cell carcinomas and basaloid follicular hamartomas in nevoid basal cell carcinoma syndrome by wide-area 5-aminolevulinic acid photodynamic therapy, Arch. Dermatol., 2005, 141, 60–67.
Footnote |
| † This article is published as part of a themed issue on current topics in photodermatology. |
| This journal is © The Royal Society of Chemistry and Owner Societies 2013 |


