 Open Access Article
On the factors affecting product distribution in laccase-catalyzed oxidation of a lignin model compound vanillyl alcohol: experimental and computational evaluation†
Maarit
Lahtinen
*a,
Petri
Heinonen
a,
Mikko
Oivanen
a,
Pirkko
Karhunen
a,
Kristiina
Kruus
b and
Jussi
Sipilä
a
aLaboratory of Organic Chemistry, Department of Chemistry, University of Helsinki, P.O. Box 55, FIN-00014 HU, Finland. E-mail: maarit.lahtinen@helsinki.fi; Fax: +3589 1915 0366; Tel: +3589 1915 0372
bVTT, Technical Research Centre of Finland, P.O. Box 1000, FIN-02044, VTT, Finland
First published on 27th June 2013
Abstract
Laccases (EC 1.10.3.2) are multicopper oxidases, which can oxidize phenolic substrates by the concomitant reduction of oxygen to water. The phenolic substructures of lignin are also oxidized by laccases, resulting mainly in various polymerized products. Several model compound studies indicate that variations in the reaction media, such as the pH and the enzyme dosage used, have an impact on the observed product distribution of laccase promoted oxidation, but no detailed study has been reported to explain these results. In the present study, a monomeric lignin model compound, vanillyl alcohol, was oxidized in laccase-catalyzed reactions by varying the pH, enzyme dosage and temperature. The energies of all the observed products and potential intermediates were calculated by applying density functional theory (DFT) and the polarizable continuum solvation model (PCM). The observed predominant product at pH 4.5 to 7.5 was clearly the 5-5′ dimer, although the thermodynamic product according to the calculated free energies was vanillin, the difference being 5.6 kcal mol−1. The hydrogen bonding is shown to give an additional stabilizing effect on the transition state leading to the 5-5′ dimer, but also a kinetic barrier reduces the formation of vanillin. Based on the calculated pKa-values of the proposed intermediates we suggest that the rearomatization reactions of the quinones formed in the radical reactions under mildly acidic and neutral conditions would preferentially occur through deprotonation rather than through protonation.
Introduction
Laccases (EC 1.10.3.2) are multicopper oxidases catalyzing the oxidation of various types of substrates using oxygen as a co-substrate. The electrons of the substrates, which include several types of mono- and polyphenols, methoxy- and aminophenols, diamines, aromatic amines and thiols, and some inorganic compounds, are ultimately transferred through the four coppers of the enzyme to reduce the oxygen to water.1,2One of the natural substrates of laccases is lignin, which is the second most abundant biopolymer on earth. Lignin is a complex polymer composed of phenylpropane units, which are coupled through several types of interunit linkages, such as β-O-4, β-5, β–β, 5–5, 5–5/β-O-4 (dibenzodioxocin3), 5-O-4 and β-1.4,5 The most abundant linkage in native lignin is the β-O-4 linkage, with a frequency of 45–60% depending on the source.6 However, when the monolignol coniferyl alcohol is oxidized in vitro to dehydropolymers (DHPs), other linkages, especially the β-5 and β-β linkages are dominating in the product.7 The relative amounts of different linkages in DHPs have been shown to be dependent on several factors: the supply rate of the monomers, the concentration of the monolignol radicals, the pH, the presence of polysaccharides and the presence of the growing DHP polymer.4,7,8 Attempts to understand the biosynthesis of lignin have also produced many theoretical studies comparing the different structures of lignin.9–11 It has been shown that the most frequent linkages, β-O-4, β-5, and β-β, are indeed the thermodynamically favoured structures, but other factors in the lignifying cell wall must also have an essential role.11
Because of the complex chemical structure of lignin, reactions are usually studied with model compounds. Laccases catalyze the oxidation of the phenol to a phenoxy radical, which can either couple to form dimeric to polymeric products, or degrade to phenylpropane units.12–20 According to the present view, however, the degradative pathways are minor reactions in laccase-catalyzed oxidations of lignin, unless a suitable redox mediator, which can transfer electrons from lignin to the laccase, is present.21
It has been shown that laccases follow the outer-sphere mechanism and thus the radical reactions should not be controlled enzymatically.22 The product distributions in laccase-catalyzed oxidations of lignin model compounds and also the degree of polymerization of isolated lignins have been shown to vary according to the pH of the reaction media.13,19,23 In addition, a comparison of separate studies performed using the same model compound has led to the speculation that other factors such as enzyme dosage could have an impact on the product distribution.18 For example, for the laccase-catalyzed oxidation of vanillyl alcohol (1) three variable sets of products have been reported (Fig. 1). Areskogh et al. detected 5-5′ (2) and 5-O-4′ (3) dimers when Trametes villosa and Myceliophthora thermophila laccases were used for oxidation at pH values 5 and 7.5.19 The product distribution was found to vary according to the pH: the 5-5′ product (2) was formed preferably at the more acidic pH. On the other hand, we found 5-5′-coupled dimers (2 and analogous structures) as the main products and vanillin as a minor product (4) with laccases Trametes hirsuta and Melanocarpus albomyces at pH 4.5.18 The 5-5′ dimer (2) was oxidized further to 5-5′ dimers with aldehyde functionalities as well as to dibenzodioxepin-type trimers. In addition, Crestini et al. obtained vanillin (4) and 4,4′-dihydroxy-3,3′-dimethoxybenzophenone (5) when Trametes versicolor laccase was used to catalyze the oxidation at pH 5.24
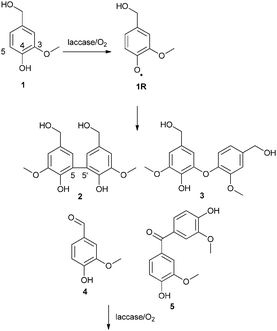 | ||
| Fig. 1 Previously found products from the laccase-catalyzed oxidation of vanillyl alcohol.18,19,24 | ||
The present study aimed at evaluating the combined effect of the pH, enzyme dosage and temperature on the product distribution of laccase-catalyzed oxidation of vanillyl alcohol (1). The thermostable M. albomyces laccase was used; this enzyme has a wide pH-optimum range with guaiacol (5–7.5),25 which has a similar structure (methoxyphenol) compared to vanillyl alcohol. The products were quantified with HPLC using authentic compounds as an external reference. In order to understand the effect on product distribution, the thermodynamics of the reactions was evaluated in detail by using computational methods. Taking into account all the relevant intermediates of the reactions the energies were obtained at the DFT((U)B3LYP)/6-311++G(2df,2p) level of theory from the geometries obtained at the DFT((U)B3LYP)/6-31+G(d) level.
Results and discussion
Laccase catalyzes the oxidation of a phenolic compound to a phenoxy radical, which then reacts further in non-enzymatic reactions.1 Based on earlier studies18,19,24 performed with vanillyl alcohol (1) it was assumed that three different products could be formed initially from two phenoxy radicals of vanillyl alcohol (1): 5-5′ dimer (2), 5-O-4′ dimer (3) and vanillin (4). The tentative reaction pathways for the formation of each product are depicted in Fig. 2 and 3. It is generally accepted that coupling of two phenoxy radicals leads to the formation of a quinone, which is rearomatized to the final product. However, the mechanisms of the rearomatization and oxidation of the hydroxymethyl side chain of phenols have not yet been verified.26 We decided to study all reaction pathways by comparing the observed product distributions with the calculated thermodynamic parameters of the ionic structures that may be proposed to be involved. The reaction pathways considered are shown in Fig. 2 and 3 through tentative formal ionic intermediates. Free energies and pKa-values were calculated for each ion and final product. It is clear that all of these formal ions do not represent actual accumulating intermediates as such. Nevertheless, the calculated pKa-values of these limiting structures allow us to draw conclusions on the predominant ionic forms under the reaction conditions, which is an essential factor for deducing the possible mechanisms. Furthermore, the state of equilibrium may be estimated over the sequential ions. Thus, the data are valuable for the discussion of the factors steering the competition between the pathways.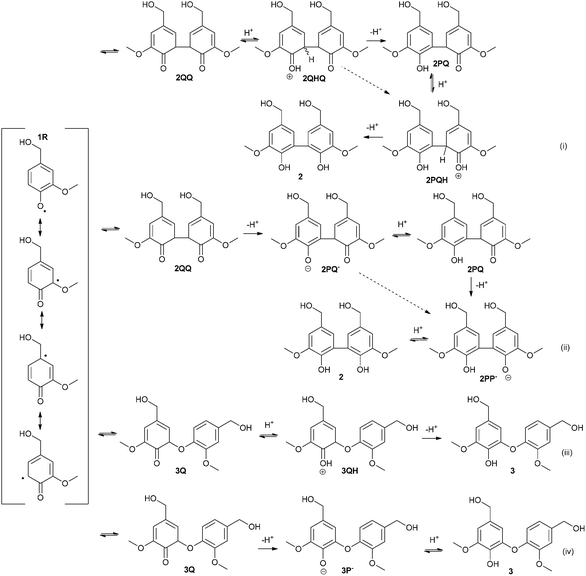 | ||
| Fig. 2 Tentative mechanisms for the formation of 5-5′ (2) and 5-O-4′ (3) dimers. | ||
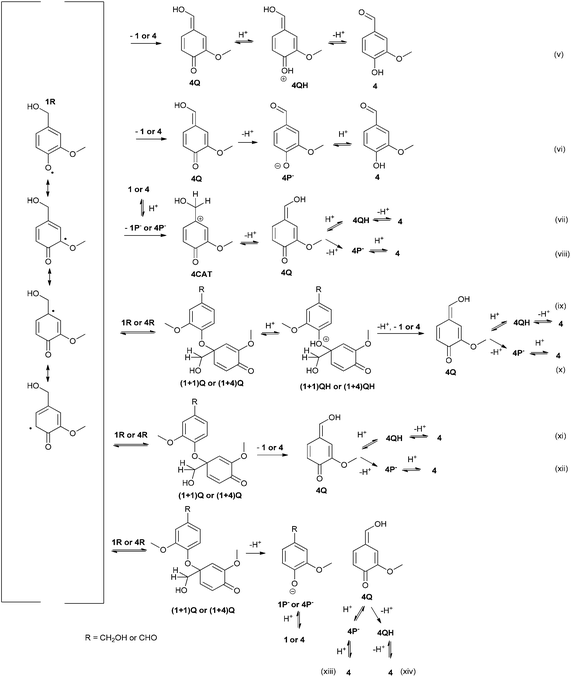 | ||
| Fig. 3 Tentative mechanisms for the formation of vanillin (4) by several possible reaction routes. | ||
Three different mechanisms were considered for the formation of vanillin (4, Fig. 3). The mechanisms for the oxidation of the hydroxymethyl side chain of phenols have not yet been verified.26 Firstly, it has been shown that phenolic mediators (ArOH) or mediators containing a hydroxylamine (–NOH) group act through transferring a hydrogen atom from the benzylic position of a non-phenolic substrate.26,27 Secondly, laccase-catalyzed reaction of a syringylic β-1 model compound in the presence of H218O has been shown to produce degradation products containing the 18O, which has been explained by a cationic intermediate.15 It was also recently shown that with phenolic syringyl-type mediators C–O coupled products can be detected, especially in the early stages of laccase-catalyzed reactions.28 The mechanism through the 1-O-4′ intermediate has been also suggested earlier by Kirk et al.12 Although the 1-O-4′ dimer has not been detected in the oxidation of vanillyl alcohol (1), the structure has been identified from the oligomeric products of 1 and vanillic acid.13,19 Thus, mechanisms for the formation of vanillin (4) were proposed based (1) on hydrogen atom transfer from the benzylic position by a phenoxy radical, (2) on the formation of a quinonoid 1-O-4′ dimer, which could then be degraded to vanillin (4) and the phenol and (3) on a disproportionation leading to a cation, which could deprotonate to form vanillin.
Yields of different products from laccase-catalyzed oxidation of vanillyl alcohol in varying reaction conditions
The assumption that at the initial stages of oxidation catalyzed by laccase only products 2–4 would form was seemingly correct: these products were the only ones detected in all experiments after the 2 hour reaction time. The yields of oxidation products and unreacted vanillyl alcohol are shown in Table 1. The highest dosage of 50 nkat ml−1 was applied only in one experiment, because the product distribution was very similar compared to 10 nkat ml−1 dosage at higher temperatures. In other words, the increase of temperature had a similar effect as the increase of enzyme dosage on product formation.| Dosage (nkat ml−1) | t (°C) | pH | Yields of compounds 1–4 (%) | ||||
|---|---|---|---|---|---|---|---|
| 1 | 2 | 3 | 4 | Total | |||
| 1 | rt | 4.5 | 89.5 | 7.7 | — | — | 97.2 |
| 1 | rt | 5.0 | 95.1 | 8.9 | — | — | 104.0 |
| 1 | rt | 6.0 | 92.0 | 9.4 | — | — | 101.4 |
| 1 | rt | 7.0 | 98.6 | 8.6 | — | — | 107.2 |
| 1 | rt | 7.5 | 96.4 | 4.0 | — | 1.7 | 102.1 |
| 1 | 45 | 4.5 | 97.7 | 9.1 | — | — | 106.8 |
| 1 | 45 | 5.0 | 87.0 | 8.3 | — | — | 95.3 |
| 1 | 45 | 6.0 | 96.5 | 6.9 | — | — | 103.4 |
| 1 | 45 | 7.0 | 95.2 | 6.7 | — | — | 101.9 |
| 1 | 45 | 7.5 | 97.9 | 2.2 | — | — | 100.1 |
| 10 | rt | 4.5 | 73.3 | 24.5 | — | 0.5 | 98.3 |
| 10 | rt | 5.0 | 83.8 | 17.6 | — | — | 101.4 |
| 10 | rt | 6.0 | 71.2 | 15.4 | 1.7 | 0.6 | 88.9 |
| 10 | rt | 7.0 | 69.5 | 15.5 | 2.0 | 0.7 | 91.0 |
| 10 | rt | 7.5 | 74.7 | 15.7 | — | 0.6 | 91.0 |
| 10 | 45 | 4.5 | 60.3 | 33.7 | 2.1 | 0.8 | 96.9 |
| 10 | 45 | 5.0 | 61.0 | 33.9 | 2.1 | 0.6 | 97.6 |
| 10 | 45 | 6.0 | 67.8 | 17.6 | 1.5 | 0.8 | 87.7 |
| 10 | 45 | 7.0 | 68.7 | 17.3 | 1.6 | 0.5 | 88.1 |
| 10 | 45 | 7.5 | 71.9 | 15.5 | — | 0.6 | 88.0 |
| 50 | rt | 4.5 | 57.2 | 31.6 | 2.1 | 1.0 | 91.9 |
At the lowest enzyme dosage applied, only the 5-5′ product 2 was formed, except in one experiment (pH 7.5, at room temperature). The 5-O-4′ product 3 and vanillin (4) were observed as minor products at the higher enzyme dosages.
With the lowest enzyme dosage applied at room temperature, the optimum pH range for the formation of 5-5′ product 2 was 5–7, which is similar compared to guaiacol (5–7.5).25 Under all other conditions, the highest amount of 5-5′ product 2 was formed at the lowest pH 4.5, and the yield was decreased with increasing pH (Fig. 4). Similarly, the total amount of oxidation products decreased with increasing pH. This result is in accordance with the earlier report on the decreasing activity of laccases as the pH increases.29
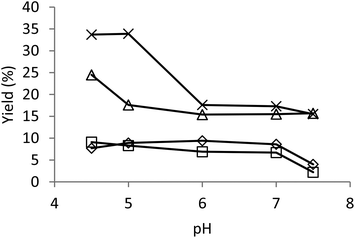 | ||
| Fig. 4 Yield of the 5-5′ dimer as a function of pH under varying reaction conditions. Diamond: enzyme dosage 1 nkat ml−1, room temperature (rt); square: 1 nkat ml−1, 45 °C; triangle: 10 nkat ml−1, rt; multiplication symbol: 10 nkat ml−1, 45 °C. | ||
The limits of the applied quantitative HPLC prevented a very accurate evaluation of the amounts of 5-O-4′ dimer (3) and vanillin (4). These were formed at pH ≥ 6.0 at room temperature, and at higher temperature they were formed over the pH-range studied. The absence of 5-O-4′ product 3 at pH 7.5 may be an indication of lability of this compound under the more basic conditions, although no degradation products were detected. The slight loss of recovered material at higher enzyme dosages, which were required for the formation of products 3 and 4, could also be due to increased coupling of free radicals with the aromatic amino acids of laccase,30 as no other products formed from vanillyl alcohol (trimers etc.) were detected.
Concluding the results of product distribution, the amount of 5-5′ product 2 and total yield of the oxidation products decreased as the pH increased. As a consequence, the relative amounts of 5-O-4′ (3) and vanillin (4) increased with increasing pH and enzyme dosage. At higher pH-values the ratio of the products was possibly distorted because of the decrease of the total amount of all compounds and the possible lability of the 5-O-4′ compound (3).
Total spin densities of vanillyl alcohol's phenoxy radical compared to the observed product distribution
The rate-determining step in the laccase-catalyzed oxidation of a phenol is the removal of the electron to form a phenoxy radical cation, which is then rapidly deprotonated.31 The spin densities of the phenoxy radical formed from vanillyl alcohol (1R) were calculated (Fig. 5) and compared with the observed product distribution. The values were similar compared to those calculated previously.24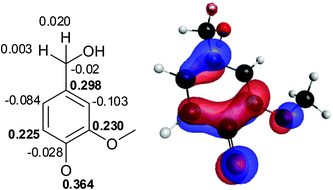 | ||
| Fig. 5 Total spin densities for the phenoxy radical of vanillyl alcohol (1R). | ||
The O4 of phenoxy radical 1R had the highest spin density, followed by C1, C3 and C5. The spin density of the benzylic position was very low. Thus, based on spin densities, coupling through O4 would be most probable, but the observed product distribution showed that coupling through C5 was more favourable. It is noteworthy that the spin density of C5 was lower than that of C1 and C3, which were occupied by hydroxymethyl and methoxyl groups. High spin densities have been previously calculated also for the substituted sites of monolignols (p-coumaryl, coniferyl and sinapyl alcohols), and it was postulated that reaction through an occupied site would be unfavourable due to steric hindrance.11
Whereas the radical coupling involves bond formation between two atoms bearing a high spin density, the spin density of the H-atom abstractor is transferred to the H-atom donor.32 These two different processes, radical coupling and H-atom abstraction most probably have different energy barriers, which might affect the product distribution through different reaction kinetics. Clearly, the calculated spin densities could not explain the observed product distribution.
Comparison of energy changes
The energies for each product and intermediate were determined using the DFT((U)B3LYP)/6-311++G(2df,2p) level of theory and the solvent effects were taken into account applying the polarizable continuum solvation model (PCM). The geometries were optimized by DFT((U)B3LYP)/6-31+G(d) calculations which also provided the zero point energies and the thermodynamic corrections for gas phase energies. All optimized geometries were proven to be real minima having no imaginary frequencies. The changes in reaction energies were calculated for rearomatization of the quinonoid intermediates through deprotonation and protonation. The energy changes based on the PCM model correlated better with the observed experimental results and thus these results are presented below. The gas-phase energy changes can be found from the ESI.† Although one can argue that DFT energies are not accurate to more than approximately a few kcal, it is generally supposed that inaccuracies cancel and the reaction energies reflect reality well.Free energy changes of different initial radical couplings
At the first stage after radical formation three competing pathways may be considered. Two radicals could couple to form different quinones (5-5′, 5-O-4′ or 1-O-4′), one radical could abstract a hydrogen from the benzylic position of the other, or the two radicals could disproportionate to form a cation and a phenolate anion. The formation of 5-5′ quinone (2QQ) may lead to the formation of two stereocenters, resulting in three stereoisomers: a pair of enantiomers (RR and SS) and a meso form.The relative free energy for the formation of quinone 4Q through H-atom transfer (routes v and vi), leading to the formation of vanillin, was clearly the most favourable (Table 2). On the other hand, disproportionation to an anion and a cation was not favourable, showing a positive ΔG-value.
| Reaction | ΔG (kcal mol−1) |
|---|---|
| 1R + 1R → 2QQ (RR, SS) | −2.2 |
| 1R + 1R → 2QQ (meso) | −2.6 |
| 1R + 1R → 3Q | −3.8 |
| 1R + 1R → 4Q (v, vi) | −28.8 |
| 1R + 4R → 4Q (v, vi) | −33.3 |
| 1R + 1R → (1 + 1)Q | −7.0 |
| 1R + 4R → (1 + 4)Q | −10.7 |
| 1R + 1R → 4CAT + 1P−− | 32.8 |
| 1R + 4R → 4CAT + 4P−− | 21.8 |
The ΔG difference between the two dimers (2QQ and 3Q) was small. The calculated ΔG-values for the formation of 2QQ and 3Q from two radicals were slightly negative and in the same range as the calculated free energies for the coupling of monolignol p-coumaryl alcohol to 5-5′ and 5-O-4′ products.11 Thus, the relative free energies at this stage could not explain the observed dominance of product 2.
Transition states for the quinone intermediates and H-atom transfer
Computations of the transition states for radical–radical coupling as well as for H-atom abstraction between two radicals were attempted using 4-hydroxymethylphenoxy radical (6R) as a model (i.e. phenoxy radical of vanillyl alcohol without the methoxyl group). The transition states of radical–radical coupling reactions proved to be beyond reach with DFT methods, but this type of reaction for monolignols is reported to have only a small energy barrier of approximately 2–5 kcal mol−1.9Although the transition states for radical–radical coupling were not resolved, it was found that the transition state leading to the formation of 5-5′ quinone 2QQ was clearly stabilized by the hydrogen bonding between the two hydroxymethyl groups of the forming quinone (Fig. 6).
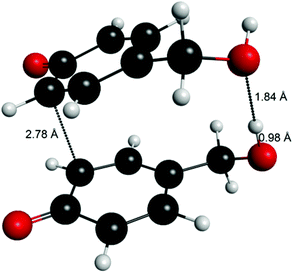 | ||
| Fig. 6 An attempt to compute the transition state for the formation of 5-5′ quinone (6QQ) using 4-hydroxymethyl (6) as the model, revealing the stabilizing hydrogen bond between the hydroxymethyl groups. | ||
An estimate of the transition state energy for the hydrogen atom abstraction from the benzylic position could be obtained by using 4-hydroxymethylphenol (6) as the H-atom donor instead of the radical (Fig. 7). The bond distances were 1.25 Å for the O–H and 1.32 Å for the forming C–H. The energy barrier for the reaction was found to be 18 kcal mol−1. Assuming that the formation of a biradical would not be significantly more favourable than the formation of benzyl radical at the transition state, this value (18 kcal mol−1) shows that the energy barrier of H-atom abstraction is clearly higher compared to the 2–5 kcal mol−1 for the radical coupling. This partly explains the differences between the experimental data and the calculated energies for product formation. A higher energy barrier compared to the radical coupling through an unoccupied site (C5) could also be involved in the formation of vanillin (4) through the 1-O-4′ dimer due to steric hindrance.
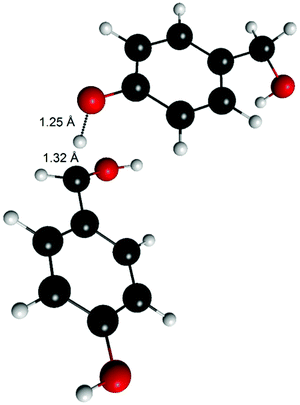 | ||
| Fig. 7 Transition state of the H-atom transfer from 4-hydroxymethylphenol (6) to 4-hydroxymethylphenoxy radical (6R). | ||
Rearomatization of quinones
The overall free energy change for rearomatization was favourable by 16–22 kcal mol−1 (Table 3). When the rearomatization was split into two steps, aromatization and protonation, it was found that aromatization and following protonation of the phenolate anions decreased free energies, but protonation of the quinones increased free energies. These energy changes are visualized in Fig. 8, showing the relative energies of all proposed intermediates involved in the formation of dehydrodivanillyl alcohol (2). A noteworthy difference between the pathways through deprotonation and protonation is that in deprotonation the free energy is decreased at all intermediate stages, whereas protonation results in an increase of energy.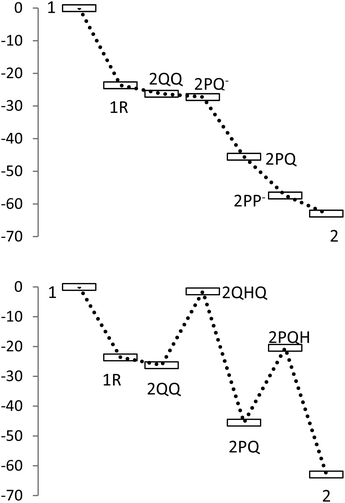 | ||
| Fig. 8 Relative changes of free energies of different intermediates for the formation of 5-5′ dimer (2) from vanillyl alcohol (1). Top: rearomatization through deprotonation; bottom: rearomatization through protonation. | ||
| Aromatization through protonation | |||||
|---|---|---|---|---|---|
| Protonation | Aromatization | Overall aromatization | |||
| Product | ΔG | Product | ΔG | Reaction | ΔG |
| 2QHQ m | 24.7 | 2PQ | −44.0 | 2QQ → 2PQ | −19.3 |
| 2QHQ e | 26.2 | 2PQ | −45.8 | 2QQ → 2PQ | −19.6 |
| 2PQH | 25.0 | 2 | −42.4 | 2PQ → 2 | −17.4 |
| 3QH | 27.2 | 3 | −48.7 | 3Q → 3 | −21.5 |
| 4QH | 13.0 | 4 | −29.1 | 4Q → 4 | −16.1 |
| Aromatization through deprotonation | |||||
|---|---|---|---|---|---|
| Aromatization | Protonation | Overall aromatization | |||
| Product | ΔG | Product | ΔG | Reaction | ΔG |
| 2PQ−− m | −0.9 | 2PQ | −18.3 | 2QQ → 2PQ | −19.4 |
| 2PQ−− e | −1.3 | 2PQ | −18.3 | 2QQ → 2PQ | −19.6 |
| 2PP−− | −11.8 | 2 | −5.6 | 2PQ → 2 | −17.4 |
| 3P−− | −7.8 | 3 | −13.7 | 3Q → 3 | −21.5 |
| 4P−− | −7.2 | 4 | −8.9 | 4Q → 4 | −16.1 |
Comparison of the free energy changes between the final products 2–4
The changes in the free energies calculated for the formation of the observed products from 1 are compared in Table 4. The thermodynamically most favoured product was vanillin (4). In comparison to the reaction energy leading to vanillin (4) the changes in the free energies were 5.6 kcal mol−1 and 19.6 kcal mol−1 less negative for the 5-5′ (2) and 5-O-4′ (3) dimers.| Reaction product | Reaction ΔG (kcal mol−1) | Relative ΔG (kcal mol−1) |
|---|---|---|
| 2 | −62.9 | 5.6 |
| 3 | −48.9 | 19.6 |
| 4 | −68.6 | 0.0 |
The 5-O-4′ (3) was clearly the least favourable product, by 14.0 kcal mol−1 compared to 5-5′ (2). Also, under experimental conditions, 3 was formed only when higher enzyme dosages were used. Thus, the computational results were in agreement with the experimental results when the two products formed through radical coupling were compared. On the other hand, this effect is parallel with the effect of hydrogen bonding found in the formation of 5-5′ dimer (2) providing an additional stabilization for the transition state.
Vanillin (4) was not produced in a detectable amount at the lowest enzyme dosage at room temperature. However, according to the calculated free energies, the amount of vanillin (4) should have been much higher compared to the amount of 5-O-4′ (3), if thermodynamic control was followed. In fact, the observed amount of vanillin (4) was close to that of the 5-O-4′ dimer (3). For comparison, vanillin (4) was also totally absent in the product mixture obtained by Areskogh et al.19 A possible explanation is that the additional steering effect of the hydrogen bonds at the transition state leading to the formation of 5-5′ dimer (2QQ) may enhance the formation of 2. A kinetic barrier for the H-atom abstraction or 1-O-4′ dimer formation, whichever route is followed, may have an effect in the same direction. An additional proof for the kinetic barrier is that when the product formation was, in a previous study, monitored as a function of time under mild reaction conditions (i.e. low enzyme dosage and room temperature) at pH 4.5, vanillin (4) was clearly observed at a later time than the 5-5′ dimer (2).18
Calculated pKa-values for the products and quinone intermediates
The total amount of products decreased with increasing pH (Table 1), reflecting the decreasing activity of laccases with increasing pH.29 In addition, however, the observed ratio of different products also seemed to be affected by the pH as the amount of the 5-5′ dimer (2) decreased more relative to the other products. To further investigate the effect of pH, pKa's were calculated for the products and intermediates (Table 5). The applied method is known to cause a systematic error.33 The systematic error for the calculations was corrected based on the experimental literature values of methoxyphenols.34 The systematic error for the intermediates might have differed from the one for methoxyphenols, as it did for the phenol,35 and thus the values can be over- or underestimated. However, for example, the experimentally determined value for the pKa-value of the protonated quinone methide of Mitomycin C is −1.2, and the calculated values were in a similar range.36The calculated pKa-values for protonated quinones revealed that they are highly acidic. Thus, in the applied pH range, starting from pH 4.5, the quinones are not protonated. The calculated pKa-values for the quinones 3Q and 4Q were below the applied pH-range (3.40 and 3.56), which suggests that the phenolate anion forms are dominating in all experiments. However, the calculated pKa-values for the 5-5′ quinone (2QQ) stereoisomers were 5.08 (RR, SS) and 5.17 (meso). Thus, the equilibrium of the 2QQ and its anion could change in the applied pH-range and the phenolate form would start to dominate above pH 5. Likely, the anion could be thought to rearomatize through the deprotonation pathway, rather than through two protonation steps. Although the rearomatization of quinones is usually depicted as taking place through protonation, because of the acidic environment, our results suggest that the pathway through deprotonation could be more likely, also considering the decreasing energy at different stages of the reaction (Fig. 8). Of course, the rates of proton transfer are fast, and thus protonation of the neutral quinone form could also be possible. The high acidities of protonated quinones could also explain the formation of 4,4′-dihydroxy-3,3′-dimethoxybenzophenone (5) that was detected by Crestini et al.24 The work-up of the oxidation products before analysis with the strong acid HCl could enable the formation of the benzophenone.
As the kinetic barrier for the radical coupling leading to the two dimers, 5-5′ (2) and 5-O-4′ (3) is very low and the reaction could be reversible, the acid–base equilibrium of the quinone intermediates or kinetic barriers of the proton-transfer steps could affect the product distribution. Incubation of the 5-5′ dimer (2) in D2O–d6-DMSO at 45 °C did not result in the formation of the other two products, and thus there seemed to be no thermodynamic equilibrium between the different quinone forms. The kinetic barrier for the C–H bond cleavage was found to be only 5.6 kcal mol−1, calculated from the transition state of internal proton transfer from 2PQ−− to 2PP−−, which excluded also the possibility that kinetic barriers at the proton transfer stages could affect the product distribution. Thus, the proton transfer reactions seemed not to be able to explain the different product ratios at different pH-values.
As the rate-limiting step of a laccase-catalyzed reaction is the oxidation of the substrate,37 the decreasing yield of the 5-5′ product (2) could mainly be due to the decreasing activity of laccase as a function of increasing pH. However, neither the decreasing laccase activity nor the thermodynamics or kinetics of the rearomatization reactions can explain the observed decreasing amount of 5-5′ dimer relative to the other products as the pH increased. Thus, there must be some other factors that are affected by the pH, but without the ability to distinguish the radical reactions from the proton-transfer reactions, experimental evidence of any such factor is impossible to gain. It has been shown that laccases do not control the radical reactions, and also pH has been shown to affect the product distribution in Ag2O-oxidation of coniferyl alcohol.22,38 If the oxidant does not affect the product ratio as a function of pH or the rearomatization reactions cannot explain the observed product distribution, the radical reactions could be affected by the pH. Possibly, the changes in the reaction environment affect the orientation of the reacting radicals as they diffuse away from the oxidant or the hydrogen bonding in the transition states is altered as the pH changes.
Conclusions
By a comparison of the observed product distributions of the laccase-catalyzed oxidation of vanillyl alcohol and the results obtained by using computational methods, it seemed that the observed product distribution could be explained to some extent. The observed relative product amounts correlated with the computational free energy changes when the two products formed through radical coupling were compared. Vanillin, which is formed through a different route, should have been the most favourable product, in contrast to the observed amount. Although the energies of the biradical transition states could not be computed using DFT, the stabilizing hydrogen bonding leading to the 5-5′ dimer and also the kinetic barrier for the formation of vanillin were evident.It was also clear that the amounts of different products as a function of pH were mainly affected by the rate-limiting oxidation of the substrate by laccase, as the enzyme activity decreases with increasing pH. However, the observed change in the product ratio as a function of pH was not evidently explained by the computed thermodynamics of the rearomatization reactions. It is possible that at different pH-values either the geometry of the reacting radicals or hydrogen bonding is affected. Although the computed pKa-values could not explain the product ratios, it seemed likely that rearomatization proceeds through deprotonation rather than through protonation under the applied pH-range of 4.5–7.5.
According to these results, the differences in the reaction media, which may affect the solubility of the substrate and preferences of laccases, have also a significant effect on the formed products because of the intrinsic chemical properties of lignin substructures. Possibly, modification of lignin by laccases under varying reaction conditions could also result in different chemical properties of the formed products.
Experimental
Reagents, equipment and analysis
All reagents and solvents were used as received unless otherwise mentioned. A Varian Mercury 300 MHz spectrometer was used for NMR measurements, which were performed at 27 °C in CDCl3. For the high-resolution mass spectra (HR-ESI-MS) the Bruker Daltonics microTOF ESI-TOF was used; acetonitrile–water was used as the solvent and Agilent ES TuningMix (G2421A) diluted in acetonitrile–water was used for the calibration.HPLC was performed using a reverse-phase column (Agilent ZORBAX Eclipse XDB-C8, 4.6 mm × 15 cm, 5 μm), methanol–water as the eluent and an Agilent 1200 series HPLC. Gradient elution was applied for 5 minutes starting from 35% methanol (v/v); the flow rate was 0.3 ml min−1. The unreacted vanillyl alcohol and the oxidation products were quantified from the samples using external calibration. For the external calibration, a linear three-point calibration curve was produced for each compound using the software of the HPLC (Agilent ChemStation). All authentic compounds were found to be stable during the HPLC runs. The results of the quantitative analysis of the starting material and products are shown in Table 1.
Enzyme and determination of enzyme activity
The M. albomyces laccase was overproduced in Trichoderma reesei and purified as described earlier.39Laccase activity was determined using ABTS [2,2′-azino-bis-(3-ethylbenzothiazoline)-6-sulphonate] (Sigma) as a substrate in 25 mM Na-succinate buffer, pH 4.5, at 22 °C.40 Absorbance of the oxidation product was measured at 436 nm (ε = 29 300 M−1 cm−1). The activity was determined from the slope of the linear curve and expressed as katals.
Synthesis of vanillyl alcohol and reference compounds
Vanillin (4) was purchased from Fluka. Vanillyl alcohol (1) was reduced from vanillin with NaBH4 (Fluka) in ethanol and 5-5′ dimer (2) was synthesized according to the method reported by Adler and Hernestam.41Reaction procedure for the oxidation of vanillyl alcohol by laccase and preparation of HPLC samples
The variables in the reaction conditions were enzyme dosage, temperature and pH. The used enzyme dosages were 1, 10 and 50 nkat ml−1 based on activity determination with ABTS, and the last mentioned dosage of 50 nkat ml−1 was used in only one experiment. Reactions were carried out at room temperature (rt) and 45 °C. Reactions were performed using 5 different buffers: 25 mM Na-succinate, pH 4.5; 25 mM Na-acetate, pH 5.0; 25 mM Na-citrate, pH 6.0; 25 mM Na-citrate, pH 7.0; McIlvaine buffer, pH 7.5 (0.2 M Na2HPO4 and 0.1 M citric acid).Vanillyl alcohol (1) (20 mg, 1.3 mmol) was dissolved in dioxane (0.2 ml, distilled over sodium). Buffer was added, followed by a suitable dilution of the enzyme, to a total volume of 0.8 ml of buffer and enzyme dilution. The mixture was stirred for 2 h, and a 20 μl sample was taken to a vial containing NaN3 (to inhibit laccase,18 Riedel-de Haën), water and methanol. The volume of the final sample was 2 ml and it contained 2.5 mM of NaN3 in methanol–water (1![[thin space (1/6-em)]](https://www.rsc.org/images/entities/char_2009.gif) :
:![[thin space (1/6-em)]](https://www.rsc.org/images/entities/char_2009.gif) 1). The samples were filtrated prior to analysis using a syringe filter (0.45 μm).
1). The samples were filtrated prior to analysis using a syringe filter (0.45 μm).
Computational methods
A conformational analysis of all studied structures was done at PM3 semiempirical level using in house made perl script and GAMESS ab initio program to scan systematically conformers. The best conformers were optimized with the DFT B3LYP method using 6-31+G(d) basis set and unrestricted wave function in the case of radical species. Optimized geometries were proven to be real minima by evaluating vibrational analysis in the same level of theory, the calculation providing also the thermodynamic corrections which were used without scaling. The single point energies were calculated at the DFT B3LYP level using a larger 6-311++G(2df,2p) basis set. Energies in the solvent (water) were obtained using the PCM continuum solvation model with 6-311++G(2df,2p) basis set and gas phase geometries. All calculations were done with GAMESS ab initio program.To calculate the free energy change of protonation in a reaction, the computed energy change for deprotonation of a phenol was used, from which the experimental value was subtracted from (ΔGcomp − ΔGexp). The experimental values used were (at 298.15 K) 344.5 kcal mol−1 for the gas phase43 and 13.62 kcal mol−1 in water (calculated from the pKa of phenol, 9.99).35
The pKa-values were calculated using the total free energies in water from PCM calculations using a formula modified from Yu et al.:33
Acknowledgements
The Finnish Bioeconomy Cluster (FIBIC) is gratefully acknowledged for financial support.Notes and references
- C. F. Thurston, Microbiology, 1994, 140, 19 CrossRef CAS.
- E. I. Solomon, U. M. Sundaram and T. E. Machonkin, Chem. Rev., 1996, 96, 2563–2606 CrossRef CAS; G. Palmieri, P. Giardina, C. Bianco, A. Scaloni, A. Capasso and G. Sannia, J. Biol. Chem., 1997, 272, 31301 CrossRef; U. N. Dwivedi, P. Singh, V. P. Pandey and A. Kumar, J. Mol. Catal. B: Enzym., 2011, 68, 117 CrossRef.
- P. Karhunen, P. Rummakko, J. Sipilä, I. Kilpeläinen and G. Brunow, Tetrahedron Lett., 1995, 36, 4501 CrossRef CAS.
- J. Ralph, G. Brunow and W. Boerjan, in Encyclopedia of Life Sciences, John Wiley & Sons Ltd, Chichester, 2007, pp. 1–10, http://els.net/[doi: 10.1002/9780470015902.a0020104] Search PubMed.
- R. Vanholme, B. Demedts, K. Morreel, J. Ralph and W. Boerjan, Plant Physiol., 2010, 153, 895 CrossRef CAS.
- E. Sjöström, Wood Chemistry: Fundamentals and Applications, Academic Press, Inc., Orlando, Florida, 1981 Search PubMed; D. S. Argyropoulos and S. B. Menachem, in Advances in Biochemical Engineering/Biotechnology, ed. K.-E. Eriksson, Springer-Verlag, Berlin, Heidelberg, 1997, vol. 57, pp. 127–158 Search PubMed.
- J. Ralph, K. Lundquist, G. Brunow, F. Lu, H. Kim, P. F. Schatz, J. M. Marita, R. D. Hatfield, S. A. Ralph, J. H. Christensen and W. Boerjan, Phytochem. Rev., 2004, 3, 29 CrossRef CAS.
- E. Ämmälahti and G. Brunow, Holzforschung, 2000, 54, 604 CrossRef.
- B. Durbeej and L. A. Eriksson, Holzforschung, 2003, 57, 466 CAS.
- B. Durbeej, Y.-N. Wang and L. A. Eriksson, Lect. Notes Comput. Sci., 2003, 2565, 137 CrossRef CAS; B. Durbeej and L. A. Eriksson, Holzforschung, 2003, 57, 150 Search PubMed.
- A. K. Sangha, J. M. Parks, R. F. Standaert, A. Ziebell, M. Davis and J. C. Smith, J. Phys. Chem. B, 2012, 116, 4760 CrossRef CAS.
- T. K. Kirk, J. M. Harkin and E. B. Cowling, Biochim. Biophys. Acta, Gen. Subj., 1968, 165, 145 CrossRef CAS.
- A. Leonowicz, R. Edgehill and J. M. Bollag, Arch. Microbiol., 1984, 137, 89 CrossRef CAS.
- S. Kawai, T. Umezawa, M. Shimada, T. Higuchi, K. Koide, T. Nishida, N. Morohoshi and T. Haraguchi, Mokuzai Gakkaishi, 1987, 33, 792 CAS.
- S. Kawai, T. Umezawa and T. Higuchi, Arch. Biochem. Biophys., 1988, 262, 99 CrossRef CAS.
- S. Kawai, T. Higuchi, K. Nabeta and H. Okuyama, in Biotechnology in Pulp and Paper Manufacture, ed. T. K. Kirk and H.-M. Chang, Butterworth-Heinemann, USA, 1990, pp. 359–365 Search PubMed.
- K. Rittstieg, A. Suurnakki, T. Suortti, K. Kruus, G. Guebitz and J. Buchert, Enzyme Microb. Technol., 2002, 31, 403 CrossRef CAS; A. Marjasvaara, M. Torvinen, H. Kinnunen and P. Vainiotalo, Biomacromolecules, 2006, 7, 1604 CrossRef.
- M. Lahtinen, K. Kruus, P. Heinonen and J. Sipilä, J. Agric. Food Chem., 2009, 57, 8357 CrossRef CAS.
- D. Areskogh, J. Li, P. Nousiainen, G. Gellerstedt, J. Sipilä and G. Henriksson, Holzforschung, 2010, 64, 21 CrossRef CAS.
- M.-L. Mattinen, P. Maijala, P. Nousiainen, A. Smeds, J. Kontro, J. Sipilä, T. Tamminen, S. Willför and L. Viikari, J. Mol. Catal. B: Enzym., 2011, 72, 122 CrossRef CAS; P. Maijala, M.-L. Mattinen, P. Nousiainen, J. Kontro, J. Asikkala, J. Sipilä and L. Viikari, J. Mol. Catal. B: Enzym., 2012, 76, 59 CrossRef.
- O. V. Morozova, G. P. Shumakovich, S. V. Shleev and Y. I. Yaropolov, Appl. Biochem. Microbiol., 2007, 43, 523 CrossRef CAS; A. P. Virk, P. Sharma and N. Capalash, Biotechnol. Prog., 2012, 28, 21 CrossRef.
- F. Xu, Biochemistry, 1996, 35, 7608 CrossRef CAS.
- D. Areskogh, J. Li, G. Gellerstedt and G. Henriksson, Biomacromolecules, 2010, 11, 904 CrossRef CAS; D. van de Pas, A. Hickson, L. Donaldson, G. Lloyd-Jones, T. Tamminen, A. Fernyhough and M.-L. Mattinen, Bioresources, 2011, 6, 1105 Search PubMed; R. Moya, P. Saastamoinen, M. Hernández, A. Suurnäkki, E. Arias and M.-L. Mattinen, Bioresour. Technol., 2011, 102, 10006 CrossRef.
- C. Crestini, L. Jurasek and D. S. Argyropoulos, Chem.–Eur. J., 2003, 9, 5371 CrossRef CAS.
- L.-L. Kiiskinen, L. Viikari and K. Kruus, Appl. Microbiol. Biotechnol., 2002, 59, 198 CrossRef CAS.
- F. d'Acunzo, C. Galli, P. Gentili and F. Sergi, New J. Chem., 2006, 30, 583 RSC.
- A. Calcaterra, C. Galli and P. Gentili, J. Mol. Catal. B: Enzym., 2008, 51, 118 CrossRef CAS.
- T. Rosado, P. Bernardo, K. Koci, A. V. Coelho, M. P. Robalo and L. O. Martins, Bioresour. Technol., 2012, 124, 371 CrossRef CAS.
- F. Xu, J. Biol. Chem., 1997, 272, 924 CrossRef CAS.
- K. Li, F. Xu and K. L. Eriksson, Appl. Environ. Microbiol., 1999, 65, 2654 CAS.
- M. A. Tadesse, A. D'Annibale, C. Galli, P. Gentili and F. Sergi, Org. Biomol. Chem., 2008, 6, 868 CAS.
- Y.-M. Sun and C.-B. Liu, Eur. J. Org. Chem., 2004, 120 CrossRef CAS; N. Dietl, M. Schlangen and H. Schwarz, Angew. Chem., Int. Ed., 2012, 51, 5544 CrossRef.
- A. Yu, Y. Liu, Z. Li and J.-P. Cheng, J. Phys. Chem. A, 2007, 111, 9978 CrossRef CAS.
- M. Ragnar, C. T. Lindgren and N.-O. Nilvebrant, J. Wood Chem. Technol., 2000, 20, 277 CrossRef CAS.
- CRC Handbook of Chemistry and Physics, ed. W. M. Haynes, CRC Press/Taylor and Francis, Boca Raton, FL, 93rd edn (Internet version, 2013) Search PubMed.
- R. Boruah and E. Skibo, J. Org. Chem., 1995, 60, 2232 CrossRef CAS.
- F. Xu, J. J. Kulys, K. Duke, K. Li, K. Krikstopaitis, H.-J. W. Deussen, E. Abbate, V. Galinyte and P. Scheider, Appl. Environ. Microbiol., 2000, 66, 2052 CrossRef CAS.
- S. Quideau and J. Ralph, Holzforschung, 1994, 48, 12 CrossRef CAS.
- L.-L. Kiiskinen, K. Kruus, M. Bailey, E. Ylösmäki, M. Siika-Aho and M. Saloheimo, Microbiology, 2004, 150, 3065 CrossRef CAS.
- M. L. Niku-Paavola, E. Karhunen, P. Salola and V. Raunio, Biochem. J., 1988, 254, 877 CAS.
- E. Adler and S. Hernestam, Acta Chem. Scand., 1955, 9, 319 CrossRef CAS.
- J. Ralph, S. Quideau, J. H. Grabber and R. D. Hatfield, J. Chem. Soc., Perkin Trans. 1, 1994, 3485 RSC.
- J. E. Bartmess, J. A. Scott and R. T. McIver, J. Am. Chem. Soc., 1979, 101, 6046 CrossRef CAS.
Footnote |
| † Electronic supplementary information (ESI) available: Computational energy values for all stuctures and reaction energy changes in gas phase and in water (PCM) are provided. 1H and 13C NMR spectra of 4-hydroxymethyl-2-(4′-hydroxymethyl-2′-methoxyphenoxy)-6-methoxyphenol (3). See DOI: 10.1039/c3ob40783g |
| This journal is © The Royal Society of Chemistry 2013 |

