 Open Access Article
Creative Commons Attribution 3.0 Unported Licence
The effect of magnetically induced linear aggregates on proton transverse relaxation rates of aqueous suspensions of polymer coated magnetic nanoparticles†
Steven L.
Saville
a,
Robert C.
Woodward
b,
Michael J.
House
b,
Alexander
Tokarev
a,
Jacob
Hammers
c,
Bin
Qi
a,
Jeremy
Shaw
d,
Martin
Saunders
d,
Rahi R.
Varsani
bd,
Tim G.
St Pierre
b and
O. Thompson
Mefford
*a
aClemson University, Department of Material Science and Engineering, Center for Optical Materials Science and Engineering Technologies, 91 Technology Dr., Anderson, SC 29625, USA. E-mail: mefford@clemson.edu
bThe University of Western Australia, School of Physics, 35 Stirling Hwy, Crawley, WA 6009, Australia
cClemson University, Department of Bioengineering, 301 Rhodes Research Center, Clemson, SC 29634, USA
dThe University of Western Australia, Centre for Microscopy, Characterisation and Analysis, 35 Stirling Hwy, Crawley, WA 6009, Australia
First published on 15th January 2013
Abstract
It has been recently reported that for some suspensions of magnetic nanoparticles the transverse proton relaxation rate, R2, is dependent on the time that the sample is exposed to an applied magnetic field. This time dependence has been linked to the formation of linear aggregates or chains in an applied magnetic field via numerical modeling. It is widely known that chain formation occurs in more concentrated ferrofluids systems and that this has an affect on the ferrofluid properties. In this work we examine the relationships between colloidal stability, the formation of these linear structures, and changes observed in the proton transverse relaxation rate of aqueous suspensions of magnetic particles. A series of iron oxide nanoparticles with varying stabilizing ligand brush lengths were synthesized. These systems were characterized with dynamic light scattering, transmission electron microscopy, dark-field optical microscopy, and proton transverse relaxation rate measurements. The dark field optical microscopy and R2 measurements were made in similar magnetic fields over the same time scale so as to correlate the reduction of the transverse relaxivity with the formation of linear aggregates. Our results indicate that varying the ligand length has a direct effect on the colloidal arrangement of the system in a magnetic field, producing differences in the rate and size of chain formation, and hence systematic changes in transverse relaxation rates over time. With increasing ligand brush length, attractive inter-particle interactions are reduced, which results in slower aggregate formation and shorter linear aggregate length. These results have implications for the stabilization, characterization and potentially the toxicity of magnetic nanoparticle systems used in biomedical applications.
1 Introduction
It is widely known that the application of a magnetic field to ferrofluids,‡ particularly those with relatively large particle sizes, can result in the generation of linear aggregates, or “chains”.1,2 The applied magnetic field aligns the magnetic moments of the nanoparticles, and the local dipolar fields they generate cause an attraction between nearby particles leading to the generation of chains or linear aggregates of particles aligned along the applied field direction. These aligned linear aggregate structures have been visualized via a number of techniques including transmission electron microscopy3–5 and small angle scattering6–8 and their formation modelled using a variety of techniques.9–11 The formation of chain like structures can lead to significant changes in the properties of the ferrofluids, from variations in the rheological properties2 to changes in the optical properties.12However, the implications of linear aggregate formation in magnetic nanoparticle systems used for biomedical applications are not clear. Recently, there have been significant advances in the use of magnetic nanoparticles as magnetic resonance imaging (MRI) contrast agents,13–19 but the trend towards using larger particles, or clusters of smaller particles, to potentially enhance transverse relaxation (T2) contrast enhancement is likely to also increase the probability of forming linear aggregates in a magnetic field.
While it is generally appreciated that the transverse relaxation rate (R2) increases and the inversely proportional transverse relaxation time (T2) decreases with increasing particle or cluster size,13,20–22 the concept that there is a limit to this increase in R2 as particle size moves into the echo-limited regime,23 is less well known. The suggestion that linear aggregation could play a role in driving a nanoparticle system into the echo-limited regime has been recently proposed24 to explain experimental observations of polymer encapsulated magnetite clusters showing a consistent reduction in R2 with time in a magnetic field.24–27 While this reduction in R2, and hence MRI contrast, has been ascribed to the formation of linear aggregates, direct evidence for linear aggregation was not provided. Furthermore, modelling of nanoparticle systems and chains27 predicted R2 would initially increase, or be stable, before decreasing, which was not consistent with the immediate reduction in R2 observed experimentally. However, theoretical work by Andreu et al.11 also modelled the interaction of colloids as they formed linear aggregates in a magnetic field and predicted the time dependence in R2 observed experimentally. Monte Carlo simulations by Matsumoto and Jasanoff28 indicate that for linear chains comprising six particles of magnetite (20 nanometer diameter) R2 is reduced compared to an isotropic cluster of the same number of particles, suggesting that anisotropy of aggregates plays some role in affecting proton relaxation rates.
These studies have provided a framework to help understand the implications of linear aggregation of nanoparticle systems, but in the context of biomedical applications further work is required, particularly with respect to the effect of the stabilizing ligand length on colloidal structure and stability in a magnetic field. These stabilizing ligands are required to generate colloidally stable suspensions, improve biocompatibility, and act as backbones for targeting functional groups. The major contributors to the colloidal structure of magnetic particles in the presence and absence of an applied magnetic field are particle core size and the polymer length of the stabilizing layer on the nanoparticle, which can be used to modify the inter-particle interactions.29 Both of these factors can influence colloidal structure inside a magnetic field, specifically the formation of clusters and linear aggregates of particles.30 Since the colloidal structure of these systems greatly affects the observed R2,31 cellular uptake mechanisms,32 and potentially toxicity,33 the effects of the particle size and the stabilizing polymer brush need to be well characterized both in the presence and absence of an external magnetic field.
The aim of this work is to examine the effect of the polymeric ligand length on the colloidal structure of magnetic nanoparticle suspensions in a magnetic field and how these structures affect the proton transverse relaxation rate. Specifically, we describe the scaling of colloidal linear aggregation as a function of both the stabilizing polymer molecular weight and the time in a magnetic field, via dark field imaging. Next, the effects of the stabilizing ligand's molecular weight and the concentration of particles on the time dependence of R2 were measured. The observed linear aggregation from dark field was then compared to R2 measurements to further investigate the role that particle stability and colloidal arrangements have on local proton environments.
2 Experimental section
2.1 Materials
Linear monofunctional hydroxyl terminated poly(ethylene glycol) monomethyl ether (PEG–OH) of molecular weights of 2000, and 5000 Da were purchased from Sigma Aldrich and were dried at 80 °C in a vacuum oven overnight prior to use to remove water. For the 10![[thin space (1/6-em)]](https://www.rsc.org/images/entities/char_2009.gif) 000, 20
000, 20![[thin space (1/6-em)]](https://www.rsc.org/images/entities/char_2009.gif) 000 and 40
000 and 40![[thin space (1/6-em)]](https://www.rsc.org/images/entities/char_2009.gif) 000 MW polymer, N-hydroxysuccinimide terminated PEG was purchased from JenKem and used without further purification. Iron(III) chloride hexahydrate, sodium oleate, dimethyl aminopyridine (DMAP), N,N′-dicyclohexycarbodiimide (DCC), N-hydroxysuccinimide (NHS), succinic anhydride, 3,4 dihydroxyphenylalanine (L-DOPA), chloroform, and ethyl ether were purchased from Sigma Aldrich and used without further purification. Oleic acid (from Sigma Aldrich, 99% purity) was fractionally distilled before use. Tetrahydrofuran (THF, from Sigma Aldrich) was distilled over calcium hydride before use to remove water. Dimethyl formamide (DMF, from Sigma Aldrich) was dried over molecular sieves before use to remove water.
000 MW polymer, N-hydroxysuccinimide terminated PEG was purchased from JenKem and used without further purification. Iron(III) chloride hexahydrate, sodium oleate, dimethyl aminopyridine (DMAP), N,N′-dicyclohexycarbodiimide (DCC), N-hydroxysuccinimide (NHS), succinic anhydride, 3,4 dihydroxyphenylalanine (L-DOPA), chloroform, and ethyl ether were purchased from Sigma Aldrich and used without further purification. Oleic acid (from Sigma Aldrich, 99% purity) was fractionally distilled before use. Tetrahydrofuran (THF, from Sigma Aldrich) was distilled over calcium hydride before use to remove water. Dimethyl formamide (DMF, from Sigma Aldrich) was dried over molecular sieves before use to remove water.
2.2 Sample preparation
For this study, five polymer–particle complexes of iron oxide nanoparticles functionalized with PEG ligands were used. Magnetite particles were coated with PEG molecular weights of 2000, 5000, 10![[thin space (1/6-em)]](https://www.rsc.org/images/entities/char_2009.gif) 000, 20
000, 20![[thin space (1/6-em)]](https://www.rsc.org/images/entities/char_2009.gif) 000 and 40
000 and 40![[thin space (1/6-em)]](https://www.rsc.org/images/entities/char_2009.gif) 000 Da. This broad range of molecular weights allowed for the investigation of the dependence of colloidal structure on stabilizing layer length, with particle systems ranging from moderately stable to highly stable.
000 Da. This broad range of molecular weights allowed for the investigation of the dependence of colloidal structure on stabilizing layer length, with particle systems ranging from moderately stable to highly stable.
2.3 Particle synthesis
Magnetite nanoparticles were produced using a method first developed by Park et al.34 First, iron oleate was prepared by the reaction of 20 mmol iron chloride hexahydrate with 60 mmol of sodium oleate. The mixture was then dissolved in a mixture of 40 mL of ethanol, 30 mL of deionized water, and 70 mL of hexane in a three neck round bottom flask. The solution was heated up to 70 °C with vigorous stirring and kept at this temperature for 4 h. The solution was then cooled to room temperature and the upper organic layer was separated and washed with water. In the next step, 20 mmol of iron-oleate, which was the product from the previous reaction, was mixed with 60 mmol oleic acid and 100 g 1-octadecene. The solution was heated to 105 °C under nitrogen, and was held at that temperature for 30 minutes. Afterwards, the reaction was further heated to 320 °C with a heating rate of 3 °C min−1 and kept at reflux for 1 hour. The reaction solution was then cooled to room temperature. Purification was achieved by precipitation using acetone and re-suspension into toluene. One batch of magnetite nanoparticles was used for all polymer modifications for this series.2.4 Synthesis of nitroDOPA
To bind PEG ligands to the surface of magnetite, the terminal end was modified with 3,4 dihydroxyphenylalanine (L-DOPA) that was nitrated using a method described by Yang et al.35 To nitrate the catecholamine, 1.97 g of L-DOPA (10 mmol) was dissolved in 25 mL of deionized water along with 1.52 g (22 mmol) of sodium nitrite. The water solution was then placed in an ice bath and allowed to cool down to approximately 4 °C. A 17.4 mM solution of sulfuric acid (0.927 mL concentrated sulfuric acid in 10 mL of deionized water) was then slowly dripped into the system at 0.2 mL min−1 addition rate. The formation of a yellow/brown precipitate indicated the presence nitro-3,4 dihydroxyphenylalanine (nitroDOPA). The reaction mixture was then filtered to remove the nitroDOPA and the resultant precipitant was washed three times with methanol. Formation of nitroDOPA was confirmed by nuclear magnetic resonance spectroscopy (NMR) by peaks at 6.1 ppm (CH, ring, nitroDOPA), 6.8 ppm (CH, ring, nitroDOPA), 1.8 ppm and 2.4 ppm (ring–CH2–CH2–C).2.5 Synthesis of PEG–nitroDOPA
The synthesis of varying molecular weights of PEG polymers with a nitroDOPA terminal group was done by reacting NHS-terminated PEG with nitroDOPA. For the 2000 and 5000 Da molecular weight polymers a hydroxyl terminated monofunctional PEG (2000 Da MW, 5 g, 2.5 mmol) was reacted with succinic anhydride (0.5 g, 2.5 mmol) and DMAP (0.12 g, 1 mmol) in anhydrous THF (20 mL) at room temperature for 8 hours, yielding a carboxylic acid terminated monofunctional PEG (4.12 g, 78.5% yield) (Fig. 1). The polymer was then purified by dissolving it in water and extracting with chloroform. In the next reaction step, the carboxylic acid terminated PEG (4.12 g, 1.96 mmol) was then reacted with DCC (0.53 g, 2.58 mmol) and NHS (0.23 g, 1.96 mmol) in THF (20 mL) at room temperature for 4 hours, which resulted in an NHS terminated PEG. Impurities were removed from the system using vacuum filtration and precipitation into ethyl ether (2.98 g, 68.6% yield). Finally, PEG–NHS (2.98 g, 1.34 mmol) was reacted with nitroDOPA (0.33 g, 1.34 mmol), in an anhydrous solution of DMF (10 mL) to create a nitroDOPA terminated PEG. The polymer was purified by precipitation into ethyl ether, re-dispersion into dichloromethane, and vacuum filtration (1.72 g, 54.6% yield). The same procedure was used to modify the 5000 Da MW polymers (Fig. 1). For the 10–40k polymers, the NHS terminated polymers were commercially available and only the last step (Fig. 1, step 3) was necessary for the modification of these polymers with nitroDOPA. Polymer modification was verified by nuclear magnetic resonance (NMR) spectroscopy by peaks at 6.6, 6.75, 6.85 ppm (CH, ring, DOPA), 2.7, 2.5 ppm (triplets, CH2–CH2, DOPA), 2.1 ppm (O![[double bond, length as m-dash]](https://www.rsc.org/images/entities/char_e001.gif) C–CH2–CH2–C
C–CH2–CH2–C![[double bond, length as m-dash]](https://www.rsc.org/images/entities/char_e001.gif) O, succinic anhydride addition), and 3.65 ppm (O–CH2–CH2–O, PEG).
O, succinic anhydride addition), and 3.65 ppm (O–CH2–CH2–O, PEG).
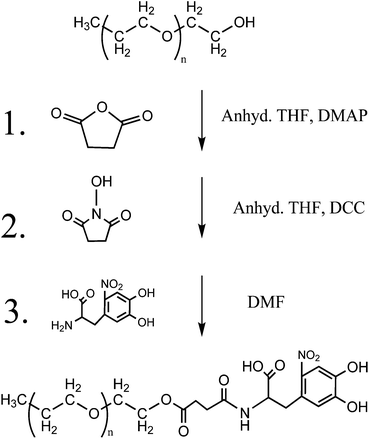 | ||
| Fig. 1 Schematic for synthesis of 2000 and 5000 Da PEG with nitroDOPA terminal group. | ||
2.6 Particle surface modification
To obtain magnetic nanoparticles suitable for use in biomedical applications, the hydrophobic particles produced in section Particle synthesis were modified with hydrophilic ligands. In order to provide consistency to the experimental methods, the same batch of magnetite nanoparticles was modified by each of the varying molecular weight polymers. The first step in the ligand exchange was to remove excess oleic acid from solution and some of the bound oleic acid surfactant stabilizing the particles by repeatedly washing with ethanol. Following the fourth washing step, nanoparticles were precipitated and redispersed with dichloromethane (3 mL). To modify 10 mg of the magnetite nanoparticles with PEG–nitroDOPA, 0.025 mmol of each molecular weight polymer was dissolved in 4 mL of chloroform. The nanoparticle suspension (3 mL at 3.3 mg mL−1) was then added drop-wise over 30 minutes to the polymer solution while sonicating. The resulting mixture was then placed on a shake plate and agitated overnight. To purify the system, particles were precipitated from dichloromethane the following day using a 1![[thin space (1/6-em)]](https://www.rsc.org/images/entities/char_2009.gif) :
:![[thin space (1/6-em)]](https://www.rsc.org/images/entities/char_2009.gif) 4 volume ratio of chloroform to hexane. Particles were then centrifuged, collected, and dispersed in water. Dialysis against water was then performed for three days, with frequent changing of the water, to remove any excess ligand in the system.
4 volume ratio of chloroform to hexane. Particles were then centrifuged, collected, and dispersed in water. Dialysis against water was then performed for three days, with frequent changing of the water, to remove any excess ligand in the system.
2.7 Characterization of particle/polymer complexes
Dynamic light scattering (DLS) was used to estimate the average hydrodynamic diameter of each of the PEG coated preparations in the series. Measurements were conducted using a Malvern Zetasizer Nano ZS using water as the solvent at 25 °C. Intensity weighted average sizes are reported.Transmission Electron Microscopy (TEM) was used to obtain the magnetite core size distribution of the particle suspension used in this study. Samples were prepared by dropping diluted water suspension of each particle complex onto a copper grid coated with a carbon film. High-resolution TEM images were acquired at an accelerating voltage of 300 kV on a Hitachi H-9500 instrument. Image analysis was performed using Adobe Photoshop with Fovea-Pro 4 plugin by Reindeer Graphics©. Approximately 400 particles were measured for each nanoparticle system produced.
The iron concentration of each of the nanoparticle suspensions was determined in triplicate by inductively coupled plasma optical emission spectroscopy (ICP-OES) of acid digested samples using a Perkin Elmer Optima 3100RL ICP-OES.
Magnetic properties were measured on freeze-dried samples of the particles. The samples were measured in a 7 Tesla Quantum Design MPMS. The samples were then dissolved in concentrated nitric acid and measured by ICP-OES in triplicate to determine the mass of iron in the sample. The magnetisation values are given in units of emu per gram of magnetite, determined from the ICP-OES analysis. Thermogravimetric analysis (TGA) was used to analyze the polymer loading on each nanoparticle series. Polymer loading was measured by dispersing each particle/polymer complex onto a platinum TGA pan then heating to 900 °C on a TA Instruments High Res 2950 instrument at 15 °C min−1. Typical sample size was between 2 and 5 mg. The polymer loading was determined by measuring the decomposition of the organic layer of each suspension, which allows the number of moles of polymer on the surface of magnetite to be calculated. Tests on pure PEG stabilizers showed little to no char yield, and therefore the presence of char was neglected in all calculations. The number of polymer chains in the system was then divided by the total particle surface area assuming even polymer coverage to give the polymer chain density at the surface of each nanoparticle, or number of polymer chains per square nanometer of nanoparticle surface area. The surface area was calculated by integrating over the particle core size distribution obtained from TEM.
2.8 Imaging of linear aggregates
To image linear aggregation as a function of time inside a magnetic field, an 8 μL droplet of each nanoparticlesample dispersion was placed between two glass slides. A 64 μm thick Kapton tape was placed between the ends of the glass slides to keep them separated. The drop was incased between glass slides and was investigated under the 50× objective of a BX-51 Olympus microscope. Dark field optical microscopy was used to detect the chains formed from nanoparticle interaction under an applied external magnetic field. To supply the external magnetic field, two permanent magnets were fixed with a separating distance of 12 mm, which provided a uniform magnetic field of 0.27 T at the point of observation. The field was measured using a Hall probe (MetroLab, THM1176-HF) and demonstrated minimal field gradients near the area of interest. A video camera (SPOT Imaging Solutions, Inc.) was used for recording the chain formation process. The captured videos were analyzed using the VirtualDub software available at (http://www.virtualdub.org).To estimate the average chain length for each sample as a function of time exposed to an external 0.27 T magnetic field, each image at different time points was imported into software written with Matlab®. The images were then converted to gray scale and the pixel brightness values were compared to a threshold value of the average pixel brightness plus a standard deviation for each image. Starting at the top left hand corner of the image, the algorithm scans for a bright pixel as compared to the minimum threshold value. Once a pixel of sufficient brightness was detected, the program then scanned local pixel brightness and tracked the length of the chain until the local brightness mean fell below the threshold value. At the end of each chain where the average pixel brightness fell below the threshold value, the total number of bright pixels was counted and converted to microns. The measured bright pixel chain region was then boxed off to avoid multiple detections of a single chain. After the image was completely analyzed in such a manner, the function output the chain lengths to a Microsoft Excel® file and wrote a new image containing a graphical interpretation of the detected chains. The average chain length was then calculated along with the standard deviation based on the total width of each image (160 μm) as a function of time.
To visualize the linear aggregates (chains) and gain a better resolution than possible from optical dark field imaging, the particles were imaged by transmission electron microscopy (TEM). To accomplish this, particles were dispersed in an agarose gel above the gelation temperature, exposed to a magnetic field inside a proton relaxometer for 30 minutes at 37 °C, and then locked in place by cooling the gel below its gelation temperature. The particles in agarose gel were prepared by adding 2 wt% low gelling temperature agarose (2-hydroxyethyl agarose, Sigma Aldrich) to 5 mL of 10 mg mL−1 2k Da nitro-DOPA coated magnetite. The solution was sonicated for 2 minutes in a probe homogenizer (Biologics 3000 with a microtip at 40% power and 50% duty cycle) and then placed into a water bath at 95 °C for 10 minutes and then sonicated for a further two minutes with the probe homogenizer. Two 0.5 mL aliquots were placed in 7.5 mm diameter NMR tubes and then into a water bath at 37 °C. The field-set sample was placed inside the proton relaxometer and exposed to a magnetic field prior to cooling below the gelling temperature. The NMR tube was marked with the magnetic field direction of the proton relaxometer. The other sample (control) was cooled in the absence of a field.
To make samples suitable for TEM, the agarose gels were infiltrated and embedded with epoxy resin (Procure 812 kit, Proscitech) and then cut into thin sections. To embed the gels, the cylinder of set agarose was pushed from the NMR tubes and cut transversely into 1 mm disks (i.e. in the plane of the field for field set gels). An arc was cut from each disk to keep track of the magnetic field direction.
Gel disks were then dehydrated in a graded series of ethanol to 100% followed by dry acetone and then infiltrated with epoxy resin (3![[thin space (1/6-em)]](https://www.rsc.org/images/entities/char_2009.gif) :
:![[thin space (1/6-em)]](https://www.rsc.org/images/entities/char_2009.gif) 1, 1
1, 1![[thin space (1/6-em)]](https://www.rsc.org/images/entities/char_2009.gif) :
:![[thin space (1/6-em)]](https://www.rsc.org/images/entities/char_2009.gif) 1, 1
1, 1![[thin space (1/6-em)]](https://www.rsc.org/images/entities/char_2009.gif) :
:![[thin space (1/6-em)]](https://www.rsc.org/images/entities/char_2009.gif) 3 acetone to epoxy then 2× changes of 100% epoxy, 1 hour each step). Disks were then placed into embedding molds and polymerized overnight at 70 °C. Ultrathin sections (120 nm) were cut using a microtome (EM UC6, Leica) and placed onto 200 mesh carbon filmed copper grids prior to imaging at 120 kV by a TEM (2100, JEOL) fitted with a digital camera (Orius SC1000, Gatan).
3 acetone to epoxy then 2× changes of 100% epoxy, 1 hour each step). Disks were then placed into embedding molds and polymerized overnight at 70 °C. Ultrathin sections (120 nm) were cut using a microtome (EM UC6, Leica) and placed onto 200 mesh carbon filmed copper grids prior to imaging at 120 kV by a TEM (2100, JEOL) fitted with a digital camera (Orius SC1000, Gatan).
2.9 Proton transverse relaxation rate measurements
The time dependence of the proton transverse relaxation rates (R2) was measured using a Bruker©Minispec Mq10 relaxometer. The central magnetic field strength of this relaxometer is 0.235 T, comparable to the magnetic field strength used in the dark-field scattering experiments (see section Imaging of linear aggregates). The concentration of each particle suspension was adjusted to 0.1 mM Fe L−1, and confirmed by ICP. Proton transverse relaxation rates were measured using a Carr–Purcell–Meiboom–Gill (CPMG) pulse sequence using 2000 echoes with an echo spacing of 0.2 ms. Relaxation rate measurements were recorded every 15 seconds for a period of approximately 20 minutes. The R2 data as a function of time for each particle suspension was then fitted with a biexponential decay function:| R2(t) = R2(∞) + Ae−ΛAt + Be−ΛBt | (1) |
Furthermore, to investigate the relationship between particle interactions and linear aggregate formation, the time dependence of R2 of the 5k Da sample was measured as a function of particle concentration using a 60 MHz relaxometer. The results are reported as weighted decay rate (Λw) versus concentration. The amplitude weighted rate constant was calculated using the equation:
 | (2) |
2.10 Theoretical modelling of hydrodynamic size
The theoretical hydrodynamic diameter of polymer coated particles can be calculated using the blob model,36 which is based on a model for star polymers by Daoud and Cotton,37 and assumes concentric shells with a constant number of blobs in each shell. The hydrodynamic radius can then be described as | (3) |
| Nk = n/c∞ | (4) |
| Lk = c∞l0 | (5) |
| f(r) = 4πr2σ | (6) |
 | (7) |
 | (8) |
2.11 Theoretical modelling of particle stability
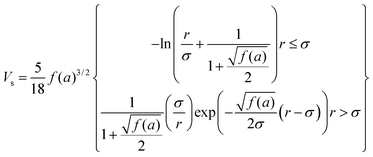
To gain an understanding of the stability of these systems, the particle–particle potential for each polymer/particle complex in this series was calculated using a modified DLVO model presented by Mefford et al.36 These potentials were calculated based on the average core particle size (from TEM) and the polymer to particle mass ratio (from TGA), and is given as the total combined potential energy resulting from all attractive and repulsive forces, given by the equation| VTotal = VvdW + VM + VES + VS | (9) |
 | (10) |
 | (11) |
 | (12) |
3 Results and discussion
To identify the relationship between polymer brush length and the proton transverse relaxation rate, a series of magnetite particles were synthesized with a variety of polymer coatings that ranged from 2k to 40k Da. This broad range of polymer molecular weight allows for the analysis of particle systems that interact strongly and those that do not. To determine the influence of linear aggregate formation and size on the proton transverse relaxation, this series of particle suspensions was analyzed using dark-field optical scattering in the same magnetic field strength as used in the relaxometry measurements. The formation of linear aggregates could then be correlated to the reduction in the total transverse relaxivity of the system as a function of time.3.1 TEM
From the analysis of the TEM images it is evident that the particles used in this study have a bimodal distribution of sizes with modes at 17 nm and 24 nm (Fig. 2). The bimodal distribution of the particle size is a result of the thermal decomposition method used. Owing to the bimodal distribution of the particles, the mean core size of the magnetite particles is 21.9 nm with a numerical standard deviation of 4.6 nm. To estimate both the surface coverage and the inter-particle potentials, the particle core size information was fitted with a bimodal lognormal distribution (Fig. 2).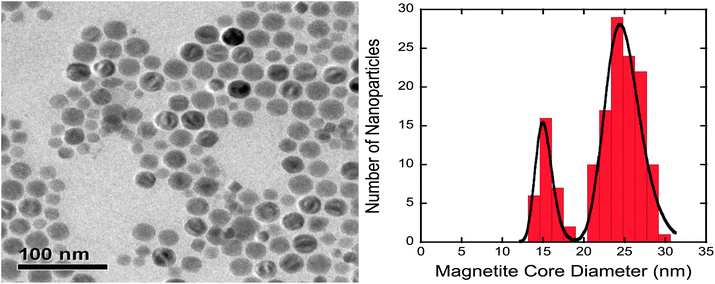 | ||
| Fig. 2 TEM image (left) and particle size analysis (right) for pre-modified particles used in this study. The histogram shows the nanoparticle core diameter distribution and the solid black line shows the bimodal lognormal distribution fit. | ||
3.2 Dynamic Light Scattering (DLS) and modelling
DLS measurements (Fig. 3) indicated that the hydrodynamic diameter generally increased with increasing molecular weight of the ligands from 2000 to 40![[thin space (1/6-em)]](https://www.rsc.org/images/entities/char_2009.gif) 000 Da. The predicted hydrodynamic diameters from the modelling (Table 1) were all smaller than the measured values from DLS. The average offset between the predicted and measured DLS particle sizes was around 36 nm for each molecular weight sample. One explanation for this behavior is that there was some aggregation of particles in suspension, and the intensity weighted hydrodynamic size is extremely sensitive to minor amounts of aggregates in solution.
000 Da. The predicted hydrodynamic diameters from the modelling (Table 1) were all smaller than the measured values from DLS. The average offset between the predicted and measured DLS particle sizes was around 36 nm for each molecular weight sample. One explanation for this behavior is that there was some aggregation of particles in suspension, and the intensity weighted hydrodynamic size is extremely sensitive to minor amounts of aggregates in solution.
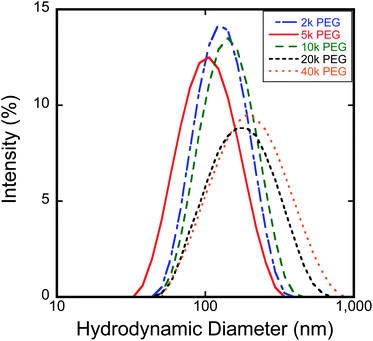 | ||
| Fig. 3 Plot of DLS distributions comparing particle intensity-weighted hydrodynamic diameter as a function of brush length. | ||
| Sample name | Weight loss from TGA (%) | Surface coverage (chains per nm2) | Measured hydrodynamic diameter (nm) | Predicted hydrodynamic diameter (nm) |
|---|---|---|---|---|
| 2k Da 24 nm | 36.58 | 3.67 | 105.3 | 47.45 |
| 5k Da 24 nm | 53.14 | 2.93 | 136.4 | 68.43 |
| 10k Da 24 nm | 67.54 | 2.69 | 149.9 | 95.28 |
| 20k Da 24 nm | 74.5 | 1.89 | 171.4 | 129.03 |
| 40k Da 24 nm | 82.8 | 1.53 | 188.6 | 180.6 |
3.3 Magnetic measurements
The particles were found to be predominately superparamagnetic at room temperature, with a small fraction, less than 1%, of the particles showing sign of ferromagnetic behaviour at room temperature. The saturation magnetisation of the particles was found to be 70 emu g−1 of magnetite at 300 K in a 7 T field. This is within the range of values (60–90 emu g−1magnetite) commonly seen for magnetite nanoparticles.42,43 The samples rapidly magnetise in relatively small fields so that they achieve over 70% of their saturation magnetisation in a field of 0.25 T. The ease of magnetisation of the particles is to be expected given their relatively large size Fig. 4.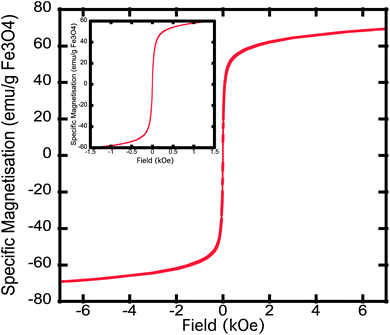 | ||
| Fig. 4 Hysteresis loop of the magnetic nanoparticles at 300 K. Specific magnetization is measured in units of emu g−1 of magnetite as determined by iron analysis of samples using ICP-OES. | ||
3.4 Imaging of linear aggregates
To better understand the magnetic field-induced colloidal structures of these systems, dark-field optical microscopy was used to observe the suspensions in a 0.27 T magnetic field, a field similar to that used for the proton relaxation rate measurements. Initially, each sample was observed without an applied magnetic field.For the lower molecular weight stabilized particle systems (2k Da and 5k Da), a small number of clusters of particles could be seen without an applied external field (Fig. 5). For the higher molecular weight stabilized systems (10k Da, 20k Da, and 40k Da), no initial clusters were visible (the resolution limit of the imaging technique was approximately 1 micron). Following initial imaging, the 0.27 T external magnetic field was applied to each sample for 300 seconds by sliding the center of two magnets directly underneath the sample droplet. Care was taken to ensure homogeneity of the magnetic field at the sample level because any field gradients lead to significant translational movement of the chains. Fig. 5 shows the chain formation behavior for each of the 5 polymer coated samples over time. It can be seen from Fig. 5 that significantly longer chains are formed in the particles stabilized with lower molecular weight polymers (2k Da and 5k Da). The 10k Da and 20k Da coated samples showed a significant decrease in the overall amount of linear aggregation compared with the 2k Da and 5k Da samples. The 40k Da coated sample showed almost no sign of visible linear aggregation. It can also be seen in Fig. 5 that the average linear aggregate length after exposure to a magnetic field decreases with increasing molecular weight. It is hypothesized that the reason for this effect is that the polymer shell for these larger molecular weight stabilized particles provides more steric repulsion, which acts to reduce or overcome the combination of van der Waals and the magnetic interactions of the particles when they are in a field.
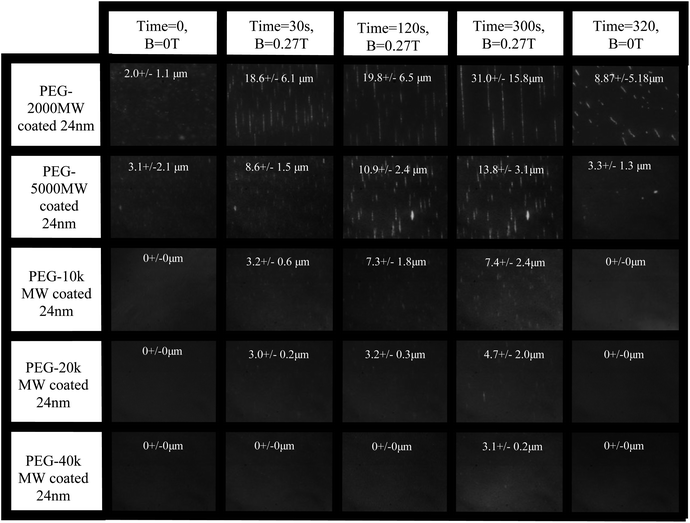 | ||
| Fig. 5 Dark field scattering images at varying times for each polymer/particle sample. The average chain length and size distribution has been annotated on each image. It can be seen that the chain length is directly related to the polymer stabilizing brush. The field of view in each image is about 160 microns. | ||
It was also observed during these experiments that formation of linear aggregates appears to consist of two components or phases; the initial interaction of particle magnetic poles leading to the formation of linear aggregates, and then shifting of these linear aggregates to form significantly longer linear structures. One can describe this as a bundling of linear structures as if these linear “fibers” are forming “threads”. A similar effect was also identified by Laskar et al.44 In their experiments, transmitted light intensity through a magnetic nanoparticle solution was reported as a function of time left inside an external magnetic field. It is speculated that the formation of small linear aggregates correlated to the initial reduction of intensity while a secondary increase in transmitted light intensity correlated to both the longitudinal and lateral interaction amongst linear aggregates. This effect was especially seen in our 2k Da and 5k Da samples, with the formation of extremely long linear aggregates consisting of two components; initial aggregation followed by long-range interactions amongst linear formations. The timescales that are observed in these experiments correlate to what was observed in the scattering experiments performed by Laskar et al.,44 further indicating that linear aggregation occurs both tip-to-tip and laterally.
The TEM images (Fig. 6) show that these particles are forming long linear aggregates in the presence of an external magnetic field, presumably because of dipolar magnetic interactions. Furthermore, the linear aggregates also appear to laterally interact with each other, as shown in Fig. 6 (right). This observation is supported by video captured in dark-field optical microscopy, where initial linear aggregation can be visualized followed by linear aggregates interacting with each other both end-to-end and laterally (ESI Video†).
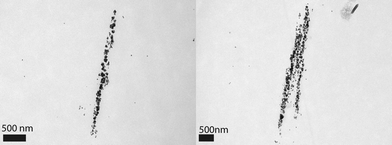 | ||
| Fig. 6 TEM image displaying both linear aggregation (left) and linear and lateral aggregation (right). | ||
3.5 Time dependence of proton transverse relaxation rates
The proton transverse relaxation rate of each suspension was measured as a function of time in a 10 MHz Bruker Minispec with a magnetic field of 0.235 T. Fig. 7 shows the fractional decrease in R2 as a function of time. All suspensions showed some degree of time dependence. The magnitude of the fractional reduction in R2 was observed to decrease as the molecular weight of the stabilizing polymer increased (Fig. 7). The reduction in R2 with time for each polymer can be fitted with a bi-exponential equation that fits the decay in R2 over the entire measurement time in contrast to the power law equation of Chen et al.,25,27 which generally fits the data only for short time periods. An amplitude weighted rate constant (Λw) can be determined from the biexponential fit. Λw decreases with increasing molecular weight of the polymer (Fig. 8).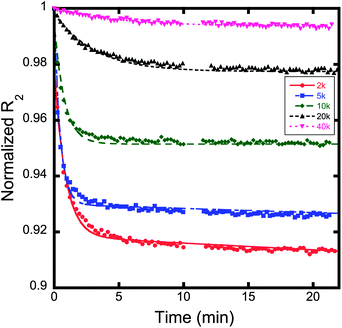 | ||
| Fig. 7 Graph of normalized R2versus time for varying polymer coated magnetite nanoparticles. The amount of time dependence for each sample decreases as a function of increasing molecular weight. The decay rate for each sample was fit using a biexponential decay function, as displayed in eqn (1). The weighted decay rates are presented in Fig. 8. | ||
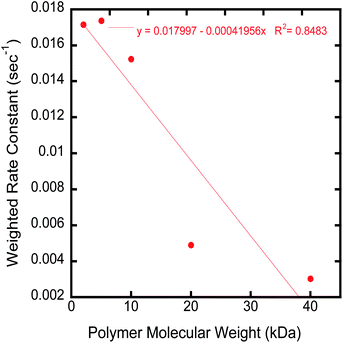 | ||
| Fig. 8 Graph of the weighted rate constant (Λw) versuspolymer molecular weight. | ||
A potential explanation for the observed time dependence of R2 is that as a magnetic field is applied, particles will assume a dipole–dipole alignment owing to the interaction of the magnetic poles of the nanoparticles. As these dipolar interactions increase, the colloidal structure of the particle system is significantly changed into the form of long-range linear aggregates. The enhancement of the transverse relaxation rate of water protonsvia magnetic nanoparticles depends heavily on the access of water protons to a broad range of magnetic fields and to the time in which these protons experience these varying magnetic fields. As these linear aggregates form, the volume of the sample associated with high magnetic field gradients is reduced. In addition, as other workers have suggested,24 the formation of large linear aggregates may also shift the system into the echo-limited regime, where R2 is inversely proportional to the size of the aggregate. Therefore, as particles aggregate into linear structures inside a magnetic field, the total transverse relaxation rate of the system is diminished. The biexponential nature of the decay in the relaxation rate with time is potentially related to the two-phase formation of linear aggregates seen in Fig. 6 and discussed earlier. The fast initial decay in the relaxation rate could be associated with the initial formation of linear aggregates and the large reduction of space associated with high field gradients. While the slower decay, which dominates at longer times, may correlate to the long-range longitudinal and lateral interaction of linear aggregates. A similar two stage change in the transverse proton relaxation can be seen in Chen et al.,27 where the normalized increment in the relaxation time shows two distinct linear regions. In parallel with these changes, the fast initial decay in the relaxation rate may also be associated with the rapidly increasing proportion of linear aggregates in the echo-limited regime, which subsequently stabilize after about 5 minutes. At this stage it is not clear whether the linear structure or the size of the aggregates dominates the time dependence in R2.
To elucidate the influence of particle concentration on the time dependence of R2, the 5k Da coated sample was diluted to varying concentrations and the time dependence of each sample was then recorded in a 60 MHz relaxometer. The plots of R2 against time were fitted with a bi-exponential decay curve and the amplitude weighted rate constant (Λw) is reported as a function of iron concentration and the cube root of iron concentration in Fig. 9. Λw increased significantly as the particle concentration increased (Fig. 9a). If, as suggested earlier, the time dependence in R2 is related to the formation of linear aggregates, then at lower concentrations the time associated with formation of linear aggregates should increase significantly, as shown here, as the particles would need to move further to form linear structures. Furthermore, as depicted in Fig. 9b, a strong linear relationship exists between the weighted rate constant Λw and the cubic root of concentration. The cube root of concentration is used here as a surrogate measure of interparticle distance. Hence, the rate at which particles form magnetically induced linear aggregates is directly proportional to the interparticle spacing, which is a function of particle concentration.
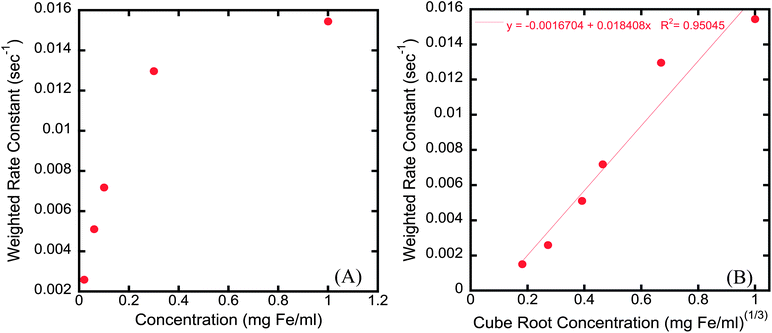 | ||
| Fig. 9 (A) Graph of weighted rate constant (Λw) versusnanoparticle concentration and (B) weighted rate constant (Λw) versus cubic root of concentration correlating the rate at which particles form linear aggregates to interparticle spacing. | ||
3.6 Theoretical modelling of particle stability
A modified DLVO model36 was used to calculate the potential energy between two particles coated with different molecular weight polymers by combining the van der Waals, steric, and magnetic interactions. The results of this modified DLVO model are shown in Fig. 10. In all cases, at very close proximity steric repulsion are significantly higher than the magnetic and van der Waals attraction. Nonetheless particle systems with lower molecular weight polymers (2k Da, 5k Da, and 10k Da) had deep energy wells at moderate surface-to-surface distances as the polymer brushes do not provide sufficient steric repulsion to overcome the van der Waals and magnetic interaction forces (defined by a total potential energy more than 2 kT) in a magnetic field,45 while higher molecular weight stabilized systems (20k Da and 40k Da) do. These results are consistent with our experimental results, where lower molecular weight stabilized systems showed significant inter-particle interactions in the form of clusters without an applied field and strong linear aggregation in an applied magnetic field. Higher molecular weight stabilizer produced samples with no observable clusters in the absence of a field and only weak linear aggregation in a field.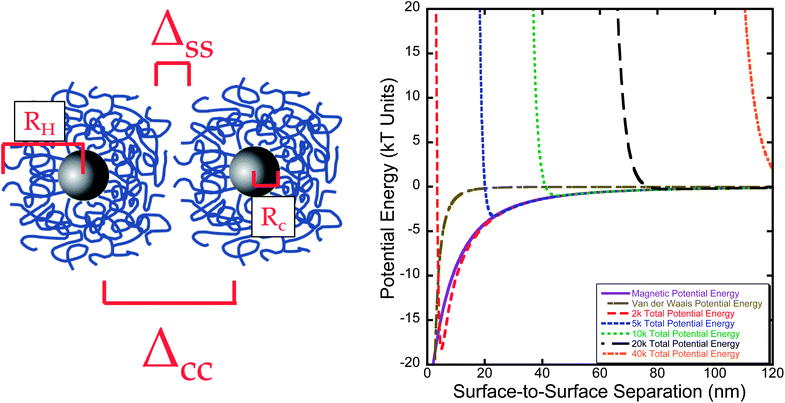 | ||
Fig. 10 DLVO modeling of particle series based upon the total potential energy of each system. RH is the hydrodynamic radius, Rc is the nanoparticle core radius from TEM, ΔCC is the core-to-core separation distance, and ΔSS is the surface-to-surface separation. For these samples, the polymer layer does not provide sufficient steric repulsion to overcome magnetic and van der Waals attractive forces until 20![[thin space (1/6-em)]](https://www.rsc.org/images/entities/char_2009.gif) 000 Da molecular weight. 000 Da molecular weight. | ||
3.7 Practical implications of linear aggregate formation
Researchers are always looking to improve the performance of contrast agents by increasing the relaxivity. However, many modifications that increase the relaxivity may also decrease the colloidal stability particularly in the presence of a magnetic field. Hence any measurement of relaxivity should also include some assessment of the time dependence. If nanoparticle contrast enhancement samples are time dependent then any reported value for the relaxivity will be a function of the time in the measurement field.One of the more important factors that can influence a particle system's effectiveness as a contrast enhancement agent is its stability against aggregation and flocculation. The stability of nanoparticle-based contrast agents have been shown to have a significant influence on bio-distribution, renal clearance, and blood circulation half-life.46 The stability of these systems typically has been measured by DLS, where clustering and aggregation of particles can be observed by an increase in hydrodynamic diameter. However, these measurements are extremely sensitive to small numbers of larger particles, impurities, and dust, which may lead to inaccurate results. Furthermore, these measurements take place in the absence of an external magnetic field. Measurement of proton relaxation rates as a function of time in magnetic field, as presented in this report, represents an alternative method for measuring the stability of magnetic nanoparticles under the influence of an external magnetic field. If time dependent relaxivity is observed, it represents a clear indication that particles are aggregating under the influence of the magnetic field. As our results here indicate, such tests can then be used to assess the effectiveness of various polymer stabilizers.
The formation of linear aggregates has other implications for biomedical applications of magnetic nanoparticles. As aggregates form they will significantly modify the magnetophoretic mobility of the system. Larger particles have in general larger magnetophoretic mobility and when combined with the acicular nature and size of the aggregates, it may significantly alter the behaviour of particles for applications in magnetically targeted drug delivery. Recent research by Bae et al. has shown that the toxicity of magnetic particles significantly increases following the application of a magnetic field.33 According to their findings, the increased cytotoxicity was most likely from the enhanced cellular uptake generated by the formation of field-induced aggregates. Hence care should be taken to develop systems that minimize field-induced aggregations for applications where static magnetic fields will be applied. As mentioned previously, the degree of field-induced aggregation can be assessed using time dependent relaxometry.
4 Conclusions
This study provides evidence that the polymer length of the stabilizing layer for magnetic nanoparticle systems has a significant role in the observed time dependence of proton transverse relaxation rates. This time dependence is related to the polymer layer affecting the colloidal arrangement of the magnetite nanoparticle system before introduction of the sample into an external magnetic field (clustering) and after (linear aggregation). The polymer length of the stabilizing layer, and the steric repulsion it supplies, plays a significant role in controlling cluster formation; with lower molecular weight stabilized polymers appearing moderately clustered according to DLS, and it also determines the extent of interparticle interactions. High molecular weight stabilized systems have significantly weaker attractive interparticle interactions and hence over time particles are less likely to chain or cluster. The linear aggregation of these systems may be detrimental to the contrast enhancement. Therefore it is important to design nanoparticle systems with a sufficient stabilization layer to prevent the magnetic attraction between cores from overcoming the steric repulsion mechanism resulting in stable systems in a magnetic field.The relaxivity of T2 contrast agents is rarely reported together with the duration of exposure to a magnetic field making comparisons between researchers and contrast agents difficult, particularly when an adequate polymer-stabilizing layer is not present. Time-dependent R2 measurements offer the ability to define particle stability and test for potential linear aggregation over time. Particle systems that have a sufficient polymer layer to overcome magnetic interactions and resist linear aggregation will show low or no decay in the relaxation rate with time.
Future considerations of this work should also include the biological impact of linear aggregation. As the results gathered in this study indicate, linear aggregation increases the length scale of these particle systems from the nanometer domain to hundreds of microns long. Furthermore, some of these particle systems may contain residual aggregates if they have been exposed to an external magnetic field. At this point it is not well understood how these long linear aggregates affect biological responses and their toxicology, but initial reports suggest that the aggregation of nanoparticles increases cytotoxicity.33 Further work in this area is required to investigate the cellular response to nanoparticle systems with and without linear aggregation properties.
Acknowledgements
The authors would like to thank the financial support of the National Science Foundation East Asia and Pacific Summer Institutes program, National Science Foundation Grant (DMR-097167), the South Carolina Space Grant Consortium, and the Australian Research Council (DP0985848 & DP120103560). The authors would also like to thank Dr Kornev in the Material Science and Engineering department at Clemson University for use of the microscope used in dark field scattering images.References
- R. E. Rosensweig, Ferrohydrodynamics, Dover Publications, 1997 Search PubMed.
- S. Odenbach, Magnetoviscous effects in ferrofluids, Springer, Hong Kong, 2002 Search PubMed.
- K. Butter, P. H. Bomans, P. M. Frederik, G. J. Vroege and A. P. Philipse, J. Phys.: Condens. Matter, 2003, 15, S1451–S1470 CrossRef CAS.
- Y. Lalatonne, J. Richardi and M. P. Pileni, Nat. Mater., 2004, 3, 121–125 CrossRef CAS.
- M. Klokkenburg, R. P. A. Dullens, W. K. Kegel, B. H. Erne and A. P. Philipse, Phys. Rev. Lett., 2006, 96, 037203 CrossRef.
- R. Itri, J. Depeyrot, F. A. Tourinho and M. H. Sousa, Eur. Phys. J. E: Soft Matter Biol. Phys., 2001, 4, 201–208 CrossRef CAS.
- T. Kruse, H. G. Krauthauser, A. Spanoudaki and R. Pelster, Phys. Rev. B: Condens. Matter Mater. Phys., 2003, 67, 094206 CrossRef.
- A. Wiedenmann, M. Kammel, A. Heinemann and U. Keiderling, J. Phys.: Condens. Matter, 2006, 18, S2713–S2736 CrossRef CAS.
- R. W. Chantrell, A. Bradbury, J. Popplewell and S. W. Charles, J. Appl. Phys., 1982, 53, 2742–2744 CrossRef CAS.
- M. Aoshima and A. Satoh, J. Colloid Interface Sci., 2005, 288, 475–488 CrossRef CAS.
- J. S. Andreu, C. Calero, J. Camacho and J. Faraudo, Phys. Rev. E: Stat., Nonlinear, Soft Matter Phys., 2012, 85, 036709 CrossRef.
- J. P. Ge, Y. P. Hu, T. R. Zhang, T. Huynh and Y. D. Yin, Langmuir, 2008, 24, 3671–3680 CrossRef CAS.
- M. R. J. Carroll, R. C. Woodward, M. J. House, W. Y. Teoh, R. Amal, T. L. Hanley and T. G. St Pierre, Nanotechnology, 2010, 21, 035103 CrossRef.
- D. X. Chen, N. Sun, Z. J. Huang, C. M. Cheng, H. Xu and H. C. Gu, J. Magn. Magn. Mater., 2010, 322, 548–556 CrossRef CAS.
- C. Suelin, F. Reynolds, Y. Lingtau, R. Weissleder and L. Josephson, J. Mater. Chem., 2009, 6387–6392 Search PubMed.
- J. Xie, J. Huang, X. Li, S. Sun and X. Chen, Curr. Med. Chem., 2009, 16, 1278–1294 CrossRef CAS.
- F. Q. Yu, L. Zhang, Y. Z. Huang, K. Sun, A. E. David and V. C. Yang, Biomaterials, 2010, 31, 5842–5848 CrossRef CAS.
- L. Lartigue, C. Innocenti, T. Kalaivani, A. Awwad, M. D. S. Duque, Y. Guari, J. Larionova, C. Guerin, J. L. G. Montero, V. Barragan-Montero, P. Arosio, A. Lascialfari, D. Gatteschi and C. Sangregorio, J. Am. Chem. Soc., 2011, 133, 10459–10472 CrossRef CAS.
- A. P. Khandhar, R. M. Ferguson and K. M. Krishnan, J. Appl. Phys., 2011, 109, 07B310 CrossRef.
- A. Roch, Y. Gossuin, R. Muller and P. Gillis, J. Magn. Magn. Mater., 2005, 293, 532–539 CrossRef CAS.
- X. Xie and C. Zhang, J. Nanomater., 2011, 2011, 1–7 CrossRef.
- A. S. Arbab, L. B. Wilson, P. Ashari, E. K. Jordan, B. K. Lewis and J. A. Frank, NMR Biomed., 2005, 18, 383–389 CrossRef CAS.
- A. Roch, Y. Gossuin, R. N. Muller and P. Gillis, J. Magn. Magn. Mater., 2005, 293, 532–539 CrossRef CAS.
- D. X. Chen, F. J. Xu and H. C. Gu, J. Magn. Magn. Mater., 2012, 324, 2809–2820 CrossRef CAS.
- N. Sun, D. X. Chen, H. C. Gu and X. L. Wang, J. Magn. Magn. Mater., 2009, 321, 2971–2975 CrossRef CAS.
- D. X. Chen, N. Sun, Z. J. Huang, C. M. Cheng, H. Xu and H. C. Gu, J. Magn. Magn. Mater., 2010, 322, 548–556 CrossRef CAS.
- D. X. Chen, G. Via, F. J. Xu, C. Navau, A. Sanchez, H. C. Gu, J. S. Andreu, C. Calero, J. Camacho and J. Faraudo, J. Appl. Phys., 2011, 110, 073917 CrossRef.
- Y. Matsumoto and A. Jasanoff, Magn. Reson. Imaging, 2008, 26, 994–998 CrossRef CAS.
- O. T. Mefford, M. L. Vadala, J. D. Goff, M. R. J. Carroll, R. Mejia-Ariza, B. L. Caba, T. G. St Pierre, R. C. Woodward, R. M. Davis and J. S. Riffle, Langmuir, 2008, 24, 5060–5069 CrossRef CAS.
- G. B. Khomutov and Y. A. Koksharov, Adv. Colloid Interface Sci., 2006, 122, 119–147 CrossRef CAS.
- M. R. J. Carroll, P. P. Huffstetler, W. C. Miles, J. D. Goff, R. M. Davis, J. S. Riffle, M. J. House, R. C. Woodward and T. G. St Pierre, Nanotechnology, 2011, 22, 325702 CrossRef.
- R. M. Ferguson, K. R. Minard, A. P. Khandhar and K. M. Krishnan, Med. Phys., 2011, 38, 1619–1626 CrossRef.
- J. E. Bae, M. I. Huh, B. K. Ryu, J. Y. Do, S. U. Jin, M. J. Moon, J. C. Jung, Y. Chang, E. Kim, S. G. Chi, G. H. Lee and K. S. Chae, Biomaterials, 2011, 32, 9401–9414 CrossRef CAS.
- J. Park, K. An, Y. Hwang, J.-G. Park, H.-J. Noh, J.-Y. Kim, J.-H. Park, N.-M. Hwang and T. Hyeon, Nat. Mater., 2004, 3, 891–895 CrossRef CAS.
- X. Q. Yang, H. Hong, J. J. Grailer, I. J. Rowland, A. Javadi, S. A. Hurley, Y. L. Xiao, Y. A. Yang, Y. Zhang, R. Nickles, W. B. Cai, D. A. Steeber and S. Q. Gong, Biomaterials, 2011, 32, 4151–4160 CrossRef CAS.
- O. T. Mefford, M. Carroll, M. Vadala, J. Goff, R. Mejia-Ariza, M. Saunders, R. C. Woodward, T. S. Pierre, R. M. Davis and J. S. Riffle, Chem. Mater., 2008, 20, 2184–2191 CrossRef CAS.
- M. Daoud and J. P. Cotton, J. Phys., 1982, 43, 531–538 CAS.
- K. Devanand and J. C. Selser, Macromolecules, 1991, 24, 5943–5947 CrossRef CAS.
- F. Oesterhelt, M. Rief and H. E. Gaub, New J. Phys., 1999, 1, 6 CrossRef.
- S. Y. Kim and C. F. Zukoski, Langmuir, 2011, 27, 5211–5221 CrossRef CAS.
- C. N. Likos, Soft Matter, 2006, 2, 478–498 RSC.
- S. Sun, H. Zeng, D. B. Robinson, S. Raoux, P. M. Rice, S. X. Wang and G. Li, J. Am. Chem. Soc., 2003, 126, 273–279 CrossRef.
- M. P. Morales, S. Veintemillas-Verdaguer, M. I. Montero, C. J. Serna, A. Roig, L. Casas, B. Martinez and F. Sandiumenge, Chem. Mater., 1999, 11, 3058–3064 CrossRef CAS.
- J. M. Laskar, J. Philip and B. Raj, Phys. Rev. E: Stat., Nonlinear, Soft Matter Phys., 2009, 80, 041401 CrossRef.
- R. Stokes and F. Evans, Fundementals of Interfacial Engineering, Wiley-VCH, Inc., New York, 1997 Search PubMed.
- S. Tong, S. Hou, Z. Zheng, J. Zhou and G. Bao, Nano Lett., 2010, 10, 4607–4613 CrossRef CAS.
Footnotes |
| † Electronic supplementary information (ESI) available. See DOI: 10.1039/c3nr32979h |
| ‡ Colloidally stable suspensions of magnetic nanoparticles. |
| This journal is © The Royal Society of Chemistry 2013 |
