Inhibitors of bacterial tubulin target bacterial membranes in vivo†
Marie H.
Foss
a,
Ye-Jin
Eun
a,
Charles I.
Grove
b,
Daniel A.
Pauw
c,
Nohemy A.
Sorto
b,
Jarred W.
Rensvold
a,
David J.
Pagliarini
a,
Jared T.
Shaw
b and
Douglas B.
Weibel
*ad
aDepartments of Biochemistry and Biomedical Engineering, 433 Babcock Drive, Madison, WI 53706, USA. E-mail: weibel@biochem.wisc.edu; Tel: +1 (608) 890-1342
bDepartment of Chemistry, University of California-Davis, Davis, CA 95616, USA
cDepartment of Cell and Molecular Biology, University of Wisconsin–Madison, Madison, WI 53706, USA
dDepartment of Biomedical Engineering, University of Wisconsin–Madison, Madison, WI 53706, USA
First published on 18th July 2012
Abstract
FtsZ is a homolog of eukaryotic tubulin that is widely conserved among bacteria and coordinates the assembly of the cell division machinery. FtsZ plays a central role in cell replication and is a target of interest for antibiotic development. Several FtsZ inhibitors have been reported. We characterized the mechanism of these compounds in bacteria and found that many of them disrupt the localization of membrane-associated proteins, including FtsZ, by reducing the transmembrane potential or perturbing membrane permeability. We tested whether the reported phenotypes of a broad collection of FtsZ inhibitors disrupt the transmembrane potential in Bacillus subtilis strain 168. Using a combination of flow cytometry and microscopy, we found that zantrin Z1, cinnamaldehyde, totarol, sanguinarine, and viriditoxin decreased the B. subtilis transmembrane potential or perturbed membrane permeability, and influenced the localization of the membrane-associated, division protein MinD. These studies demonstrate that small molecules that disrupt membrane function in bacterial cells produce phenotypes that are similar to the inhibition of proteins associated with membranes in vivo, including bacterial cytoskeleton homologs, such as FtsZ. The results provide a new dimension for consideration in the design and testing of inhibitors of bacterial targets that are membrane-associated and provide additional insight into the structural characteristics of antibiotics that disrupt the membrane.
Introduction
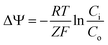
The bacterial homolog of eukaryotic tubulin, FtsZ, performs the essential role of recruiting the cell division machinery to the mid-cell during replication.1,2 FtsZ binds GTP and assembles into filaments at the cytoplasmic membrane where it forms the Z-ring. The Z-ring marks the division plane and is the scaffold for the assembly of the cell division machinery. During division, the Z-ring contracts as the cell wall is remodelled and creates the septum, which physically separates mother and daughter cells. Loss of FtsZ function blocks division and leads to the formation of long, multi-nucleoid cells (e.g. filaments) via uncoupling growth and division.3,4 Several physiological mechanisms inhibit FtsZ directly and block cell division. For example, DNA damage initiates the SOS response and triggers expression of a protein antagonist of FtsZ, SulA (also called SfiA), which stalls division for DNA damage repair.5,6 Another mechanism is the inhibition of DNA replication, as the nucleoid occlusion machinery prevents the assembly of functional Z-rings in the presence of incompletely replicated chromosomal DNA.7,8 In sporulating Bacillus subtilis, the peptide MciZ halts cytokinesis in the mother cell by inhibiting FtsZ.9 The B. subtilis protein UgtP is involved in sensing growth conditions and inhibits FtsZ assembly until cells have an appropriate mass.4The loss of the transmembrane potential (ΔΨ) was recently reported as a negative regulator of FtsZ function.10 ΔΨ arises from the separation of different concentrations of charged ions across the bacterial membrane and can be measured using a permeable cationic dye and the Nernst equation (eqn (1)), where Ci is the concentration of the dye inside the cell and Co is the concentration of dye outside, R is the gas constant, T is temperature, Z is the number of electrons per mole of dye, and F is the Faraday constant.11
 | (1) |
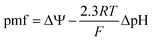
ΔΨ is a source of potential energy that facilitates the transport of molecules and ions across the cell membrane. The establishment of the proton motive force (pmf) contributes significantly to ΔΨ and facilitates ATP production via oxidative phosphorylation.12 The relationship between ΔΨ and the chemical proton potential can be described by eqn (2), where ΔpH is the difference between the internal and external pH (pHin − pHout).12
 | (2) |
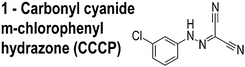
A recently discovered role of ΔΨ is the localization of membrane-associated proteins, including bacterial proteins that regulate division and cell shape.10 Carbonyl cyanide m-chlorophenylhydrazone (CCCP, 1, Table 1) is among the best-studied small molecules that shuttle protons across the membrane (e.g. ‘protonophores’) and affects the localization of several membrane-associated proteins, including the division protein FtsA;10Fig. 1 illustrates an effect of ΔΨ on the localization of MinD. Small molecules that perturb ΔΨ may mislead the assignment of their target in vivo. Despite evidence that small molecules can influence the localization of division proteins via perturbing bacterial membranes, the effect of the relatively large number of putative inhibitors of this class of proteins on ΔΨ has not yet been studied.
| Inhibitor structure | MIC |
|---|---|
|
10 μM |

|
0.16 μM |

|
2.5 mM |

|
2.5 μM |

|
10 μM |
|
0.63 μM |

|
2.5 μM |
|
20 μM |
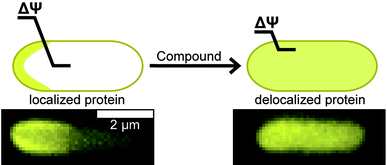 | ||
| Fig. 1 The loss of ΔΨ disrupts the normal localization pattern of membrane-associated proteins. The cartoon depicts the diffuse pattern of a polarly localized protein after reduction of ΔΨ. The length of the line across the membrane depicts the relative magnitude of ΔΨ. Fluorescence images below the cartoon represent MinD localization in E. coli cells with DMSO treatment on the left and 1 treatment on right. The scale bar represents 2 μm. | ||
FtsZ is among the most widely studied bacterial cytoskeletal proteins and is a central component of the cell division machinery. The essential role of FtsZ makes it a target of interest for the development of antibiotics. Consequently, several small molecule inhibitors of FtsZ have been reported and their target identification draws upon their activity in vitro and in vivo.13–21 The in vivo activity of several of these FtsZ inhibitors is centered upon two distinct observations: (1) cell filamentation; and (2) mislocalization of FtsZ. However, these experiments do not assess whether the inhibitor influences the properties of membranes, which provides the mechanism for mislocalizing membrane-associated proteins, such as FtsZ. An example is the proposed inhibitor of FtsZ, zantrin Z1, which we refer to as ‘3Z1’ or 2.13 Although 2 delocalizes FtsZ and has a minimum inhibitory concentration (MIC) of 0.08–40 μM against a range of bacterial strains,22 treatment of Escherichia coli with this small molecule (5 μM, or 1× MIC) does not filament cells, which is the canonical phenotype of FtsZ inhibition. This result suggests that the activity of this compound is not due to inhibiting FtsZ per se. Many putative FtsZ inhibitors produce phenotypes that are unrelated to FtsZ inhibition and their physicochemical properties make them excellent candidates for interacting with phospholipid bilayers.
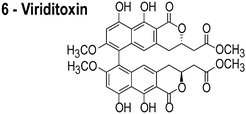
In reviewing proposed FtsZ inhibitors, we identified several compounds that may influence the properties of bacterial membranes. Cinnamaldehyde (3) is an antimicrobial agent that has been reported to inhibit FtsZ.14 The chemically related compound curcumin affects the activities of multiple disparate membrane proteins by changing lipid bilayer properties.23 For example, curcumin thins bilayers and decreases their stiffness.23,24 Totarol (4) has been assigned several other functions in vivo, including: (1) inhibiting multidrug efflux pumps;25 (2) inhibiting the bacterial electron transport chain;26 and (3) disrupting the physical properties of the membrane.27 Totarol has a large phospholipid–water partition coefficient (Kp = 1.8 × 10⁴) and is sequestered in membranes.28 Sanguinarine (5) inhibits the activity of guinea pig cardiac Na+, K+-ATPase29 and causes mitochondrial depolarization in mouse melanoma cells.30 Viriditoxin (6) activates ATP hydrolysis and induces calcium sensitized swelling of rat liver mitochondria.31 A common feature of these compounds is their interaction with phospholipid membranes. Although these compounds may bind FtsZ in vitro, the mislocalization of membrane-associated proteins in vivo may be due to changes in the physicochemical properties of membranes that arise in response to the small molecules.
Several of these compounds share physicochemical characteristics with reported uncouplers of ΔpH and ΔΨ; the compounds are lipophilic weak acids that contain electron-withdrawing groups.32,33 We sought to test the hypothesis that their effect on FtsZ and other membrane-associated proteins in vivo arises from disrupting ΔΨ. We tested a panel of reported FtsZ inhibitors (Table 1) for their ability to deplete ΔΨ in B. subtilis 168 and determined whether the effect delocalized the cytoplasmic membrane-associated protein, MinD. In this paper we demonstrate that many of the small molecules identified as hits from various high-throughput screens against the bacterial protein FtsZ, depolarize the bacterial membrane and delocalize FtsZ non-specifically.
Results and discussion
Our primary motivation for evaluating putative FtsZ inhibitors for effects on membrane function and membrane-protein localization was two-fold: (1) to eliminate false-positives from the pool of available FtsZ inhibitors; and (2) to define chemical characteristics that target bacterial membranes. Small molecules that target membranes are currently being pursued for treating infections by slow or non-growing populations of bacteria34 and may be useful adjuvants for existing classes of antimicrobial agents.35For our studies, we used MinD translationally fused to green fluorescent protein (GFP) as a model membrane-associated protein for several reasons. (1) MinD plays a role in bacterial cell division and regulation of FtsZ activity in vivo.36,37 (2) MinD contains a well-characterized terminal amphipathic helix that associates with the cytoplasmic membrane.38 (3) MinD binds preferentially to anionic phospholipids, and the local organization of these lipids is thought to influence the position of the protein in vivo.39,40 In principle, disrupting ΔΨ should cause MinD to mislocalize in vivo. To test this hypothesis, we used Bacillus subtilis as a model Gram-positive bacterium. We chose B. subtilis because all the compounds we tested are reported to target FtsZ in Gram-positive cells; very few are active against Gram-negative bacteria. We tested compounds with broad-spectrum activity against B. subtilis 168 and E. coli MG1655.
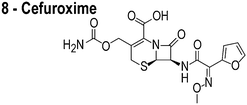
The compounds used in this study included: carbonyl cyanide m-chlorophenylhydrazone (CCCP, 1), 3Z1 (2), cinnamaldehyde (3), totarol (4), sanguinarine (5), viriditoxin (6), and PC190723 (7) (Table 1). We included cefuroxime (8) as a negative control as it is a therapeutic antibiotic that inhibits cell wall assembly in growing bacteria and should not perturb ΔΨ on the time scale of our experiments (e.g. 30 min) (Table 1). β-lactam antibiotics can depolarize bacterial membranes, but the response can take several hours depending on the antibiotic and the dosage.41
Antimicrobial and membrane potential activities of 1–8
We tested 1–8 as inhibitors of bacterial proliferation by determining their minimum inhibitory concentration (MIC) against B. subtilis strain 168 (Table 1). The majority of the compounds inhibited B. subtilis growth at μM concentrations; the exception was cinnamaldehyde, which had an MIC of 2.5 mM. We used the values of MIC to set the concentration for dosing cells and studied the resulting change in ΔΨ. To determine ΔΨ, we treated cells with 1–8 at 1× MIC for 5 min, exposed the cells to the membrane potential sensitive dye, 3,3′-diethyloxacarbocyanine iodide (DiOC2) for 15 min, and measured cell fluorescence using flow cytometry. DiOC2 is a fluorophore that emits at λemission = 530 nm in solution. When cells with a large ΔΨ are treated with DiOC2, the fluorophore concentrates at the cell membrane, self-associates, and its emission wavelength is shifted to λemission = 575 nm. The ratio of cell fluorescence emission at λ575/λ530 nm is an indicator of ΔΨ, and large values denote cells with a large intact transmembrane potential.In a typical experiment, we measured the fluorescence intensity of ∼10![[thin space (1/6-em)]](https://www.rsc.org/images/entities/char_2009.gif) 000 cells by flow cytometry. The result of compound treatment on ΔΨ is shown in Fig. 2. We used 1 as a positive control for these experiments: treating B. subtilis 168 cells with 1 at 1× MIC for 5 min produced a ratio of λ575/λ530 of 0.045, which indicated a large decrease in ΔΨ. As a negative control, we treated B. subtilis cells with 8 at 1× MIC for 20 min and observed no decrease in ΔΨ: λ575/λ530 was 0.306 ± 0.011 for 8 compared to 0.257 ± 0.003 for an untreated control. We found that the treatment of B. subtilis cells with compounds 2–5 at 1× MIC decreased λ575/λ530 indicating a significant reduction in ΔΨ. FtsZ inhibitors 6 and 7 did not perturb λ575/λ530 in our assay and thus have no effect on ΔΨ within the time scale of our experiments. We also performed fluorescence controls with 1–8 only (i.e., no cells) to confirm there was no competitive fluorescence emitted by 1–8 (Fig. S1A and B, ESI†). As the emission of 5 spans a region of the spectrum including λ575, we performed further controls to determine the magnitude of this signal compared to the fluorescence emission from DiOC2. We determined that the fluorescence of 5 was not significant compared to the DiOC2 signal emitted from labelled cells under the conditions used (Fig. S2, ESI†).
000 cells by flow cytometry. The result of compound treatment on ΔΨ is shown in Fig. 2. We used 1 as a positive control for these experiments: treating B. subtilis 168 cells with 1 at 1× MIC for 5 min produced a ratio of λ575/λ530 of 0.045, which indicated a large decrease in ΔΨ. As a negative control, we treated B. subtilis cells with 8 at 1× MIC for 20 min and observed no decrease in ΔΨ: λ575/λ530 was 0.306 ± 0.011 for 8 compared to 0.257 ± 0.003 for an untreated control. We found that the treatment of B. subtilis cells with compounds 2–5 at 1× MIC decreased λ575/λ530 indicating a significant reduction in ΔΨ. FtsZ inhibitors 6 and 7 did not perturb λ575/λ530 in our assay and thus have no effect on ΔΨ within the time scale of our experiments. We also performed fluorescence controls with 1–8 only (i.e., no cells) to confirm there was no competitive fluorescence emitted by 1–8 (Fig. S1A and B, ESI†). As the emission of 5 spans a region of the spectrum including λ575, we performed further controls to determine the magnitude of this signal compared to the fluorescence emission from DiOC2. We determined that the fluorescence of 5 was not significant compared to the DiOC2 signal emitted from labelled cells under the conditions used (Fig. S2, ESI†).
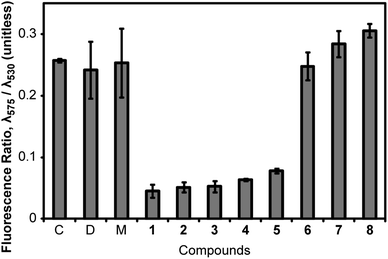 | ||
| Fig. 2 Measurement of the perturbation of ΔΨ of B. subtilis 168 cells by compounds 1–8. We determined the relative magnitude of ΔΨ of B. subtilis 168 cells by measuring the λ575/λ530 fluorescence emission intensity ratio of DiOC2 after excitation at λ488. A large value of λ575/λ530 represents a high ΔΨ. Labels ‘C’, ‘D’, and ‘M’ stand for control (untreated), DMSO, and methanol, respectively. Error bars represent two standard deviations from the mean (n = 3). | ||
Measuring the effect of 2–6 on the permeability of bacterial membranes
One mechanism by which small molecules can decrease ΔΨ is by disrupting the membrane and increasing the rate of diffusion of compounds across bilayers. We used propidium iodide (PI) to explore whether compounds 2–6 increased the permeability of B. subtilis membranes. PI has several characteristics that enable these measurements: (1) the cellular uptake of PI increases with increasing membrane permeability; (2) PI fluoresces upon binding to DNA (λemission = 620 nm); and (3) PI can be quantified using fluorescence microscopy or flow cytometry.41 Protonophores such as 1 decrease ΔΨ, however the resulting membranes inhibit passage of solutes other than protons. Thus, PI fluorescence does not increase in cells treated with protonophores.41 This response is similar to antibiotics such as daptomycin, which increases the flux of K+ ions across the membrane, but has no effect on PI uptake within 60 min after treatment.42We pretreated B. subtilis cells with compounds 1–8 at 1× MIC for 5 min, dosed cells with PI (100 μM), incubated for 30 min, and measured the fluorescence intensity at λemission = 620 nm. Fig. 3 summarizes the resulting fluorescence intensity of cells. Using the Kruskal–Wallis test, we found no significant difference between the solvent controls, 7, and 8. Pairwise comparison of solvent controls with 1–6 gave p-values of <0.001. We found that treating cells with 1 or 2 reduced their labelling with PI (compared to solvent control samples), suggesting that these compounds do not perturb membrane permeability. Instead, 1 and 2 decreased ΔΨ and eliminated the transport of the cationic fluorophore PI by the pmf. Treating B. subtilis 168 cells with 3–6 increased their permeability to PI. For 3–5, we observed a decrease in ΔΨ, suggesting that these compounds change global membrane properties or perturb proteins that form pores in the membrane.
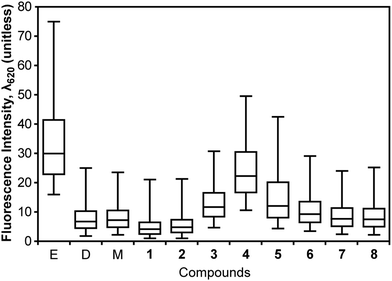 | ||
| Fig. 3 Effect of 1–8 on the integrity of B. subtilis 168 cell membranes. We measured the permeability of the cell membrane to PI by labeling B. subtilis 168 cells after treatment with compounds. We measured PI fluorescence intensity at λ620. Large values of fluorescence intensity represent an increasing membrane permeability to PI. Labels ‘E’, ‘D’, and ‘M’ stand for ethanol, DMSO, and methanol, respectively. Whisker plots display the median (center of the box), 25 to 75% of the population in the box, and 5 to 95% of the population between the outer whiskers. | ||
As a positive control, we treated B. subtilis cells with 70% ethanol, rinsed cells with 1× PBS to remove ethanol, labelled cells with PI, and measured their fluorescence. The membrane permeability of these cells increased and they were extensively labelled with PI. As a control, we measured the fluorescence properties of compounds (i.e. no cells; Fig. S3, ESI†). As the emission of 5 spans a region of the spectrum including λ620, we performed additional controls to determine if the signal would perturb the results of PI labelling. Unfortunately, the fluorescence of 5 contributed significantly in the cellular PI assay, which may account for the increase in fluorescence intensity observed (Fig. S4, ESI†).
Determining the membrane disrupting activity of 1–2, and 4 by measuring the oxygen consumption of myoblasts
The results of DiOC2 and PI fluorescence measurements in the presence of 2–6 indicated the compounds display two effects on bacterial membranes: (1) dissipation of ΔΨ without increasing permeability, which occurred in the presence of ionophores, including 1; and (2) dissipation of ΔΨ and an increase in membrane permeability. We chose to study compounds 2 and 4 as they each cause one of these phenotypes. As an indication of their therapeutic potential, we determined whether these model compounds dissipated the pmf in both bacteria and eukaryotes or preferentially altered bacterial membranes. We evaluated the effect of 1, 2, and 4 on the oxygen consumption rate (OCR) of C2C12 myoblast cells derived from mouse muscle cell tissue. The most widely used technique for detecting changes in ΔpH across membranes is to measure the rapid increase in oxygen consumption that occurs after treatment of cells with an uncoupling agent. Treatment with an uncoupling agent enables the rapid passage of protons back into the mitochondrial matrix. Consequently, the rate of electron transport increases to restore the pmf, resulting in increased oxygen consumption. For example, treating C2C12 myoblasts with 1 caused the OCR to increase and remain higher than the basal rate (Fig. 4); we observed a maximum OCR with 1 at a concentration of 0.6 μM. Fig. S5† demonstrates all of the data points obtained for C2C12 myoblast treatment with 2 (ESI†). The addition of 2 to myoblasts also increased the OCR; we observed the maximal OCR with 2 at 30 μM. These results demonstrate that 2 causes a loss of the pmf across the inner mitochondrial membrane, suggesting that it disrupts the membrane in both prokaryotes and eukaryotes. 4 did not cause a change in the OCR relative to controls, suggesting that this compound does not uncouple the pumping of protons from ATP production in eukaryotic membranes (Fig. S6A and B, ESI†).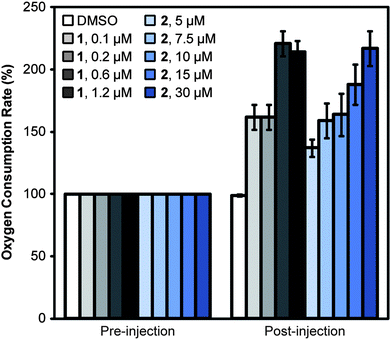 | ||
| Fig. 4 Measurement of the uncoupling activity of 1 and 2 in C2C12 myoblasts. We measured the OCR of C2C12 myoblasts before and after injection of 1, 2, or DMSO (the solvent control). The addition of protonophore 1 increased the OCR of C2C12 myoblasts. The addition of 2 also resulted in a rise in OCR, consistent with a depletion of the pmf. The maximum OCR was achieved at 0.6 μM of 1 and 30 μM of 2. Error bars represent two standard deviations of the mean (n = 8). | ||
Although the myoblast experiments in C2C12 cells did not inform us of the mechanism by which 1, 2, and 4 reduce ΔpH, which may be due to influencing ion transport, membrane permeability, or via other mechanisms, the data demonstrates that compounds 2 and 4 are less effective at reducing ΔΨ in eukaryotes than in prokaryotes. 2 required significantly higher concentrations—compared to its MIC against B. subtilis—to elicit a response from C2C12 cells. An analog of 2—2,2′-methylenebis(4-chlorophenol), also referred to as dichlorophen—is an anthelmintic agent and has been used to treat fungal infections. Dichlorophen is tolerated in rats and has a 50% lethal dose (LD50, in mg kg−1 of body weight) of 1506 (95% confidence interval [CI] 1310–1760) for males and 1683 (95% CI 1402–1986) for females.43 Evaluation of 2–6 in animal toxicity models would be an important step to assess their therapeutic potential.
Evaluating proton transport across the membrane of bacteria treated with 1–8
The bacterial membrane regulates the transport of a variety of ions, including protons. To test whether 2–6 disrupted ΔΨ by functioning as protonophores, pore-forming agents, or through other membrane disruption mechanisms we studied whether these compounds relaxed ΔpH in B. subtilis 168 cells. Protonophores and pore-forming agents reduce the energetic barrier to proton transport across membranes and eliminate ΔpH. We assayed the protonophore activity of 1–8 by measuring the change in the external pH (ESI†). We created a large ΔpH in cells in a high-density culture (∼3 × 10¹⁰ cells per mL) by reducing the external pH to 6. Equilibration of the external pH with the internal pH results in an increase in the external pH value. 1 has been described as a protonophore that catalytically equilibrates ΔpH. We found that the equilibration of ΔpH by 1 was rapid.We tested 2–6 and found their effect on cells to be similar to the solvent controls (Fig. S7A and B, ESI†): namely, treatment of B. subtilis cells with 2–6 had no significant effect on ΔpH. Only cells treated with 1 at its MIC value dissipated the artificial ΔpH. The results suggest that 2–6 are not catalytic protonophores in contrast to 1, which transports protons across the membrane. Although the artificial ΔpH was not equilibrated by 2–6, it remains possible that the ΔpH and ΔΨ of these cells decreased and was not detectable in our experiments. Another limitation may be the significant difference in the amount of membrane present in the ΔpH experiments (∼3 × 10¹⁰ cells per mL) compared to MIC or DiOC2 and PI labelling experiments (∼5 × 10⁵ or ∼1 × 10⁸ cells per mL). The activity of 2–6 may require a threshold lipid-to-inhibitor ratio before the effect is observed. The addition of 2 to B. subtilis cells at a concentration that increased the OCR in C2C12 myoblasts (30 μM, ∼200 times greater than its MIC) equilibrated the artificial ΔpH (Fig. S6B, ESI†). Our observation that a high concentration of 2 is required to observe the relaxation of the ΔpH may suggest a relationship between the concentration of lipids and the activity of this compound in vivo.
Mislocalization of membrane-associated proteins in cells by 2–6
Having established that 2–5 reduced ΔΨ and 3–6 increased the membrane permeability of B. subtilis cells, we were interested in whether these physiological changes mislocalized membrane-associated proteins. Significant fluorescence interference from 5 prevented us from including 5 in the localization study (Fig. S8, ESI†). The distribution of GFP-MinD in B. subtilis cells treated with 1–4 and 6 resulted in reduction of localized MinD fluorescence, as shown in Fig. 5. Treatment of cells with 7 and 8 resulted in localization of MinD and was consistent with controls. This result suggests that depletion of ΔΨ and/or increasing membrane permeability with 2–6 mislocalizes proteins that are positioned at membranes, such as FtsZ. MinD localization in E. coli is dynamic and has a time-averaged position at the poles. Treatment of E. coli cells with 1 or 2 resulted in a change in the distribution of MinD relative to the normal time-averaged polar localization with DMSO treatment, as shown in Fig. 6. The addition of 1 resulted in the diffusion of MinD fluorescent signal throughout the cell. Treatment of cells with 2 reduced the number of MinD foci and increased the dispersion of the fluorescent protein throughout many of the cells. Although 2–6 are described as FtsZ inhibitors, they display a broad range of effects in vivo that are consistent with membrane activity, rather than a specific effect on FtsZ. This activity results in the delocalization of membrane-associated proteins, which perturbs pathways involved in division and cell shape and may be ultimately responsible for the phenotypes observed in vivo.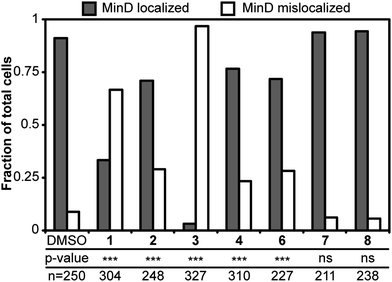 | ||
| Fig. 5 Localization of MinD in B. subtilis cells treated with 1–8. Grey bars and white bars represent cells with MinD localization and without MinD localization, respectively. The addition of 1–6 reduced the localization of MinD. Localization of MinD to the poles and the midcell of dividing cells remained normal in the DMSO solvent control. P-values from a Fisher's exact test comparing DMSO with treatments are represented as *** for p < 0.001 and ns as not significant. The p-values for 7 and 8 are 0.3778 and 0.1644, respectively. The number of cells analyzed in each treatment is listed as ‘n’. | ||
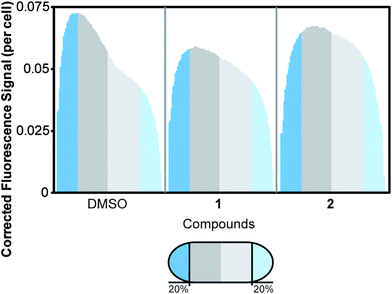 | ||
| Fig. 6 Distribution of MinD in E. coli cells following treatment with 1 or 2. We normalized the cell length to average the distribution of fluorescence. The cells were organized with the brightest half of the cell oriented on the left. The normalized cell length is shown in 100 divisions, with the first and last 20% of cell length labeled in blue. The remainder of the cell is divided in half by dark and light grey segments. The number of cells assayed for each treatment is as follows: DMSO (n = 123), 1 (n = 111), and 2 (n = 147). The addition of 1 resulted in diffuse MinD localization throughout the cell, as opposed to the time-averaged polar localization observed in the DMSO solvent control. Addition of 2 also resulted in a significant reduction in the dynamic localization of MinD to the poles; the fluorescence of the resulting cells was disperse. | ||
Conclusions
The activity of ionophores, permeabilizing agents, and molecules that dissipate ΔΨ perturb the localization of important bacterial cell shape and division proteins. These proteins rely on ΔΨ for their localization and function in vivo.10 Significant effects on cell division and morphology should be expected to accompany changes in ΔΨ. Although 2–6 are not specific FtsZ inhibitors in vivo, studies of their function can contribute to an understanding how membrane active compounds disrupt cellular physiology. Our results indicate that dissipation of ΔΨ is an important phenotype for evaluating inhibitors of FtsZ and other membrane-associated proteins. The mislocalization of these proteins may cause a misinterpretation of the mechanism of action of these compounds in vivo. This effect is particularly germane if the compounds are applied to studying proteins in live cells. These studies provide a foundation for testing inhibitors of proteins that regulate bacterial cell shape and division for membrane activity to reveal their real targets in vivo.Materials and methods
Determination of antimicrobial susceptibility
We grew bacteria using the conditions in parenthesis to determine minimum inhibitory concentrations (MICs): E. coli strain MG1655 wildtype strain (Luria–Bertani [LB] media, 30 °C, 200 rpm shaking, 14 h) and B. subtilis strain 168 (LB media, 37 °C, 200 rpm shaking, 16 h). We diluted cultures to 5 × 10⁵ cells per mL in growth media for the starting inoculum. The compounds tested include carbonyl cyanide m-chlorophenylhydrazone (CCCP, 1), zantrin 3Z1 (2), cinnamaldehyde (3), totarol (4), sanguinarine (5), viriditoxin (6), PC190723 (7), and cefuroxime (8). Compounds 1 (≥97%), 3 (≥99%), 5 (≥98%), and 8 (≥99%) were from Sigma with the purity indicated in parenthesis. We synthesized 2, 4, 6, and 7 according to previously published methods.44–47 We dissolved compounds in DMSO with the exception of sanguinarine, which we dissolved in methanol.We performed MIC measurements using the macro-dilution technique according to the NCCLS guidelines.48 To create a two-fold dilution series for the macrodilution technique, we added each compound to the first culture tube (4 mL total volume) at the highest concentration. We diluted 2 mL of this culture into an equal volume of inoculated media (a two-fold dilution). The final volume for each culture was 2 mL. We prepared solvent controls and sterility controls using the same concentration of solvent as the tubes containing the highest concentration of antibiotic. We determined the macrodilution MIC endpoints in triplicate by identifying the lowest concentration of compound that completely inhibited growth by visual inspection.
Flow cytometry, DiOC2 labeling, propidium iodide labeling
We used flow cytometry to measure the extent of membrane potential depletion. DiOC2 associated with membranes exhibits red fluorescence (λexcitation = 488 nm, λemission = 575 nm), whereas cytosolic DiOC2 has green fluorescence (λexcitation = 488 nm, λemission = 530 nm). The depletion of ΔΨ reduces the concentration of DiOC2 associated with the membrane and decreases the λ575/λ530 ratio of DiOC2. We measured the ratio of λ575/λ530 using flow cytometry. We filtered cell suspensions labelled with 30 μM DiOC2 through a Nylon filter containing 60 μm diameter pores. For each sample, we acquired 10000 data points using a BD LSRII flow cytometer and analyzed the data using FlowJo v7.6.4. We also used flow cytometry to measure the permeability of the membrane using 100 μM PI. PI is impermeable to cells with intact membranes regardless of ΔΨ.41 PI diffuses into cells that have disrupted membranes, binds DNA, and produces a fluorescent DNA-PI complex (λexcitation = 488 nm, λemission = 620 nm). We performed pair-wise comparison of PI data sets by the Kruskal–Wallis test using the program GraphPad InStat 3.
Oxygen consumption in myoblasts treated with 1, 2, and 4
We measured the OCR using a Seahorse Biosciences XF96 Extracellular Flux Analyzer as previously described with minor alterations.49 We seeded C2C12 mouse myoblasts in XF96 cell culture microplates (Seahorse Biosciences) at 12000 cells per well in DMEM high glucose medium (Invitrogen) containing 10% FBS, 100 units per mL penicillin, and 100 μg mL−1 streptomycin and incubated the cells at 37 °C and 5% CO2 for approximately 18 h. Prior to measurements, we exchanged the growth media for XF Assay Medium (Seahorse Biosciences) supplemented with 25 mM glucose (Sigma) and incubated the plate at 37 °C for 60 min. We preloaded compounds dissolved in nutrient media to the reservoirs and injected these solutions into the assay wells during experiments. OCR measurements consisted of a 3 min mixing period followed by the measurement of oxygen consumption over a 5 min time interval.
Fluorescence microscopy of fusion proteins sensitive to ΔΨ
We grew B. subtilis DS4294 (amyE::Pxyl-gfp-minD, catR) to exponential phase (λ = 600 nm, 0.4–0.7) in LB with incubation at 30 °C and 200 rpm shaking. We diluted cultures with LB to a λ = 600 nm of 0.4 and induced GFP-MinD production by adding xylose to the media to a final concentration of 0.1% (w/v) followed by incubating for 75 min. After induction, we treated cells with 1–8 at 1× MIC concentration or DMSO solvent controls for 20 min before imaging. We pipetted suspensions of treated cells on 1% (w/v) agarose pads containing 1× phosphate buffered saline (PBS) infused with 1–8 at 1× MIC or DMSO. We performed epifluorescence microscopy on a Nikon Eclipse TE2000-E microscope equipped with PFS using a Nikon Plan Apo 100×/1.40 phase contrast oil objective, a 1.5× optivar, and an Andor iXonEM CCD camera. We imaged cells with phase contrast and fluorescence at an excitation λ = 484 nm and emission λ = 520 nm using an EXFO X-cite® series 120 lamp and collected data using MetaMorph software (version 7.5.6.0, MDS Analytical Technologies). We imaged cells from at least three separate induction experiments for each compound; we also performed controls using DMSO (negative control) and 1 (positive control) for each induction. After transferring the cells to agarose pads, we imaged cells within 10 min.We grew E. coli MG1655 pFX9 (Plac-gfp-minD-minE) to early exponential phase (λ = 600, 0.3–0.4) in LB with incubation at 30 °C and 200 rpm shaking. We induced GFP-MinD and MinE production by adding IPTG to the media to a final concentration of 50 μM and incubating for 75 min. We treated induced cells with a 1× MIC concentration of 1, 2, or DMSO solvent for 20 min before imaging. We pipetted suspensions of treated cells on 1% (w/v) agarose pads infused with 1× PBS containing 1 or 2 at their 1× MIC value (or DMSO). We imaged cells from at least three separate induction experiments for 1, 2, and DMSO. After transferring the cells to agarose pads, we imaged cells within 10 min.
Image analysis to evaluate fluorescent protein localization in cells treated with 1–8
We grouped phase contrast and fluorescence images for data analysis using the MicrobeTracker Suite (version 0.930, Emonet Lab, Jacobs-Wagner Lab; Yale University) running in MATLAB (version 7.13.0.564 R2011b, Mathworks). We used MicrobeTracker to define the outer edge of the cells. We corrected background fluorescence signal for each cell using a line scan with the cell segmented into ∼1 pixel steps. We processed line scan data with a custom MATLAB script. The script first normalized the fluorescence signal for the area of each segment. Cell segments were ordered such that the brightest half of the cell (corrected fluorescence) had the first segment number. To find peaks in the corrected fluorescence signal for B. subtilis cells, we used the PeakFinder MATLAB script.50 We recorded peak locations as percent of cell length by dividing the segment number for the peak by the total segments for the respective cell. We analyzed the concatenated data sets to compare the distribution of fluorescent peaks for each set of experimental conditions. We performed Fisher's exact test using the two categories (i.e., cells with localization and cells without localization) to obtain p-values for the comparison of DMSO or 1–8 treated B. subtilis cells. To evaluate the localization of MinD in E. coli cells treated with compounds, we divided the cell into 100 segments (i.e. bins) to generate histograms. We assigned the corrected fluorescence signal of each segment to each respective bin. We calculated bins overlapping two segments by summing the fractions of the adjacent segments. Using this approach, we analyzed the fluorescence distribution for cells treated with different compounds.Acknowledgements
We thank Prof. Daniel Kearns for B. subtilis strain DS4294. We acknowledge the Human Frontiers Science Program (RGY0069/2008-C103), USDA (WIS01192), NIH (1DP2OD008735-01), and an Alfred P. Sloan Research Fellowship (D.B.W.) for funding this research. C.I.G., N.A.S., and J.T.S. acknowledge research support from NIH/NIAID (R01AI08093).References
- E. F. Bi and J. Lutkenhaus, Nature, 1991, 354, 161–164 CrossRef CAS.
- S. G. Addinall, C. Cao and J. Lutkenhaus, J. Bacteriol., 1997, 179, 4277–4284 CAS.
- Y. Wang, B. D. Jones and Y. V. Brun, Mol. Microbiol., 2001, 40, 347–360 CrossRef CAS.
- R. B. Weart, A. H. Lee, A. C. Chien, D. P. Haeusser, N. S. Hill and P. A. Levin, Cell, 2007, 130, 335–347 CrossRef CAS.
- B. Michel, PLoS Biol., 2005, 3, e255 CrossRef.
- C. Janion, Int. J. Biol. Sci., 2008, 4, 338–344 CrossRef CAS.
- T. G. Bernhardt and P. A. de Boer, Mol. Cell, 2005, 18, 555–564 CrossRef CAS.
- L. J. Wu, S. Ishikawa, Y. Kawai, T. Oshima, N. Ogasawara and J. Errington, EMBO J., 2009, 28, 1940–1952 CrossRef CAS.
- A. A. Handler, J. E. Lim and R. Losick, Mol. Microbiol., 2008, 68, 588–599 CrossRef CAS.
- H. Strahl and L. W. Hamoen, Proc. Natl. Acad. Sci. U. S. A., 2010, 107, 12281–12286 CrossRef CAS.
- B. Ehrenberg, V. Montana, M.-D. Wei, J. P. Wuskell and L. M. Loew, Biophys. J., 1988, 53, 785–794 CrossRef CAS.
- P. Breeuwer and T. Abee, Assessment of the Membrane Potential, Intracellular pH and Respiration of Bacteria Employing Fluorescence Techniques, Kluwer Academic Publishers, 2004 Search PubMed.
- D. N. Margalit, L. Romberg, R. B. Mets, A. M. Hebert, T. J. Mitchison, M. W. Kirschner and D. RayChaudhuri, Proc. Natl. Acad. Sci. U. S. A., 2004, 101, 11821–11826 CrossRef CAS.
- P. Domadia, S. Swarup, A. Bhunia, J. Sivaraman and D. Dasgupta, Biochem. Pharmacol., 2007, 74, 831–840 CrossRef CAS.
- R. Jaiswal, T. K. Beuria, R. Mohan, S. K. Mahajan and D. Panda, Biochemistry, 2007, 46, 4211–4220 CrossRef CAS.
- T. K. Beuria, M. K. Santra and D. Panda, Biochemistry, 2005, 44, 16584–16593 CrossRef CAS.
- J. Wang, A. Galgoci, S. Kodali, K. B. Herath, H. Jayasuriya, K. Dorso, F. Vicente, A. Gonzalez, D. Cully, D. Bramhill and S. Singh, J. Biol. Chem., 2003, 278, 44424–44428 CrossRef CAS.
- D. W. Adams, L. J. Wu, L. G. Czaplewski and J. Errington, Mol. Microbiol., 2011, 80, 68–84 CrossRef CAS.
- D. Rai, J. K. Singh, N. Roy and D. Panda, Biochem. J., 2008, 410, 147–155 CrossRef CAS.
- T. K. Beuria, P. Singh, A. Surolia and D. Panda, Biochem. J., 2009, 423, 61–69 CrossRef CAS.
- M. H. Foss, Y. J. Eun and D. B. Weibel, Biochemistry, 2011, 50, 7719–7734 CrossRef CAS.
- M. H. Foss and D. B. Weibel, Antimicrob. Agents Chemother., 2010, 54, 3988–3990 CrossRef CAS.
- H. I. Ingolfsson, R. E. Koeppe, 2nd and O. S. Andersen, Biochemistry, 2007, 46, 10384–10391 CrossRef CAS.
- W. C. Hung, F. Y. Chen, C. C. Lee, Y. Sun, M. T. Lee and H. W. Huang, Biophys. J., 2008, 94, 4331–4338 CrossRef CAS.
- E. C. Smith, G. W. Kaatz, S. M. Seo, N. Wareham, E. M. Williamson and S. Gibbons, Antimicrob. Agents Chemother., 2007, 51, 4480–4483 CrossRef CAS.
- H. Haraguchi, S. Oike, H. Muroi and I. Kubo, Planta Med., 1996, 62, 122–125 CrossRef CAS.
- V. Micol, C. R. Mateo, S. Shapiro, F. J. Aranda and J. Villalain, Biochim. Biophys. Acta, 2001, 1511, 281–290 CrossRef CAS.
- C. R. Mateo, M. Prieto, V. Micol, S. Shapiro and J. Villalain, Biochim. Biophys. Acta, 2000, 1509, 167–175 CrossRef CAS.
- E. Seifen, R. J. Adams and R. K. Riemer, Eur. J. Pharmacol., 1979, 60, 373–377 CrossRef CAS.
- T. L. Serafim, J. A. Matos, V. A. Sardao, G. C. Pereira, A. F. Branco, S. L. Pereira, D. Parke, E. L. Perkins, A. J. Moreno, J. Holy and P. J. Oliveira, Biochem. Pharmacol., 2008, 76, 1459–1475 CrossRef CAS.
- D. T. Wong and R. L. Hamill, Biochem. Biophys. Res. Commun., 1976, 71, 332–338 CrossRef CAS.
- R. A. Nicholas and G. W. Ordal, Biochem. J., 1978, 176, 639–647 CAS.
- H. Terada, Environ. Health Perspect., 1990, 87, 213–218 CrossRef CAS.
- J. G. Hurdle, A. J. O'Neill, I. Chopra and R. E. Lee, Nat. Rev. Microbiol., 2011, 9, 62–75 CrossRef CAS.
- L. Ejim, M. A. Farha, S. B. Falconer, J. Wildenhain, B. K. Coombes, M. Tyers, E. D. Brown and G. D. Wright, Nat. Chem. Biol., 2011, 7, 348–350 CrossRef CAS.
- L. Rothfield, A. Taghbalout and Y. L. Shih, Nat. Rev. Microbiol., 2005, 3, 959–968 CrossRef CAS.
- Z. Hu and J. Lutkenhaus, Mol. Microbiol., 1999, 34, 82–90 CrossRef CAS.
- Z. Hu and J. Lutkenhaus, Mol. Microbiol., 2003, 47, 345–355 CrossRef CAS.
- E. Mileykovskaya, I. Fishov, X. Fu, B. D. Corbin, W. Margolin and W. Dowhan, J. Biol. Chem., 2003, 278, 22193–22198 CrossRef CAS.
- L. D. Renner and D. B. Weibel, Proc. Natl. Acad. Sci. U. S. A., 2011, 108, 6264–6269 CrossRef CAS.
- D. J. Novo, N. G. Perlmutter, R. H. Hunt and H. M. Shapiro, Antimicrob. Agents Chemother., 2000, 44, 827–834 CrossRef CAS.
- J. A. Silverman, N. G. Perlmutter and H. M. Shapiro, Antimicrob. Agents Chemother., 2003, 47, 2538–2544 CrossRef CAS.
- T. B. Gaines and R. E. Linder, Fundam. Appl. Toxicol., 1986, 7, 299–308 CrossRef CAS.
- N. A. Sorto, M. M. Olmstead and J. T. Shaw, J. Org. Chem., 2010, 75, 7946–7949 CrossRef CAS.
- Y. S. Park, C. I. Grove, M. Gonzalez-Lopez, S. Urgaonkar, J. C. Fettinger and J. T. Shaw, Angew. Chem., Int. Ed., 2011, 50, 3730–3733 CrossRef CAS.
- M. B. Kim and J. T. Shaw, Org. Lett., 2010, 12, 3324–3327 CrossRef CAS.
- A. A. Moshfegh, B. Mazandarani, A. Nahid and G. H. Hakimelahi, Helv. Chim. Acta, 1982, 65, 1229–1232 CrossRef CAS.
- NCCLS, National Committee for Clinical Laboratory Standards, Wayne, PA, 2000, vol. 20 Search PubMed.
- D. G. Nicholls, V. M. Darley-Usmar, M. Wu, P. B. Jensen, G. W. Rogers and D. A. Ferrick, J. Visualized Exp., 2010, e2511 Search PubMed.
- N. Yoder, MATLAB Central, 14 June 2011 Search PubMed.
Footnote |
| † Electronic supplementary information (ESI) available: Supplemental methods and figures can be found in the supplemental information. See DOI: 10.1039/c2md20127e |
| This journal is © The Royal Society of Chemistry 2013 |