 Open Access Article
 This Open Access Article is licensed under a
 Creative Commons Attribution 3.0 Unported Licence
Predicting drug–target interactions through integrative analysis of chemogenetic assays in yeast†
Marja A.
Heiskanen
ab and
Tero
Aittokallio
*abc
aBiomathematics Research Group, Department of Mathematics, University of Turku, FI-20014, Finland
bFinnish Doctoral Programme in Computational Sciences (FICS), Aalto University, School of Science, FI-00076, Finland
cInstitute for Molecular Medicine Finland (FIMM), University of Helsinki, FI-00014, Finland. E-mail: tero.aittokallio@fimm.fi
First published on 31st January 2013
Abstract
Chemical-genomic and genetic interaction profiling approaches are widely used to study mechanisms of drug action and resistance. However, there exist a number of scoring algorithms customized to different experimental assays, the relative performance of which remains poorly understood, especially with respect to different types of chemogenetic assays. Using yeast Saccharomyces cerevisiae as a test bed, we carried out a systematic evaluation among the main drug target analysis approaches in terms of predicting global drug–target interaction networks. We found drastic differences in their performance across different chemical-genomic assay types, such as those based on heterozygous and homozygous diploid or haploid deletion mutant libraries. Moreover, a relatively small overlap in the predicted targets was observed between those approaches that use either chemical-genomic screening alone or combined with genetic interaction profiling. A rank-based integration of the complementary scoring approaches led to improved overall performance, demonstrating that genetic interaction profiling provides added information on drug target prediction. Optimal performance was achieved when focusing specifically on the negative tail of the genetic interactions, suggesting that combining synthetic lethal interactions with chemical–genetic interactions provides highest information on drug–target interactions. A network view of rapamycin-interacting genes, pathways and complexes was used as an example to demonstrate the benefits of such integrated and optimized analysis of chemogenetic assays in yeast.
Introduction
Accurate identification of the cellular targets of chemical compounds is a critical prerequisite for a rational drug development process. Systematic analysis of target interactions for a drug candidate enables a more global mapping of the biological pathways and networks that are affected by the chemical treatment. Such network maps may offer insights into the compound's mode of action, toward better understanding of its genotype-specific sensitivity or resistance. Systematic prediction of the spectrum of potential drug–target interactions, ranging from the compound's intended primary targets to secondary or “off-targets”, provides therefore the basis for the development of more effective therapeutic options that can avoid severe side-effects.A number of experimental–computational strategies have been introduced over the past decade for systematic analysis of drugs and their targets.1–3 In particular, by taking advantage of the genome-wide deletion-mutant collections in yeast Saccharomyces cerevisiae, it has become possible to measure genome-scale growth phenotype responses to combined genetic and chemical perturbations, thereby enabling systematic means to identify candidate drug targets in vivo. Such chemical-genetic profiling approaches to discovering molecular targets and mechanisms of action of compounds involve various experimental assays, such as those based on drug-induced haploinsufficiency profiling (HIP) or homozygous deletion profiling (HOP), as well as their integration with genetic interaction profiling.2,3 These profiling assays generate a rich source of high-dimensional datasets, and custom-designed computational data analysis methods have been tailored for mining the data from different experimental assays.4–7
Despite the widespread application of the chemical-genomic and genetic profiling approaches, there is only rather scattered information available on the performance of various experimental assays and customized computational solutions in terms of their relative accuracy at predicting drug–target interactions. For instance, the heterozygous deletion strain collection has been considered as being more effective for identification of direct targets of chemicals, while the homozygous diploid or haploid deletion mutant collections are being used to identify genes involved in buffering the drug target pathways.2,3,5 However, to our knowledge, there are no systematic studies of their relative performance on a common set of shared chemicals and gene deletion mutants. Another open question, directly related to the experimental costs of conducting such assays, concerns whether the genetic interaction profiling of double-deletion mutants can really provide any added information on drug target prediction beyond that obtained from the HIP or HOP approaches alone.
In addition to such experimental design questions, there is no general consensus on a computational scoring approach that, on the basis of the experimental data, would most accurately rank the genes according to their likelihood of being a target of a particular compound. For instance, target identification in the HIP approach is typically based on the fitness defect, the so-called FD-score, which implies that the heterozygous mutant deleted for the drug target shows an increased sensitivity to the particular compound.4,6,8 In the HOP approach, on the other hand, the haploid or homozygous diploid deletion of the target or another gene in the same pathway may also lead to increased resistance.9 Moreover, despite the development of customized methods based on profile correlation,7 or the so-called I-score,9 it remains unclear what is the most effective way to compare the drug–mutant relationships (either sensitivity or resistance) with the double-mutant fitness phenotypes obtained from genetic interaction profiling.
In the present work, we systematically compared various drug target profiling and scoring strategies using genome-wide datasets on S. cerevisiae, with the aim of evaluating their relative merits and potential limitations, especially with respect to scoring positive and negative fitness responses to chemical treatments. We also introduce here a novel scoring approach, named SR-score, which combines the rankings from two scoring methods in such a manner that it places special emphasis on the early target recognition. The systematic evaluation was carried out using the curated STITCH database of known and predicted drug–gene interactions as an external benchmark set. We further investigate the reproducibility of the target gene rankings using the replicate measurements from the chemical-genomic assays as an internal control. Statistical inference was used to assess the significance of the differences observed. Finally, the optimized methods were applied to construction of an integrated drug–target interaction network for rapamycin treatment.
Materials and methods
Datasets
To carry out a systematic comparative evaluation among the different approaches to score drug–target interactions, we utilized publicly available datasets from genome-wide studies in yeast Saccharomyces cerevisiae.4,10,11 In order to provide a direct and unbiased comparison of the scoring results, we selected only those gene deletion strains present in both the chemical-genomic and genetic interaction datasets. The datasets and the evaluation setup are illustrated in Fig. S1 (ESI†).Chemical-genomic datasets
Two of the chemical-genomic datasets were obtained from the yeast whole-genome heterozygous and homozygous diploid deletion collections.4 The entire datasets consist of 5337 and 4769 deletion strains grown under 726 and 418 treatment conditions for heterozygous and homozygous deletion collections, respectively. Here, we have completely excluded the double-drug experiments and experiments concerning environmental stress conditions. Some of the drugs were screened at various concentrations and time-points. In such cases, the experiment performed at the lowest concentration with a non-missing value was selected, since drug's specificity decreases as concentration approaches toxicity.6,12 In a few cases, multiple experiments met this criterion; in those cases median of the measured fitness defects at the lowest concentration was obtained. After collapsing the drug treatments and including only those deletion strains present in the genetic interaction dataset, the dimensions of the data matrices were 1176 × 325 for the heterozygous and 1319 × 134 for the homozygous dataset, with 3% and 10% missing data values, respectively.The third chemical-genomic dataset consists of 4111 yeast haploid deletion strains grown in 82 different chemicals or natural product extracts.11 After including those gene deletion strains present in the genetic interaction dataset, the dimension of the haploid dataset is 1256 × 82, with 2% missing data values.
Genetic interaction dataset
The quantitative genetic interaction profiles used in this study were obtained from a recent genome-wide synthetic genetic array (SGA) study.10 The whole dataset consists of 1711 haploid query gene deletion strains crossed to 3885 haploid array gene deletion strains. After obtaining those deletion strains present in the heterozygous, homozygous, and haploid chemical-genomic datasets, the dimensions of the respective n × m SGA matrices were 1176 × 3332, 1319 × 3857, and 1256 × 3367, respectively, where n is the number of query gene deletion strains and m is the number of array gene deletion strains. We used the recommended dataset with a lenient cut-off, where only statistically significant genetic interactions are included (p < 0.05).13 The rate of the statistically insignificant or missing data values of the resulting data matrices was 89% in all cases.Scoring methods
In the present work, we systematically evaluated the performance of three previously introduced scoring methods used in drug target prediction (FD-score, ρ-score and I-score). These methods are described in more detail in our previous work.14 Here, we also propose a new scoring method (named SR-score), and show that it provides robust performance when evaluated using the three chemical-genomic datasets.All of these scoring methods result in a unique ranking of each drug–target pair. There are also other approaches, such as hierarchical clustering or the factorgram method,11 which allow visualizing and clustering chemicals and gene deletion strains into functionally relevant groups with similar biological effects in an efficient way. However, such exploratory approaches were not considered in the present study.
FD-score
The fitness defect is based on the log-ratio of the growth defect of a deletion strain in response to a chemical treatment, relative to its growth without the treatment. Formally, for gene deletion strain i and chemical c, the FD-score is defined aswhere wic is the growth fitness of the strain i in the presence of the chemical c and
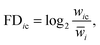
 is the average growth rate of the gene deletion strain i measured under multiple control conditions without the chemical treatment. A gene deletion strain with a negative FD-score is defined as sensitive to the treatment, and therefore the negative tail of the FD-score distribution has been used to reveal potential drug–target interactions.2,4,6,15
ρ-Score
The ρ-score is based on the Pearson correlation coefficient of the chemical-genetic and genetic interaction profiles.3,7,10,11 Formally, for two gene deletion strains i and j, the genetic interaction score εij is| εij = wij − wiwj, |
where

 is the mean of the fitness defects for the chemical c and
  is the mean of the genetic interaction scores for the query gene deletion strain i. Only those pairs of FDkc and εik, k = 1, 2,…,m, with non-missing values in both scores were included in the calculation of ρic. Potential drug–target interactions are inferred according to the positive tail of the ρ-score distribution. Notably, since the calculation of the ρ-score is based on the whole profiles, it is more robust against the missing values in the datasets than the FD-score, which is based on single measurements.
We also tested alternative variants of the ρ-score, based either on the Spearman correlation coefficient or a simple overlap statistic7,10 of the most sensitive (or resistant) gene deletion strains in the chemical-genomic and genetic interaction profiles. However, the Pearson correlation-based ρ-score was selected since it showed the best performance (data not shown).
I-score
The I-score was recently introduced to combine the FD- and ρ-scores after applying Z-score normalization to both of them individually.9 The Z-score normalization for gene deletion strain i and chemical c using scoring approach X is defined aswhere
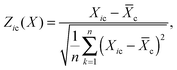
 is the mean of the scores obtained using the scoring approach X for the chemical c. In the original work,9 the absolute values of the Z-score-normalized FD-scores were used. Thus, the I-score is formally defined as
| Iic = |Zic(FD)| + Zic(ρ). |
The positive tail of the I-score distribution identifies the potential drug–target interactions. A missing value in either of the scores FDic or ρic results in a missing value in Iic as well.
SR-score
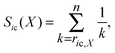
The new scoring method proposed in this work combines the ranks obtained by the FD-score and the ρ-score in such a way that it gives more weight on the top-ranking genes. First, the gene deletion strains are ranked within each chemical according to their FD- and ρ-scores, so that the most sensitive (negative) FD-scores and the highest (positive) ρ-scores obtain the top ranks. The ranks are then transformed into the Savage-scores.16 More specifically, for a scoring approach X, the Savage-score for a gene deletion strain i and chemical c is formally defined aswhere ric,X is the rank of the gene deletion strain i in the chemical treatment c obtained using the scoring approach X, and n is the maximal rank (1176 in the heterozygous, 1319 in the homozygous, and 1256 in the haploid dataset). Thus, the smaller the rank, the higher the Savage-score. For gene deletion strain i and chemical c, the SR-score is the distance of point (Sic(FD), Sic(ρ)) from the origin; more formally
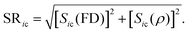
The operation of the SR-score is illustrated in Fig. S2 (ESI†). The positive tail of the SR-score identifies potential drug–target interactions.
There are many fundamental differences between the SR- and the I-score. First, since the Savage-score is based on ranks, the ranges of the Savage-scores are always equal for both of the FD- and ρ-scores, making it robust against possible outliers. In the I-score, either one of the Z-score-normalized FD- or ρ-distributions may spread wider than the other, thus putting more emphasis on the tail of the wider distribution. Second, the FD- and ρ-scores often result in somewhat complementary rankings. Whereas the I-score puts equal weights on all observations, the SR-score stresses more the top-ranking targets and gives only minor emphasis on later ranks. Thus, a poor performance of either one of the FD- or ρ-score does not mask the good performance of the better approach, while good performance of both of the approaches is further enhanced in the calculation of the SR-score. Finally, the SR-score can be calculated even if one or both of the FD- or ρ-scores is missing; in such cases, a gene deletion strain with a missing value is just ranked last in the first step.
Evaluation setup and measures
The performance of each of the four scoring approaches was evaluated using drug–gene interactions retrieved from the STITCH database (external evaluation), and the reproducibility of the rankings obtained by the different approaches was assessed using replicate measurements present in the homo- and heterozygous datasets (internal evaluation). The workflow for the evaluations is illustrated in Fig. S1 (ESI†).STITCH drug–gene interactions
We assessed the performance of each scoring method using a set of known and predicted drug–gene interactions retrieved from the STITCH 3 database.17 In STITCH, the combined score is assigned for each interaction based on scores derived from experiments, expert-curated databases and literature by means of text mining. We excluded links whose combined score is based only on putative homologs from other species. In addition, those links that originate from the datasets used in the present work or other research work of the respective laboratories were excluded. In the heterozygous dataset, 104 chemicals had at least one STITCH link, and in total 893 STITCH links were used in the evaluation. The corresponding numbers were 63 and 51 chemicals, and 934 and 795 STITCH links for the homozygous and haploid datasets, respectively.Replicate measurements
In order to evaluate the consistency of the results obtained by the different scoring approaches, we used replicate measurements present in the homo- and heterozygous chemical-genomic profiles. We considered the experiments with identical chemical, time-point, concentration and scanner used to measure the array intensities as replicate measurements. A few experiments were conducted with multiple replicate measurements; here, we selected the cases with two replicates, leading to 118 and 106 replicate measurements for the heterozygous and homozygous datasets, respectively. The haploid dataset was not considered in this analysis because of the lack of replicate measurements.Performance curves
The performance of each scoring approach was assessed by plotting the proportion of successes as a function of the rank. Here, ‘success’ refers either to recovering a STITCH link (evaluation based on an external test set) or recovering a link that was also recovered by a replicate measurement (evaluation based on an internal control). The overall performance was summarized using the area under the performance curve (AUC). The AUC values are reported as normalized values using the equationwhere AUCrandom is the area obtained by a random scoring, whereas AUCmax is the area obtained by the optimal scoring. Thus, the normalized AUC is 0.5 for a random scoring and 1 for the ideal scoring. The performance curve of a random scoring is obtained from a hypergeometric distribution; let r denote the rank, C the number of the drug treatments, n the number of gene deletion strains, and Mc the number of successes in the treatment c, where c = 1, 2,…C, with

 Since each treatment condition can be considered as an independent variable Xc under the random scoring, the expected value for the number of successes for rank r is
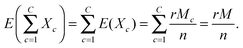
Thus, under a random scoring, the proportion of successes for rank r is  In the external evaluation, M corresponds to the total number of STITCH links used in the evaluation, whereas for replicates M = rC/2. In the internal evaluation, the ideal scoring corresponds to the case in which the proportion of successes is 0.5 for every rank r, since ideally both of the replicates are ranked similarly. For the STITCH links, the performance curve of the ideal scoring is obtained by assuming that for every drug treatment c, the corresponding numbers of the STITCH links Mc are ranked first.
In the case of the STITCH links, the performance curve of a scoring method decreases with larger ranks, and here the whole area under the curve is reported; similar results are obtained when considering only the ranks smaller than 150 (Table S1, ESI†). However, in the case of replicates, the performance curve increases constantly with larger ranks, while only the early ranks are often interesting in practice. Therefore, the partial area under the curve for ranks smaller than 150 was calculated and reported here.
Statistical analysis
For each scoring approach, we first tested whether the performance of a scoring approach is significantly better than a random scoring within the same dataset. Further, we also tested whether the observed difference between two scoring approaches within the same or between different datasets is statistically significant.![[thin space (1/6-em)]](https://www.rsc.org/images/entities/char_2009.gif) 000 times. The empirical p-value is the probability that a random ranking results in a larger AUC than the observed AUC obtained by the specific scoring method. In the case of the replicates, a similar procedure was carried out; in this case, a random performance curve was obtained by generating the ranks randomly for every drug treatment.
000 times. The empirical p-value is the probability that a permuted difference is larger than the observed difference. In the internal evaluation, the procedure was similar; here, the pairwise permutations were performed using the larger of the ranks obtained by the two replicates, which are effectively the ranks confirming that a certain drug–target interaction was recovered by both of the replicates. In order to make permutations computationally feasible, it was necessary to consider only those rank pairs with ranks smaller than the cut-off (150 in this work) in at least one of the rank pairs.
000 times. The empirical p-value is the probability that a permuted difference is larger than the observed difference.
000 times. The empirical p-value is the probability that a random ranking results in a larger AUC than the observed AUC obtained by the specific scoring method. In the case of the replicates, a similar procedure was carried out; in this case, a random performance curve was obtained by generating the ranks randomly for every drug treatment.
000 times. The empirical p-value is the probability that a permuted difference is larger than the observed difference. In the internal evaluation, the procedure was similar; here, the pairwise permutations were performed using the larger of the ranks obtained by the two replicates, which are effectively the ranks confirming that a certain drug–target interaction was recovered by both of the replicates. In order to make permutations computationally feasible, it was necessary to consider only those rank pairs with ranks smaller than the cut-off (150 in this work) in at least one of the rank pairs.
000 times. The empirical p-value is the probability that a permuted difference is larger than the observed difference.
Results
HOP approach recovers drug–target interactions more effectively than HIP
First, we investigated the relative accuracies of the heterozygous diploid (HIP approach), homozygous diploid and haploid deletion (HOP approach) datasets at recovering potential drug–target interactions. The comparative evaluations were carried out using the conventional FD- and ρ-scores in the external evaluation based on STITCH links.In order to enable a direct comparison of the datasets, we tested their performances using the shared set of genes and drugs present in each dataset pair (Fig. 1). Interestingly, the haploid dataset performed significantly better than the other two datasets (Fig. 1A and C), whereas the homozygous gene deletion collection was more accurate compared to the heterozygous dataset (Fig. 1B). The same trends were also observed when directly comparing all the three datasets (Fig. 1D), although the number of overlapping drugs in this analysis was relatively small. The overlap in the STITCH links when using the technically similar homozygous and haploid datasets was relatively large compared to the overlaps between the other dataset pairs, suggesting that the homozygous diploid and haploid deletion collections provide to some degree redundant findings (Fig. 1A).
 | ||
| Fig. 1 Comparison of the homozygous, heterozygous and haploid datasets when predicting drug–target interactions using shared sets of STITCH links. The curves illustrate the number of STITCH links relative to the total number of drug–gene pairs at varying ranks when considering only the common gene deletion strains, drugs and STITCH links present in the datasets under comparison. The pairwise dataset comparisons of (A) homozygous and haploid, (B) homo- and heterozygous, and (C) haploid and heterozygous datasets are performed using the number of STITCH links and drugs denoted in each figure. In figures (A)–(C), the curves for overlapping STITCH links of the FD- and ρ-scores for the two datasets are also shown along with a random overlap. In (D), the shared STITCH links in all three chemical-genomic datasets are considered. | ||
To make the evaluations as comprehensive as possible, we also repeated these analyses using all the available drugs and STITCH links within each dataset separately. In line with the previous results, the homozygous and haploid datasets performed again significantly better than the heterozygous dataset (Table S2 and Fig. S3, ESI†). In general, the FD-score seemed to be more accurate than the ρ-score in recovering STITCH links, suggesting that these two scoring approaches may recover somewhat different drug–target interactions, which motivates their integration in the following sections.
Taken together, these results demonstrate the relatively poor performance of the heterozygous diploid deletion dataset, compared to the homozygous diploid or haploid deletion datasets. As the haploid dataset showed the best performance, we concentrate our further analysis on this dataset. The corresponding results for the homo- and heterozygous datasets are provided as ESI.†
Rank-based integration of two complementary approaches improves target prediction
We next performed a systematic evaluation among the four scoring approaches; scoring based on the chemical-genomic profiling alone (FD-score), chemical-genomic profiles combined with the genetic interaction profiles (ρ-score), z-score-based integration of the FD- and ρ-scores (I-score), and rank-based integration of the FD- and ρ-scores (SR-score). These external evaluations were carried out using the drug–gene interactions retrieved from the STITCH database (see ‘Materials and methods’ for details).In the haploid dataset, each of the scoring approaches performed significantly better than a random scoring (Fig. 2). The ρ-score showed somewhat poorer performance compared to the FD-score, but the difference was not statistically significant (Table 1). However, the target prediction was improved when applying the integrated scoring approaches, with the SR-score leading to the significantly best overall performance (Table 1). Interestingly, about half of the interactions found by the FD- and ρ-scores were overlapping, suggesting that these two approaches lead to somewhat complementary results. The benefit of the integrated scoring approaches is that they capture relatively large portions of the interactions found by either the FD- or ρ-score alone (Fig. 2, inset).
 | ||
| Fig. 2 Performance of the different scoring approaches in the haploid dataset. The curves illustrate the number of recovered STITCH links relative to the total number of drug–gene pairs at varying ranks when the gene targets are ranked for each drug separately using different scoring methods. The Venn diagrams in the inset describe the number of overlapping STITCH links from the different scoring approaches at rank 50. | ||
| Diagonal: area under the curve (AUC) and p-values compared to random. Above diagonal: pair-wise differences of AUCs (row–column). Below diagonal: p-values for the pair-wise score differences. |
|---|

|
The results obtained from the homo- and heterozygous datasets further support the good overall performance of the SR-score (Fig. S4, ESI†); in the homozygous dataset the improvement provided by the SR-score compared to all the other scoring methods was statistically significant, whereas in the heterozygous dataset only the difference between the SR-score and the poorest performing ρ-score was significant (Table S2, ESI†). The overlap between the FD- and ρ-scores is relatively small in the homozygous dataset and even smaller in the heterozygous dataset, further implying that these complementary approaches find different drug–target interactions (Fig. S4, insets ESI†).
Table S3 (ESI†) provides more detailed information on a selected collection of direct drug–target interactions;17,18 for example, in the heterozygous dataset, the interaction lovastatin–HMG1 has ranks 1 and 874 when using the FD- and ρ-scores, respectively. Integration of these ranks led to ranks 1 (I-score) and 2 (SR-score). On the other hand, in the haploid dataset, camptothecin–TOP1 interaction was ranked as poorly as 1252 using the FD-score and 185 with the ρ-score. When integrating these through the I-score, the ranking was improved to 29. In general, the SR-score in the haploid dataset results in the best average ranking of the known drug–target interactions (Table S3, ESI†).
Finally, we also tested how the confidence level of the STITCH links affects the results; in all cases, the SR-score provided consistently the best performance in all datasets when considering all ranks (Table S1, ESI†). This indicates that the good performance of the SR-score does not originate from any subset of the STITCH links used in the evaluation.
Synthetic lethal genetic interactions are most informative for predicting drug–target interactions
Next we tested which tail of the fitness defect distribution provides most information when recovering the STITCH links when using the FD-score alone. We considered ranking of the gene deletion strains according to either their increased sensitivity or resistance, as well as using the absolute value of the FD-scores. In general, the FD-scores ranked according to the increased sensitivity (that is, the negative tail of the FD-score distribution) resulted in the best predictive value in each of the datasets (Fig. 3 and Fig. S5, horizontal lines, ESI†).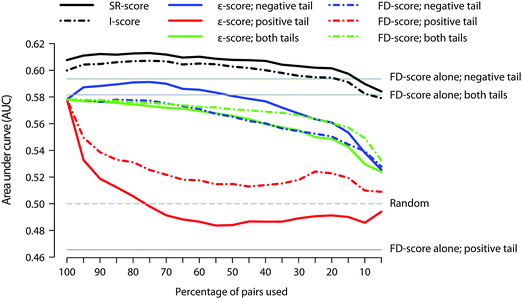 | ||
| Fig. 3 The effect of using negative, positive or both tails of the genetic interaction profiles (ε-score) or chemical–genetic interaction profiles (FD-score). The coloured traces describe the predicted accuracy for the ρ-score when using different percentages of non-missing FD- and ε-score pairs selected according to the respective tail of the SGA or haploid datasets in the calculation of correlations. The traces for the I- and SR-scores are calculated using the negative tail of the SGA dataset, which shows the best performance. Since the FD-scores alone do not rely on correlations, their AUC values are not affected by the percentage of the pairs used. | ||
Perhaps a more interesting question is whether the ρ-score can be improved by calculating the correlations over only certain pairs of the chemical-genomic and genetic interaction profiles, instead of using all the pairs with non-missing values in both the FD- and ε-scores. We addressed this question by including different quantiles of pairs in the calculation of correlations based on the negative, positive or both tails of the genetic interaction as well as the chemical-genomic profiles (see Fig. S6, ESI† for an example).
We observed that synthetic lethal genetic interactions (negative tail of the ε-score) provide most information on the prediction of drug–target interactions (Fig. 3). More specifically, the optimal performance of the ρ-score was achieved when correlations are based on the most negative portion of genetic interactions in conjunction with the FD-score distribution ranked according to increased sensitivity. In the haploid dataset, the optimal percentage was 75% (referred to as ρ*-score), after which the performance starts again to decrease. The ρ*-score showed significant improvement in AUC-values compared to the normal ρ-score (p < 0.001). For example, the rank of the gene CTA1 under hydrogen peroxide treatment decreased from 207 (ρ-score) to 26 (ρ*-score) in the haploid dataset (Table S3, ESI†).
We then studied how the optimal ρ*-score affects the I- and SR-scores (Fig. 3 and Fig. S5, ESI†). The shape of the curve obtained with the SR-score resembles closely the curve of the ρ-score, which implies that the ρ-score has, in general, a larger effect on the SR-score than on the I-score (most notably seen in the heterozygous dataset, Fig. S5, ESI†). However, both the I- and SR-scores can be enhanced by applying the optimized ρ*-score in their calculations.
Interestingly, calculating correlations according to the positive tail of the genetic interaction dataset immediately decreased the performance of the ρ-score, with AUC being eventually even worse than that of random scoring. This suggests that leaving out even a small fraction of the most synthetic lethal genetic interactions has clearly a negative effect on the ρ-score. On the other hand, concentrating on the most sensitive (negative) fitness defects in conjunction with the genetic interaction profiles had hardly any effect on the ρ-score. While leaving out the most sensitive drug–target interactions decreased the ρ-score, the effect was smaller compared to excluding the most negative genetic interactions. Taken together, these results suggest that the synthetic lethal interactions correspond to sensitive fitness defects in respective genes more often than observed vice versa. Similar observations can be made also in the homo- and heterozygous datasets (Fig. S5, ESI†), further emphasizing the significant role that synthetic lethal genetic interactions have in drug target prediction.
The homozygous dataset provides more reproducible drug–target rankings than the heterozygous dataset
The consistency of the potential target gene ranking was evaluated using the replicate measurements in the homo- and heterozygous datasets (for details, see ‘Materials and methods’). In these internal evaluations, the ρ*-score was used in the calculation of the I*- and SR*-scores along with the FD-score ranked according to the increased sensitivity.The differences between the basic versions of each of the four scoring approaches were relatively small, suggesting that all the approaches result in equally reproducible rankings (Table 2). When considering the best variation of each scoring approach, however, the I*-score seems to be the one providing the most coherent rankings (Table 2 and Fig. S7A, ESI†). Notably, using the ρ*-scores in the calculations of the I*- and SR*-scores improved significantly the performances compared to those versions calculated with the normal ρ-scores (Table 2). Hence, choosing the pairs for computing the correlations according to the negative tail of the SGA dataset does not only improve the recovery of the STITCH links, but also improves the consistency of the potential target gene ranking. The complete results obtained using the different tails of each score distribution are shown in Table S4 (ESI†).
| Diagonal: area under the curve (AUC); all AUCs are better than random (p < 0.001). Above diagonal: pair-wise differences of AUCs (row–column). Below diagonal: p-values for the pair-wise score differences. ρ*-score: correlation based on 75% of pairs using the negative tail of the SGA dataset. I* and SR*-scores: calculated using the negative tail of the FD-score and the ρ*-score. Basic versions of each of the scoring approach are in italics; the best variations are in bold. |
|---|

|
The corresponding results for the heterozygous dataset are provided in ESI† (Table S5 and Fig. S7B). Here, the AUC values are, in general, again much smaller compared to those of the homozygous dataset, suggesting that besides recovering the STITCH links better, the homozygous dataset also provides more coherent results. Interestingly, the positive tail, along with the absolute values, of the FD-scores clearly outperformed all the other methods when considering reproducibility of the results. This indicates that the selection of the distribution, the tail and the percentage of the pairs used in the calculation of the ρ*-, I*- and SR*-scores according to the best performance at recovering the STITCH links does not lead to the optimal reproducibility in the heterozygous dataset.
Protein complexes are central in the interpretation of the drug response networks
While the systematically evaluated and optimized scoring approaches have numerous important applications, we focus here on one particular case, namely, we constructed an example network of drug–gene-pathway relationships. The network was based on top 50 gene targets ranked according to the SR*-score under rapamycin treatment in the homozygous dataset (Fig. 4). We chose two specific biological process terms in Gene Ontology,22 in which the corresponding genes were enriched; endosome transport (GO: 0016197, p = 1.3 × 10⁻¹⁰) and regulation of growth (GO: 0040008, p = 2.3 × 10⁻³). | ||
| Fig. 4 An integrated network of the rapamycin-interacting genes, pathways and complexes. The network is based on the genes most related to rapamycin by the SR-score in the homozygous dataset. Thin edges correspond to genetic interactions and thick edges to mixed genetic and physical interactions, where the color of the edge indicates whether the genetic interaction is negative or positive. Two parallel lines indicate pure physical interactions. The sensitivity or resistance of each gene deletion strain was assigned based on the sign of the FD-score. The gray nodes indicate those genes which are not present in the homozygous dataset (e.g. essential genes). The nodes with bolded border lines indicate those gene deletion strains having evidence for rapamycin sensitivity in SGD (http://www.yeastgenome.org) database.19 The protein complexes are shaded, and the background color indicates which GO process a gene is related to. The network was constructed using Cytoscape.20 The interactions between genes were retrieved from the BioGRID,21 version 3.1.85. | ||
A total of 14 of the top 50 genes were linked to either one of these selected GO terms. Four of these genes (SYS1, VPS5, VPS29, VPS35) were linked to more than 20% of the different chemical treatments in the homozygous dataset according to the SR*-score, hence defining the corresponding gene as multi-drug resistant (MDR).4 Thus, the remaining 10 genes were defined specific to rapamycin. The sensitivity or resistance of the corresponding gene deletion strain was assigned based on the sign of the FD-score. For example, target of rapamycin, TOR1, had ranks 7 and 4 when using the SR*- and FD-scores, respectively (ranks 92 and 14 for the ρ*- and I*-scores; Table S3, ESI†). Thus, TOR1 appears in the network as a sensitive node.
Notably, each of the protein complexes present in the network included at least one of the 14 rapamycin-interacting genes (Fig. 4). For instance, the two targets in the RIC1p–RGP1p and GARP complexes, RGP1 and VPS51, respectively, were found early when using the SR*-score. While missing in STITCH, these gene deletion strains have in fact been reported as sensitive to rapamycin in Saccharomyces Genome Database (SGD).19
In the retromer complex, all of the four genes present in the homozygous dataset were linked to rapamycin using the SR*-score. Interestingly, one of these genes, VPS17, is not related to rapamycin according to SGD or STITCH. However, this gene shares both genetic and physical interaction partners with the other members of the retromer complex, the deletion of which is known to lead to rapamycin sensitivity.19 Also, the SR*-score assigns an early rank for this gene, suggesting a potential interaction between rapamycin and VPS17 for further study.
One of the genes, namely YPT6, seems to be a central pathway hub (i.e. highly connected network node). While there is evidence for this gene deletion strain being sensitive to rapamycin in SGD, it was not among the top-ranked targets by the SR*-score. However, the rapamycin-dependence can be predicted based on the network's connectivity structure, further demonstrating the importance of such integrative analysis.
In general, most of these selected gene deletion strains present in the network were sensitive to rapamycin, whereas there were only a few resistant strains, YPT32, SFT2 and GGA1, which all seem to reside in the non-central part of the network not belonging to any of the protein complexes. As expected, physical interactions are common within complexes, while between-complex interactions tend to be genetic, with the negative type being the dominant one. These results suggest that protein complexes have a central role when modelling polygenic response patterns to chemical treatment.
Conclusions
The comparative evaluation between the different chemical-genomic datasets demonstrated that the haploid assay shows the best overall performance when detecting potential drug–target interactions, both when considering the links in the STITCH database (Fig. 1) or the collected set of known targets of drugs (Table S3, ESI†). This reflects the fact that screening both the chemical-genomic and genetic interactions on the haploid deletion mutant collection may improve the correlation-based scoring results, when compared to those of the homo- and heterozygous datasets. Further, as expected, the overlap in the recovered drug–target interactions between technically similar haploid and homozygous datasets was relatively large (Fig. 1A). We also considered ranking the targets globally over all the drugs in the dataset, and this analysis further supported the good performance of the haploid dataset (Fig. S8, ESI†).Surprisingly, the heterozygous profiling (HIP) turned out to be less effective at recovering drug–gene interactions reported in STITCH compared to the haploid and homozygous diploid deletion profiling (HOP). The underlying technical similarities between the HOP chemical-genomic assays and the haploid double-mutant genetic interaction assays cannot account for the better performance of the fitness defect-based method (FD-score), since this score does not rely on the genetic interactions. Neither does the lack of most of the essential genes explain the poor performance of the heterozygous dataset compared to the HOP assays (Fig. S9, ESI†). Perhaps more likely, this result could reflect the fact that in the HIP profiling only direct targets of the chemical under analysis are recovered, whereas in the HOP profiling also genes involved in buffering the drug target pathway can be detected.2,3,5 Indeed, when studying the set of well-established direct drug–target interactions, the HIP FD-score performed as expected (Table S3, ESI†). For instance, the HIP profiling recovered as its top-rank HMG1, the target of anticholesterol drugs atorvastatin and lovastatin. As another example, TUB3, the target of antifungal drugs thiabendazole and nocodazole, was also top-ranked (ranks 1 and 12 with the FD-score, respectively). Interestingly, the recovery of the interaction between TUB3 and nocodazole can further be improved by the I-score (rank 1) and the SR-score (rank 4).
In general, the target rankings based on the fitness defects (FD-score) were more accurate at recovering the STITCH links compared to the approach utilizing the conventional profile correlations (ρ-score). However, the target detection could be improved by applying the integrative scoring approaches (I- and SR-scores). An advantage of the SR-score is that it captures a wide range of drug–target links recovered either by the FD- or ρ-score, with an overall improved accuracy compared to the previously proposed integration approach (I-score). Moreover, being rank-based statistic, the SR-score is relatively insensitive to both outliers and missing data points, which are quite frequent in high-throughput screening datasets. Here, for instance, the homozygous chemical-genomic screening dataset had a missing value rate of 10%, making the traditional data mining approaches, such as the FD-score, vulnerable to unobserved interactions. This may also partly explain why the heterozygous dataset has conventionally been considered more informative for drug target analysis.
A limitation of any correlation-based approach is that they cannot determine whether the gene or mutation is associated with compound sensitivity or resistance. However, by combining the information obtained from the SR- and FD-scores enables one to construct drug–target networks and to analyse the gene nodes and their interactions with respect to sensitivity and resistance in the context of selected biological processes (Fig. 4). In the interpretation of such drug–gene-pathway relationships, physical interactions and complexes were found to provide useful information by which to decompose the complex network into cross-connected sub-network modules. This is in line with recent studies, which show that functional modules, such as protein complexes and biological pathways, are central in explaining the genetic landscape of yeast.10,13,23 Moreover, protein complexes are relatively stable in response to chemical perturbation, even when their functional connections are reorganized,24 suggesting that protein complexes could serve as robust processing units when modelling, explaining and predicting drug responses on a global network level.25
It was also found out that the pure correlation-based approach, such as the ρ-score used in previous studies,3,7,10,11 seems to be sub-optimal when identifying targets of bioactive compounds. Interestingly, the performance of the correlation-based scoring approaches could further be enhanced by focusing on the negative tail of the genetic interactions (i.e. synthetic lethal/sick interactions). This supports the earlier results,7,11 also when using the recent quantitative SGA assays which allow the detection of both the positive and negative ends of the genetic interaction spectrum.10 While the positive genetic interactions often connect functionally distinct protein complexes,13 we showed here that the negative genetic interactions were especially useful for predicting drug–target interactions. In line with this observation, pathway-specific hubs in the synthetic lethal genetic interaction network were recently used to predict compounds that would target a given pathway of interest.26 However, since there may be both negative and positive genetic interactions within and between functional modules,10,22,27,28 it seems likely that the whole spectrum of quantitative genetic interactions is needed when eventually moving from drug–target interactions toward predicting drug target pathways and networks.29
Once carefully evaluated in the high-quality yeast datasets, the same principles can later be applied to drug and target discovery in human diseases. In particular, the concept of synthetic lethality has recently gained much interest as a principled strategy to develop more effective and selective cancer treatments.30–32 However, despite the advances in biotechnologies, such as RNA interference and high-throughput chemical screening, which enable systematic detection of synthetic lethal interactions in human cells, there remain experimental and computational challenges in the discovery of new drug targets for personalized therapies.14,33 Computational scoring approaches, such as those evaluated here, play a major role in the drug discovery process by identifying the most promising chemical compounds and their cellular targets. These results should therefore prove useful also for future developments in network pharmacology,34e.g., for explaining observed polypharmacology of single drugs or predicting effective drug combinations to fight treatment resistance.35
Acknowledgements
The work was supported by the Academy of Finland (grants 120 569, 133 227 and 140 880). The authors thank Dr Cosmin Saveanu for helpful comments and Dr Michael Kuhn for his help with the STITCH database.References
- H. N. Chua and F. P. Roth, Discovering the targets of drugs via computational systems biology, J. Biol. Chem., 2011, 286, 23653–23658 CrossRef CAS.
- A. M. Smith, R. Ammar, C. Nislow and G. Giaever, A survey of yeast genomic assays for drug and target discovery, Pharmacol. Ther., 2010, 127, 156–164 CrossRef CAS.
- C. H. Ho, J. Piotrowski, S. J. Dixon, A. Baryshnikova, M. Costanzo and C. Boone, Combining functional genomics and chemical biology to identify targets of bioactive compounds, Curr. Opin. Chem. Biol., 2011, 15, 66–78 CrossRef CAS.
- M. E. Hillenmeyer, E. Fung, J. Wildenhain, S. E. Pierce, S. Hoon, W. Lee, M. Proctor, R. P. St Onge, M. Tyers, D. Koller, R. B. Altman, R. W. Davis, C. Nislow and G. Giaever, The chemical genomic portrait of yeast: uncovering a phenotype for all genes, Science, 2008, 320, 362–365 CrossRef CAS.
- M. E. Hillenmeyer, E. Ericson, R. E. Davis, C. Nislow, D. Koller and G. Giaever, Systematic analysis of genome-wide fitness data in yeast reveals novel gene function and drug action, Genome Biol., 2010, 11, R30 CrossRef.
- G. Giaever, P. Flaherty, J. Kumm, M. Proctor, C. Nislow, D. F. Jaramillo, A. M. Chu, M. I. Jordan, A. P. Arkin and R. W. Davis, Chemogenomic profiling: identifying the functional interactions of small molecules in yeast, Proc. Natl. Acad. Sci. U. S. A., 2004, 101, 793–798 CrossRef CAS.
- A. B. Parsons, R. L. Brost, H. Ding, Z. Li, C. Zhang, B. Sheikh, G. W. Brown, P. M. Kane, T. R. Hughes and C. Boone, Integration of chemical-genetic and genetic interaction data links bioactive compounds to cellular target pathways, Nat. Biotechnol., 2004, 22, 62–69 CrossRef CAS.
- G. Giaever, D. D. Shoemaker, T. W. Jones, H. Liang, E. A. Winzeler, A. Astromoff and R. W. Davis, Genomic profiling of drug sensitivities via induced haploinsufficiency, Nat. Genet., 1999, 21, 278–283 CrossRef CAS.
- L. Kapitzky, P. Beltrao, T. J. Berens, N. Gassner, C. Zhou, A. Wüster, J. Wu, M. M. Babu, S. J. Elledge, D. Toczyski, R. S. Lokey and N. J. Krogan, Cross-species chemogenomic profiling reveals evolutionarily conserved drug mode of action, Mol. Syst. Biol., 2010, 6, 451 CrossRef CAS.
- M. Costanzo, A. Baryshnikova, J. Bellay, Y. Kim, E. D. Spear, C. S. Sevier, H. Ding, J. L. Koh, K. Toufighi, S. Mostafavi, J. Prinz, R. P. St Onge, B. VanderSluis, T. Makhnevych, F. J. Vizeacoumar, S. Alizadeh, S. Bahr, R. L. Brost, Y. Chen, M. Cokol, R. Deshpande, Z. Li, Z. Y. Lin, W. Liang, M. Marback, J. Paw, B. J. San Luis, E. Shuteriqi, A. H. Tong, N. van Dyk, I. M. Wallace, J. A. Whitney, M. T. Weirauch, G. Zhong, H. Zhu, W. A. Houry, M. Brudno, S. Ragibizadeh, B. Papp, C. Pál, F. P. Roth, G. Giaever, C. Nislow, O. G. Troyanskaya, H. Bussey, G. D. Bader, A. C. Gingras, Q. D. Morris, P. M. Kim, C. A. Kaiser, C. L. Myers, B. J. Andrews and C. Boone, The genetic landscape of a cell, Science, 2010, 327, 425–431 CrossRef CAS.
- A. B. Parsons, A. Lopez, I. E. Givoni, D. E. Williams, C. A. Gray, J. Porter, G. Chua, R. Sopko, R. L. Brost, C. H. Ho, J. Wang, T. Ketela, C. Brenner, J. A. Brill, G. E. Fernandez, T. C. Lorenz, G. S. Payne, S. Ishihara, Y. Ohya, B. Andrews, T. R. Hughes, B. J. Frey, T. R. Graham, R. J. Andersen and C. Boone, Exploring the mode-of-action of bioactive compounds by chemical-genetic profiling in yeast, Cell, 2006, 126, 611–625 CrossRef CAS.
- T. A. Gianoulis, A. Agarwal, M. Snyder and M. B. Gerstein, The CRIT framework for identifying cross patterns in systems biology and application to chemogenomics, Genome Biol., 2011, 12, R32 CrossRef.
- A. Baryshnikova, M. Costanzo, Y. Kim, H. Ding, J. Koh, K. Toufighi, J. Y. Youn, J. Ou, B. J. San Luis, S. Bandyopadhyay, M. Hibbs, D. Hess, A. C. Gingras, G. D. Bader, O. G. Troyanskaya, G. W. Brown, B. Andrews, C. Boone and C. L. Myers, Quantitative analysis of fitness and genetic interactions in yeast on a genome scale, Nat. Methods, 2010, 7, 1017–1024 CrossRef CAS.
- M. A. Heiskanen and T. Aittokallio, Mining high-throughput screens for cancer drug targets – lessons from yeast chemical-genomic profiling and synthetic lethality, WIREs Data Min. Knowl. Discovery, 2012, 2, 263–272 CrossRef.
- W. Lee, R. P. St Onge, M. Proctor, P. Flaherty, M. I. Jordan, A. P. Arkin, R. W. Davis, C. Nislow and G. Giaever, Genome-wide requirements for resistance to functionally distinct DNA-damaging agents, PLoS Genet., 2005, 1, e24 Search PubMed.
- R. L. Imam and W. J. Conover, A measure of top-down correlation, Technometrics, 1987, 29, 351–357 Search PubMed.
- M. Kuhn, D. Szklarczyk, A. Franceschini, C. von Mering, L. J. Jensen and P. Bork, STITCH 3: zooming in on protein–chemical interactions, Nucleic Acids Res., 2012, 40, D876–D880 CrossRef CAS.
- M. Cokol, H. N. Chua, M. Tasan, B. Mutlu, Z. B. Weinstein, Y. Suzuki, M. E. Nergiz, M. Costanzo, A. Baryshnikova, G. Giaever, C. Nislow, C. L. Myers, B. J. Andrews, C. Boone and F. P. Roth, Systematic exploration of synergistic drug pairs, Mol. Syst. Biol., 2011, 7, 544 CrossRef.
- J. M. Cherry, E. L. Hong, C. Amundsen, R. Balakrishnan, G. Binkley, E. T. Chan, K. R. Christie, M. C. Costanzo, S. S. Dwight, S. R. Engel, D. G. Fisk, J. E. Hirschman, B. C. Hitz, K. Karra, C. J. Krieger, S. R. Miyasato, R. S. Nash, J. Park, M. S. Skrzypek, M. Simison, S. Weng and E. D. Wong, Saccharomyces Genome Database: the genomics resource of budding yeast, Nucleic Acids Res., 2012, 40, D700–D705 CrossRef CAS.
- P. Shannon, A. Markiel, O. Ozier, N. S. Baliga, J. T. Wang, D. Ramage, N. Amin, B. Schwikowski and T. Ideker, Cytoscape: a software environment for integrated models of biomolecular interaction networks, Genome Res., 2003, 13, 2498–2504 CrossRef CAS.
- C. Stark, B. J. Breitkreutz, T. Reguly, L. Boucher, A. Breitkreutz and M. Tyers, BioGRID: a general repository for interaction datasets, Nucleic Acids Res., 2006, 34, D535–D539 CrossRef CAS.
- M. Ashburner, C. A. Ball, J. A. Blake, D. Botstein, H. Butler, J. M. Cherry, A. P. Davis, K. Dolinski, S. S. Dwight, J. T. Eppig, M. A. Harris, D. P. Hill, L. Issel-Tarver, A. Kasarskis, S. Lewis, J. C. Matese, J. E. Richardson, M. Ringwald, G. M. Rubin and G. Sherlock, Gene ontology: tool for the unification of biology, Nat. Genet., 2000, 25, 25–29 CrossRef CAS.
- M. Michaut, A. Baryshnikova, M. Costanzo, C. L. Myers, B. J. Andrews, C. Boone and G. D. Bader, Protein complexes are central in the yeast genetic landscape, PLoS Comput. Biol., 2011, 7, e1001092 CAS.
- S. Bandyopadhyay, M. Mehta, D. Kuo, M. K. Sung, R. Chuang, E. J. Jaehnig, B. Bodenmiller, K. Licon, W. Copeland, M. Shales, D. Fiedler, J. Dutkowski, A. Guénolé, H. van Attikum, K. M. Shokat, R. D. Kolodner, W. K. Huh, R. Aebersold, M. C. Keogh, N. J. Krogan and T. Ideker, Rewiring of genetic networks in response to DNA damage, Science, 2010, 330, 1385–1389 CrossRef CAS.
- T. M. Venancio, S. Balaji and L. Aravind, High-confidence mapping of chemical compounds and protein complexes reveals novel aspects of chemical stress response in yeast, Mol. BioSyst., 2010, 6, 175–181 RSC.
- C. M. Tamble, R. P. St Onge, G. Giaever, C. Nislow, A. G. Williams, J. M. Stuart and R. S. Lokey, The synthetic genetic interaction network reveals small molecules that target specific pathways in Saccharomyces cerevisiae, Mol. BioSyst., 2011, 7, 2019–2030 RSC.
- M. Costanzo, A. Baryshnikova, C. L. Myers, B. Andrews and C. Boone, Charting the genetic interaction map of a cell, Curr. Opin. Biotechnol., 2011, 22, 66–74 CrossRef CAS.
- C. H. Hsu, T. Y. Wang, H. T. Chu, C. Y. Kao and K. C. Chen, A quantitative analysis of monochromaticity in genetic interaction networks, BMC Bioinf., 2011, 12(suppl. 13), S16 CrossRef.
- S. Han and D. Kim, Inference of protein complex activities from chemical-genetic profile and its applications: predicting drug–target pathways, PLoS Comput. Biol., 2008, 4, e1000162 Search PubMed.
- L. H. Hartwell, P. Szankasi, C. J. Roberts, A. W. Murray and S. H. Friend, Integrating genetic approaches into the discovery of anticancer drugs, Science, 1997, 278, 1064–1068 CrossRef CAS.
- W. Kaelin, The concept of synthetic lethality in the context of anticancer therapy, Nat. Rev. Cancer, 2005, 5, 689–698 CrossRef CAS.
- S. M. Nijman, Synthetic lethality: general principles, utility and detection using genetic screens in human cells, FEBS Lett., 2011, 585, 1–6 CrossRef CAS.
- R. Brough, J. R. Frankum, S. Costa-Cabral, C. J. Lord and A. Ashworth, Searching for synthetic lethality in cancer, Curr. Opin. Genet. Dev., 2011, 21, 34–41 CrossRef CAS.
- A. L. Hopkins, Network pharmacology: the next paradigm in drug discovery, Nat. Chem. Biol., 2008, 4, 682–690 CrossRef CAS.
- K. Andrusiak, J. S. Piotrowski and C. Boone, Chemical-genomic profiling: systematic analysis of the cellular targets of bioactive molecules, Bioorg. Med. Chem., 2012, 20, 1952–1960 CrossRef CAS.
Footnote |
| † Electronic supplementary information (ESI) available: Supplementary Fig. S1–S9 and supplementary Tables S1–S5. See DOI: 10.1039/c3mb25591c |
| This journal is © The Royal Society of Chemistry 2013 |