Microfluidic probes for use in life sciences and medicine
Mohammad A.
Qasaimeh
a,
Sébastien G.
Ricoult
b and
David
Juncker
*c
aBiomedical Engineering Department and Genome Quebec Innovation Centre, McGill University, Montreal, Canada
bDepartment of Neurology and Neurosurgery and Genome Quebec Innovation Centre, McGill University, Montreal, Canada
cBiomedical Engineering Department, Genome Quebec Innovation Centre, and Department of Neurology and Neurosurgery, McGill University, Montreal, Canada. E-mail: david.juncker@mcgill.ca
First published on 24th September 2012
Abstract
Microfluidic probes (MFPs) combine the concepts of microfluidics and of scanning probes and constitute a contact-free and channel-free microfluidic system. Whereas classically the sample is introduced into the microfluidic device, with a MFP, the microfluidic stream is applied to the sample. MFPs use hydrodynamic flow confinement instead of walls to constrain a microfluidic stream between the MFP tip and a substrate. Because MFPs are free to move, they can be used to process large areas and samples in a selective manner. The development of MFP technology is recent and has numerous potential applications in several fields, most notably in the life sciences. In this review, we discuss the concept of MFPs and highlight their application in surface biopatterning, controlling the cellular microenvironments, local processing of tissue slices, and generating concentration gradients of biochemicals. We hope that this manuscript will serve as an interdisciplinary guide for both engineers as they further develop novel MFPs and applications and for life scientists who may identify novel uses of the MFP for their research.
 Mohammad A. Qasaimeh | Mohammad A. Qasaimeh is a PhD candidate in the Biomedical Engineering Department, McGill University. He is the recipient of Alexander Graham Bell Graduate NSERC Scholarship, the Student-researchers Stars Award from the Fonds de recherche du Québec, and the BME Excellence Award from McGill University. In 2011, he joined the Gaudet's lab at Harvard Medical School as a visiting scholar, where he developed a microfluidic chip for the study of cancer cells. Currently, he is working on the project remotely while affiliated as a research fellow. His research interests include developing microfluidic devices for the study of cellular dynamics and chemotaxis. |
 Sébastien G. Ricoult | Sébastien G. Ricoult completed an M.Sc. degree in neurology and neurosurgery in 2011 from McGill University, Canada where he is presently pursuing a Ph.D. degree in the same domain. Previously he obtained a B.S. degree in Biotechnology in 2008 from Rochester Institute of Technology, USA. He is currently supported by the NSERC-CREATE Programs in Neuroengineering and Integrated Sensor Systems. His research focuses on the development and application of soft lithography technologies in the neurosciences. |
 David Juncker | David Juncker is an associate professor in the Biomedical Engineering Department at McGill University and a member of the McGill University and Génome Québec Innovation Centre. He obtained his PhD in Micro/Nano-technology from the University of Neuchâtel in Switzerland in 2002 and worked both as a graduate student and post-doc at the IBM Zurich Research laboratory on microfluidics and at the ETH Zurich on implantable sensors. He holds a Canada Research Chair in Micro and Nanobioengineering. His research interests are the development of novel nanotechnologies and microfluidics for cell biology studies, global health applications, and protein biomarker discovery and validation. |
Introduction
Over the last two decades, microfluidics has emerged as a powerful technology with many applications in the life sciences and medicine. Microfluidic systems have many advantages that overcome limitations of conventional tools and methods used in life sciences research, Fig. 1. Notably, microfluidic systems have a much smaller footprint, faster reaction rates that help shorten the time to result, reduced sample consumption which can lead to lower cost, multiplexing capability and the ability to perform high throughput experiments.1,2 Consequently, microfluidic systems have become increasingly prevalent and widely used. For example in cell-based research, microfluidics were used to study cell signalling,3 fusion,4 mechanics,5 dynamics,6,7 chemotaxis and electrotaxis.8 | ||
| Fig. 1 Traditional and microfluidic methods for in vitro cell culture. (a) A conventional cell culture dish being serviced with liquid using a pipette. (b) A conventional microfluidic device made in transparent PDMS that is bonded to a transparent glass substrate. The device features two inlets, one outlet and a closed channel network connecting them. The channels are filled with red food dye for visualization. (c) Schematics of the microfluidic probe (MFP) operating on top of a substrate (i.e. Petri dishes) and immersed in liquid. The MFP can be freely moved across the substrate. | ||
However, microfluidics faces a number of issues as well, such as clogging of the microchannels, and high flow resistance that can lead to high shear stress that limits the speed at which chemicals can be exchanged. It is difficult to selectively access isolated areas inside of microchannels, and large samples. This makes large samples such as tissue slices difficult to process. The transition from traditional cell culture protocols (i.e. using Petri dishes) to microfluidics faces additional obstacles, such as the need to culture cells and tissues within microfluidic channels over extended periods of time (prior to the experiment). Additionally, cells experience different physical environments at the microscale than at the macro-scale.9,10 Therefore, the conditions for long term cultures inside microfluidic devices need to be re-established. The continuous maintenance of flow can be a challenge, especially when several experiments and devices are required.
The MFP was proposed to overcome some of the limitations of closed microfluidics while keeping many of the advantages of microfluidics.11 The MFP is an open microfluidic system without walls that works in non-contact mode. The MFP head and the substrate surface are both flat and kept parallel to one another, separated by a narrow gap. For fluid in the gap, the MFP head and substrate are equivalent to two parallel plates corresponding to a Hele–Shaw configuration.12 With the MFP, it is not necessary to introduce a sample, i.e. a cell, into a microfluidic conduit, but instead a microfluidic stream is applied to the sample using the MFP. The MFP is mobile and can be moved over the sample by scanning across it, and the microfluidic stream can thus be applied anywhere in the sample, Fig. 1c. These attributes facilitate the application of the MFP to biological and medical research as it can simply be placed over cells or tissues cultured according to conventional methods in a Petri dish or on a cover slip.
In the following sections, we describe the basic concepts underlying the MFP; describe different MFP designs and their use for patterning surfaces with biomolecules, for processing individual cells, groups of cells, and tissue sections, and for generating “floating” concentration gradients. The concept of open microfluidics was reproduced in a number of other devices, notably the chemistrode,13 dual capillary probes,14 and microfluidic pipettes.15 These technologies have been reviewed elsewhere,16 whereas this review focuses on the MFP with parallel plate configuration.
The microfluidic probe
The microfluidic probe (MFP) combines the concepts of microfluidics and of scanning probes and can be used with any planar substrate.11 It consists of a flat tip with a pair of apertures, which are located within a few micrometres of one another in the smallest probes, and one millimetre in the largest ones built to date. For processing, the MFP is placed above the substrate to form a narrow gap while being immersed within the surrounding liquid, Fig. 1c, thus operating in a Hele–Shaw flow configuration.12 The gap between the MFP and the substrate can be adjusted and has been varied between 1 μm and 100 μm, depending on the size of the probe and the application.11,17–22 One of the MFP's apertures is used to inject a processing solution, while the other is used for aspiration, Fig. 2a. When the aspiration flow rate (QA) is considerably higher than the injection flow rate (QI), the injected solution is confined and deflected into a microstream by the (concentric) aspiration flow field and entirely sucked back through the aspiration aperture. This phenomenon is defined as hydrodynamic flow confinement (HFC), Fig. 2b. Following HFC, there is no need for channel walls to confine the processing solution. There is no leaking of the injected solution into the surrounding medium as long as the ratio QA/QI remains higher than the HFC threshold that was found to be between 2–3.11,22 Efficient confinement for such low QA/QI ratios is achieved thanks to the parallel plate configuration that results in a quasi-2D flow field, and thus enables efficient capture of all the injected fluid. The injected flow is confined into a tear shape, and the size of the confined stream can be tuned by adjusting the ratio QA/QI, and to a lesser extent by adjusting the gap (G), Fig. 2c. The MFP can be used to process large areas and samples in a selective manner by placing it atop the area and the microstream is directly flushed across the sample of interest. Thus, biological organisms cultured in Petri dishes or on cover slips can be locally exposed to microstreams of chemicals applied with an MFP. A detailed description on the handling and mounting of the original Si based MFP is shown in a video publication.23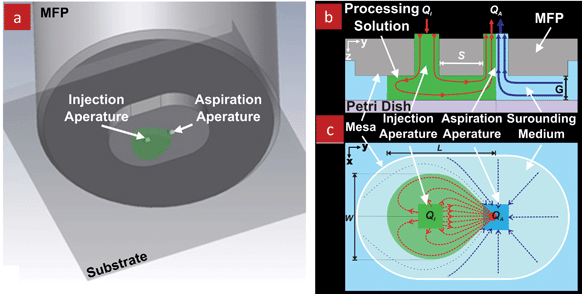 | ||
| Fig. 2 Schematics of the microfluidic probe. (a) 3D representation of the MFP and underlying substrate. The injected solution is shown in green color. The immersion medium is not shown. (b) Cross-sectional view and (c) bottom view of the MFP illustrating the Hele–Shaw configuration and showing the hydrodynamic flow confinement of the processing solution (shown in green color) achieved by the push-pull configuration. G is the gap between the MFP surface and the bottom substrate. QI and QA are the injection and aspiration flow rates, respectively. L and W are the length and the width of the tear shape of the confined injected liquid, respectively. Schematics are not to scale. | ||
The original MFP was microfabricated in a Si wafer with two microfluidic apertures for injecting and aspirating fluids etched through the wafer and located within a mesa that was protruding ∼50 μm from the surrounding area.11,18 The Si chip was bonded to a PDMS chip that served as the world-to-chip interface.
The MFP was connected to two syringe pumps, one for injecting and one for aspirating, using two capillaries that were plugged into the PDMS interface. The MFP was manipulated with a rod-clamp that was mounted to an XYZ positioning system, Fig. 3a.
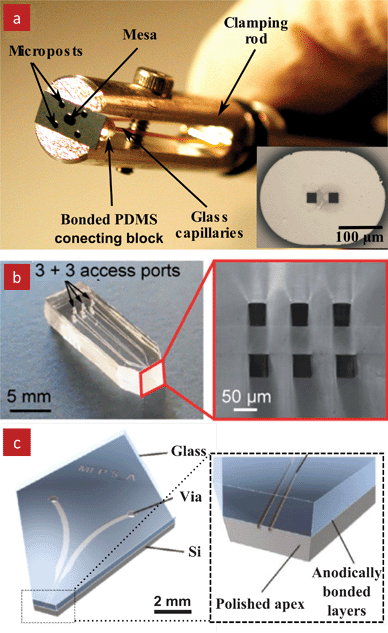 | ||
| Fig. 3 MFP designs. (a) A photograph of the original MFP shown with handling rod used to attach it to the micro-positioning system. The inset shows an enlarged view of the MFP mesa and the two apertures. This MFP was made out of a Si chip that was bonded to a PDMS interface for input/output fluidic connections. The two apertures in the mesa connect to the channels. Four microposts surrounding the mesa help alignment to the substrate and serve as “bumpers” (b) A photograph of a vertical PDMS-MFP with 6 apertures. This MFP was fabricated by laminating a thin PDMS membrane between two PDMS layers structured with microfluidic channels. The tip was formed by cutting the PDMS with a razor blade. An enlarged view of the tip is shown on the right. Reproduced by permission of The Royal Society of Chemistry.19 (c) 3D schematic of a vertical Si-glass MFP that was made by anodic bonding of a glass layer with a patterned Si chip. An enlarged view of the tip is shown on the right. Reprinted with permission from Langmuir, Copyright 2011 American Chemical Society.20 | ||
The Si chip was fabricated with multiple photolithography steps and deep reactive ion etching (DRIE) on both sides of the wafer. The drawbacks of this design were a large footprint of the MFP head relative to the mesa and rather advanced and lengthy microfabrication processes. Hence, novel geometries and simpler fabrication processes were developed subsequently. Queval et al. introduced a transparent PDMS MFP with a vertical probe geometry,19Fig. 3b. The fabrication process was based on laminating a thin PDMS membrane between two identical PDMS layers structured with microfluidic channels. This simple process allowed for the production of 10 probes a day in a standard laboratory and without need for a clean-room facility, except for the initial fabrication of the master mold. This way, the PDMS MFP could accommodate multiple apertures, and since the material of the MFP is a transparent, this setup may allow illumination of the sample from the top through the MFP itself. A similar geometry and a multilayer fabrication process with bonding was also adopted by Kaigala et al. but instead of PDMS, the MFP was structured into Si which was anodically bonded to a glass chip, followed by dicing of the MFP and polishing of the tip.20 The Si-Glass MFP has the smallest footprint among the various MFPs, and is also amenable to top illumination through the glass layer, Fig. 3c.
Different holders have been produced17–20 to clamp and manipulate the variety of MFPs. A stable and rigid probe holder is required to permit precise adjustment of the position and minimize vibration of the MFP, in particular when working with small gaps of the order of a few micrometers. Thus, rigid metallic holders were used for all of the MFPs.
All MFP stations to date were built atop of inverted microscopes for live visualization of the MFP in operation, Fig. 4. Precision XYZ gantry allows to precisely position the MFP over any point and to adjust the gap between MFP and substrate with sub-micrometer precision. The microscope stage is typically used for XY positioning, and an external stage for the vertical positioning along the Z axis. Note that a three-point support configuration is used to adjust the horizontality of the substrate to ensure a constant gap when long distances are being scanned across the surface. The injection and aspiration of the flow are achieved using automated and computer controlled syringe pumps. Automated probe stations with programmable control of the MFP position and syringe pumps with integrated imaging have been built and are used routinely for experimentation.18
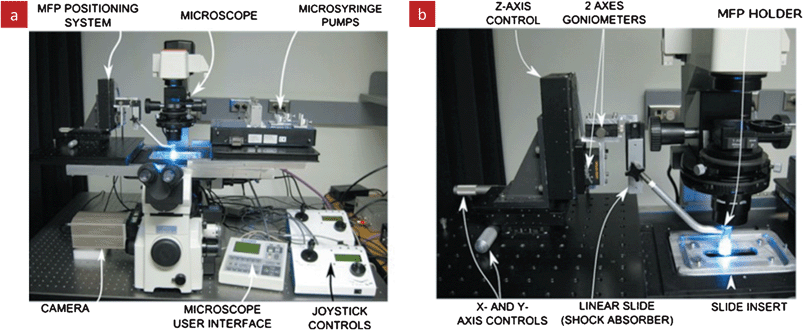 | ||
| Fig. 4 Automated MFP station for positioning the MFP, flow control and live imaging. (a) The various components of the station are built around an inverted microscope to permit live imaging during experiments. (b) A close-up view of the MFP positioning system that provides precise x-, y-, and z-positioning of the MFP and allows adjusting the parallelism with the bottom substrate. An environmental chamber completes the setup but is not shown. Reprinted with permission,18 Copyright 2010, American Institute of Physics. | ||
Surface bio-patterning
Patterning surfaces with biological molecules has broad applications in immunoassays, biosensors, cell biology, drug discovery, and tissue engineering.24 There are various methods and technologies to process and pattern surfaces. Inkjet printing has been the method of choice for microarray patterning, but printing is performed in a dry environment and consequently evaporation and drying of reagents is a challenge.25 Photolithographic technologies are highly developed for patterning surfaces with complex patterns.26,27 However, they rely on harsh chemical processes that are not compatible with biological samples. Soft lithography, a technique where structures are fabricated using elastomeric stamps or molds, has allowed for more flexible and low-cost methods for tailoring and patterning surfaces. Soft lithographic patterning methods include microcontact printing28 and microfluidic networks,28,29 both of which helped circumvent drying issues associated with inkjet printing. However, microcontact printing can only pattern a single biomolecule per print, and microfluidic networks can only be used on small surfaces, and both methods depend on a direct contact between the elastomeric device and the substrate.28–30The MFP was applied to surface patterning and combines advantages of microfluidics along with the flexibility and addressability of inkjet printing. The MFP can be positioned at an arbitrary location, and be used to flush and process the surface below it with the microstream. This approach was used to deliver protein solutions that were locally adsorbed and patterned on the surface. However, unlike inkjet that ejects and deposits a droplet on the surface, which remains and allows for the adsorption of the molecules in the droplet to the surface, with the MFP the surface is only processed while it is positioned above it. By keeping the working gap between the MFP and the surface small, rapid mass transfer and molecular adsorption to the surface occur, and individual spots of proteins can be patterned in a few tenths of a second.11
Another advantage of the MFP is that the HFC can be adjusted, and hence the spot shape can be altered “on-the-fly” by controlling the HFC, Fig. 2b&c. Consequently, complex patterns can be generated by scanning the MFP across the surface and changing the HFC. It was also found that depending on the direction of the displacement relative to the microstream, different patterning effects could be produced for high velocities and notably the contact between the microstream and the substrate suppressed when the displacement was sufficiently fast. Using this strategy, an array11 with over 1300 protein spots was made while maintaining sample consumption to less than ∼300 nl, Fig. 5a.
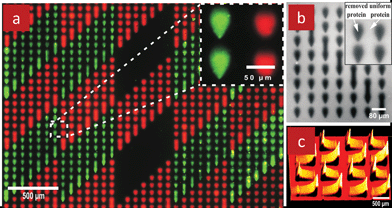 | ||
| Fig. 5 Biopatterning with the MFP. (a) Fluorescence micrograph of an array of two different proteins patterned using the MFP. The first deposited protein was a TRITC-labeled goat IgG (red). The second protein, a rabbit IgG did not have a label, but was stained with a FITC-labeled anti-rabbit IgG (green) following the patterning process. (b) Fluorescence micrograph of an array of TRITC-labelled goat IgG. The white color are fluorescent proteins that were homogeneously adsorbed on the glass slide, and the black spots represent the areas where proteins were removed by delivering a detergent solution using the MFP (c) An intensity profile of a gradient array of TRITC-labelled goat IgGs on a glass slide by ramping the MFP's scanning speed. The 3D intensity graphic reflects the surface-density of the proteins on the surface. | ||
The array comprises two different proteins (labelled with red and green fluorescent dyes) that were patterned on a glass slide with a density of 15,000 spot/cm2. Isolated spots were not obtained by stopping the flow, but by a rapid stop-and-go movement of the MFP. The “stop” consisted of a 0.3 s residency, while the “go” consisted of moving the stage at ∼10 mm s−1. Connected spots were formed by a back-and-forth movement between the two adjacent spots. The proteins were arrayed sequentially and the protein solution was exchanged between the two arrays. In another experiment, the MFP was also used to “erase” proteins from a surface by locally removing uniformly adsorbed proteins with a stream of detergent solution, Fig. 5b, using the same movement sequences as for the direct protein patterning. Lines of proteins can be “written” on surfaces continuously by moving the MFP, but as the velocity increases, there is not enough time for molecules to form a full layer, and the coverage of adsorbed molecules on the surface becomes incomplete. This effect was exploited to form gradients of proteins adsorbed to a surface by gradually decreasing (or increasing) the writing speed, and in fact arrays of density gradients occupying a few millimetre square could be formed by repeated acceleration of the MFP over different areas, Fig. 5c.
In conclusion, the MFP technology was used to pattern proteins on large surfaces and in a multiplexed manner with high density, and was able to generate complex and graded protein patterns.
Controlling the cellular microenvironment
The native cellular microenvironment is composed of extracellular matrix (a complex structural entity that is composed of several proteins surrounding and supporting a cell), soluble molecules, and neighbouring cells, and is subject to multiple reciprocal interactions.31 Stimuli and responses are highly dynamic and occur over a day for circadian rythms, hours or minutes for gradients and cell chemotactic responses, or milliseconds for electrical impulses. In conventional cell cultures, cellular microenvironments can be easily controlled for a population of cells at the scale of tens of minutes, but cannot be addressed locally at the level of individual cells with shorter time scales.32 Microfluidics offer much greater spatiotemporal control which can be achieved by switching and exchanging solutions on a scale of milliseconds in some devices.33 Microfluidics were thus used to modulate cellular microenvironments by replicating in vivo conditions, and by creating artificial conditions that allow for the study of underlying signal transduction pathways and their response time.34–36 However, it is challenging to expose selected cells locally with short time scales when using closed-channel microfluidic devices, as we discussed previously.The MFP is well suited for selectively perfusing groups of cells, single cells or even sub-cellular features. For example, a single cell was detached from a dish by placing the MFP above the cell and flushing it with trypsin, Fig. 6. Although not demonstrated, it should be possible to deposit the captured cell at a different location by switching the flow. The MFP was also used to selectively label sub-populations of fixed cells, Fig. 7a–b, and living cells, Fig. 7c–d, as well as to selectively fixate living cells within a tissue, Fig. 7e, by scanning it across them. Moreover, the MFP is an attractive tool for the study of cellular dynamics as it allows to locally perfuse drugs and reagents for hours on, or with a temporal resolution of a few tenths of a second while continuously imaging the cells of interest.
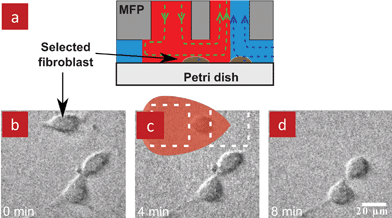 | ||
| Fig. 6 Use of the MFP for detaching and collecting selected living adherent cells. (a) A cross-sectional schematic of the MFP positioned atop a target cell. (b) A micrograph showing the selected fibroblast and two neighbouring cells. (c) Fibroblast being perfused with a trypsin solution. Dashed lines outline the apertures of the MFP and the red overlay shows the HFC of trypsin solution. (d) Image after detachment of the cell showing that the neighbouring cells remain. | ||
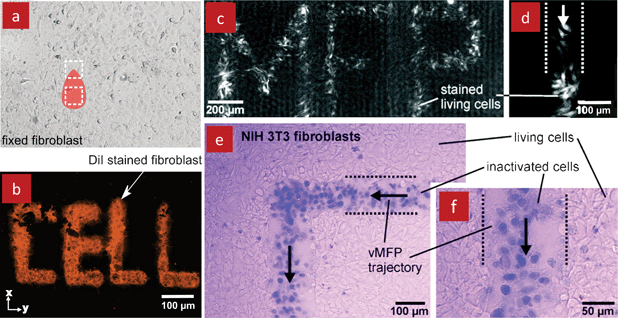 | ||
| Fig. 7 Selective labelling and deactivation of cells in culture with the MFP. (a) Phase contrast image of a fixed monolayer of fibroblasts (with MFP overlay) that was processed selectively with a fluorescent dye (DiI) with the MFP to form the word “CELL” as shown in (b). (c) Selective labelling of living fibroblasts with a fluorescent dye (Cellomics) forming the word “MFP”. (d) An enlarged view of labelled living fibroblasts. (e) Selective inactivation of a monolayer of fibroblasts with 2.5% sodium hypochlorite. Deactivated cells were subsequently stained with trypan blue while living cells remained unstained. (f) Enlarged view of the deactivated cells revealing morphological changes. (c–f) Reprinted with permission from Langmuir, Copyright 2011 American Chemical Society.20 | ||
The possibilities for local perfusion afforded by the MFP are particularly pertinent to neurons which are highly branched cells with axons and dendrites. We used an MFP to locally perfuse an axon of a fixed neuron with FluoroMyelin that is taken up by the myelin sheaths surrounding the axon, Fig. 8a; this method could be used to study and monitor myelination in vitro.37 Similarly, a single axon of a live hippocampal neuron was perfused with Tumor necrosis factor-alpha (TNFα), Fig. 8b, which is implicated in the regulation of synaptic transmission upon bath application.38 These two results highlight the potential for the MFP to uncover how cells respond to local applications of cues, and whether the response will be restricted to the zone of application, or spread throughout the cell and if yes, at what rate.
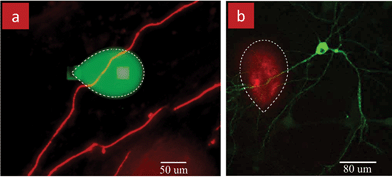 | ||
| Fig. 8 MFPs for localized stimulation of neuronal axons and dendrites. (a) Local perfusion of an axon in a fixed culture of dorsal root ganglia neurons in a dish. Neurons were stained with the myelin basic protein MPB (red) for visualization and to label myelin. The MFP was used to perfuse a solution of FluoroMyelin to study axonal myelin. FluoroMyelin is mixed with Fluorescein (green) to visualize the local perfusion. (b) Stimulation of an axon of a rat hippocampal neuron with TNFα to study synaptic plasticity. Neurons are transfected with pHluorin-GluR1 (green) which labels the glutamate receptors type 1 (GluR1). TNF is mixed with dextran (red) to visualize the local stimulation. | ||
In summary, the MFP was used with dissociated cells and tissue cultures to manipulate individual adherent cells, label single cells and sub-populations of cells, and used for localized chemical stimulation at the sub-cellular level on neurons. It would be interesting to chemically deactivate a certain subpopulation of cells and remove them from the tissue culture altogether, which can be envisioned as a controlled scratch wound healing assay that is typically performed for the study of cellular migration, cellular division, or tissue reorganization.39,40 The MFP might also be combined with microelectrode array technology41 to study the electrical changes in neuronal networks in response to topical application of neuromodulators.
Local processing of tissue slices
Tissue slices that are obtained through biopsies possess the natural tissue-matrix configuration42 and better represent the actual physiological settings of the organ than in vitro cultures of dissociated cells.43 Thus, there is high demand for experimentation on actual tissue slices44,45 because more physiologically relevant information (e.g. about metabolism and toxicity of the candidate drug) can be obtained.46Microfluidic systems were recently adapted to the study of tissue slices47 with the benefit of reduced reagent consumption, multiplexing capabilities and an increased throughput.48 Microfluidics have been developed for tissue slice culture with continuous laminar perfusion and used for electrophysiological studies,49 biomarker discovery,50 and toxicology studies.51 However, placing and culturing a large tissue slice inside a closed microfluidic chamber is cumbersome, and it is difficult to establish a long-term culture of tissue slices inside a microfluidic device because of insufficient nutrients and oxygen exchange between the slice and the laminar stream, which is diffusion-limited across the tissue slice.52
It is also possible to use the MFP to locally perfuse tissue slices, that were cultured according to the conventional protocols such as the roller-tube technique.53 The MFP was notably used with organotypic hippocampal brain slices. Organotypic brain slices have preserved neuronal connectivity, synaptic transmission, and glial-neuronal complexes,54 and thus they are commonly used to study learning and memory, neuronal regeneration following injuries, and are used as models for neurological diseases such as epilepsy.55 A perfusion chamber was designed to fit in an inverted confocal microscope while permitting high magnification imaging, allowing rapid insertion of the coverslip with the tissue slice, and providing space to place the MFP atop of the slice. This chamber was used to perfuse a hippocampal organotypic slice.19 Red fluorescent dextran was locally perfused on the slice and the distribution of the dye within the slice mapped by recording multiple image sections at different depth using live confocal imaging, Fig. 9. The dextran penetrated to a depth of 32 μm inside the 70 μm thick slice after 12 min of perfusion. This suggests that mass transport inside the slice is not dominated by convection, but diffusion.
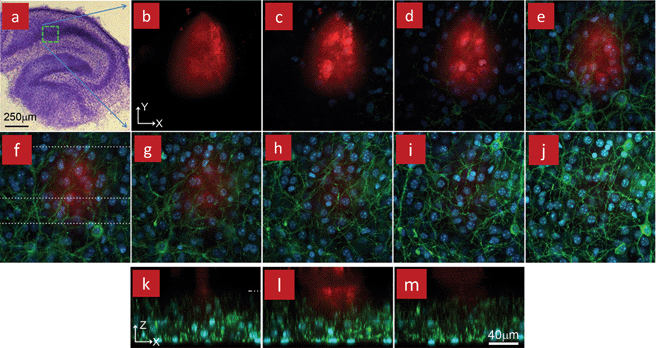 | ||
| Fig. 9 A fixed organotypic slice from an L15 transgenic mouse was perfused locally with a dextran for 12 min using a MFP. (a) Overview of a fixed and stained mouse organotypic hippocampal slice. The slice mounted on a coverslip was placed in a chamber with the coverslip serving as substrate to permit high resolution imaging using an inverted microscope. (b–j) Confocal images showing the dextran (red) distribution underneath the MFP and through the 70 μm thick slice. Micrographs are showing the XY images starting from 76 μm above the coverslip (b), down to 33 μm above the coverslip (j), with a 5.4 μm step size between each image. Blue (DAPI) and green (mGFP) colors represent the cell nuclei and membranes, respectively. No dextran is visible in (i,j), indicating that the maximal depth is less than 32 μm. (k–m) Confocal micrographs showing the different XZ cross-sections along the dashed lines shown in (f). These micrographs are showing the dextran confinement along the vertical plane. For reference, the top of the slice is indicated by the dashed line in (k). Reproduced by permission of The Royal Society of Chemistry.19 | ||
The MFP was also used for immunohistochemistry (IHC) on cancerous tissue slices.21 IHC is a staining procedure where labelled antibodies are applied to the tissue and bind to the antigens if they are expressed, which is revealed as a stain. IHC is part of the standard of care and is used in surgical pathology to classify cancers type and progression based on the expression of specific proteins in the tissue sections and serves as the basis for therapeutical decisions.56–58 The MFP was placed atop an invasive ductal carcinoma breast cancer tissue and several spots of the tissue were stained by local perfusion with an antibody that labels the tumor suppressor protein p53, Fig. 10a. The MFP was moved rapidly from one spot to the next so that non-stained separation areas were left between spots. Multiplexing was performed by subsequently staining the same tissue with an anti-progesterone receptor (PR) antibody, Fig. 10b. Furthermore, the MFP was used with tissue microarrays58,59 which comprise millimeter-sized section of tissues from different patients, Fig. 10c. Each section of the array was stained with three antibodies including the two mentioned above and an antibody against the estrogen receptor (ER), Fig. 10d. ER and PR are the two traditional stains used to classify breast cancer tissue. The vertical and horizontal patterns shown in the micrographs are hematoxylin counterstaining lines. Counterstaining is a typical step of the IHC procedure, which is useful to show the morphological characteristics of the tissue.
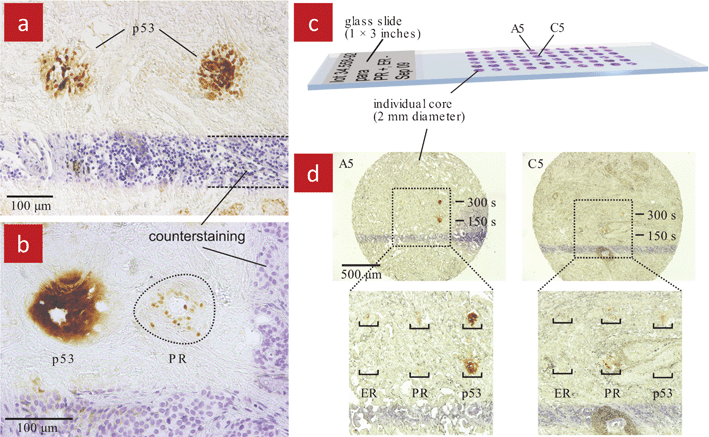 | ||
| Fig. 10 Localized immunohistochemistry (IHC) executed using a MFP on 4 μm thick, well-differentiated invasive ductal carcinoma breast tissue sections. (a) Several spots on the same slice were stained to target the tumour suppressor protein p53. (b) Multiplexing was achieved by staining two different target proteins, the p53 and the progesterone receptor (PR) on the same slice. (c) A tissue microarray of infiltrating ductal carcinoma breast tissue. Each individual core is 2 mm in diameter. (d) Selected cores of the tissue array (here A2 and B5) stained for p53, progesterone, and estrogen receptor (ER) proteins. Each core was stained for each protein twice, once at 150 s residency time of the MFP, and once at 300 s. These images illustrate the potential of the MFP for medical applications. | ||
In conclusion, the MFP was used to locally stimulate tissue slices, and implement IHC procedures; this resulted in minimized use of reagents, reduced time of experimentation, a cutback on the required amount of tissue, high-throughput readout, and an increased ability to multiplex. The MFP might also be combined with electrophysiology measurements to study the electrical properties of the tissue slice in response to perfusion with drugs.60
Also, it will be interesting to expand the study on tissue staining and include the human epithelial growth factor receptor 2 (HER2) as part of the stain to replicate the common staining procedure used to establish cancer status and progression.61 The use of the MFP with tissue slices could be combined with other technologies such as two-photon fluorescence microscopy for deep imaging.
Generating concentration gradients of biochemicals
Biochemical concentration gradients are fundamental in many biological processes and play key roles in the differentiation of cells and development of organisms.62–64 Multiple methods have been developed for establishing in vitro biochemical gradients, such as tissue explant co-cultures,65 hydrogels trapped between two fluids, one with the chemical serving as source and the other serving as sink,66 or micropipettes that dispense small volumes of reagents into the cell medium.67 Unfortunately, these methods lack reproducibility and offer no or only limited temporal control.68,69 A multitude of microfluidic devices for controlled gradient generation have been developed that afford much greater spatiotemporal control and long term stability.68,69 However, microfluidic approaches typically face a trade-off between temporal control and minimizing shear stress.68 Rapid gradient switching depends on high flow speed, but this also entails high shear stress which can affect cells, notably neurons and stem cells that are particularly sensitive to outside perturbations.We recently proposed the floating gradient concept that is formed at the stagnation point at the centre of a microfluidic quadrupole, and which can be rapidly switched yet incurs minimal shear stress.22 The gradient was formed below a MFP with four apertures arranged at the corners of a virtual square, Fig. 11a. A cross-sectional schematic of the MFP immersed in solution above a substrate is shown in Fig. 11b. Concurrent injection of liquid from the two opposite apertures results in a head-on flow configuration at the centre under the MFP produces a stagnation point (SP). The concurrent aspiration from the other two apertures results in the hydrodynamic confinement of the injected streams when the aspiration flow rate is significantly higher than the injection flow rate, Fig. 11c–e. As a result a quadrupole-like microfluidic field is formed, Fig. 11f, with the SP at the centre and a laminar interface between the two injected fluids. There is no flow at the SP, and thus for cells right below and close to the SP, the shear stresses are negligible. As consequence diffusion also dominates mass transport at the SP and form a stationary gradient.
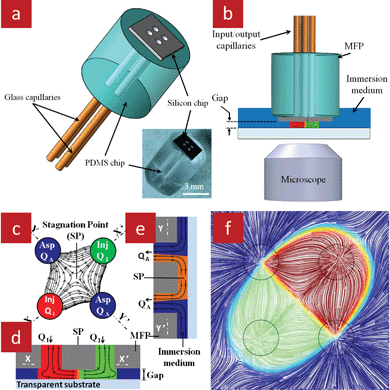 | ||
| Fig. 11 A MFP with four apertures used to generate a quadrupolar flow and to form a floating gradient in an open space. (a) 3D representation of the MFP with a micrograph of an actual device in the inset. (b) The MFP is placed parallel to the bottom substrate to form a narrow gap while immersed in the surrounding medium. (c) Schematics of the quadrupolar flow and stagnation point formed at the center. Chemicals are confined by using aspiration flow rates exceeding the injection flow rates. (d) The X–X′, and (e) Y–Y′ cross-sectional views of the injected chemicals confined in the gap between the MFP and the bottom substrate. (f) 3D simulation of the flow under the MFP illustrating the quadrupolar flow field, confinement, SP, and gradient formed at the interface between the two streams. | ||
Such a stationary concentration gradient was formed by injecting fluorescein in water from one of the injection apertures and water from the other, while aspirating both streams back through the aspiration apertures, Fig. 12a. Interestingly, the concentration gradient formed along the interface at the SP is propagated along the entire interface between the two streams, Fig. 12b. The shear stress however is only zero at the SP, and increases linearly when moving towards the aspiration aperture.22 Thus, using this setup it will be possible to expose cells to stationary concentration gradients and to test the effect of shear stress by positioning the cells at different distances from the aspiration aperture.
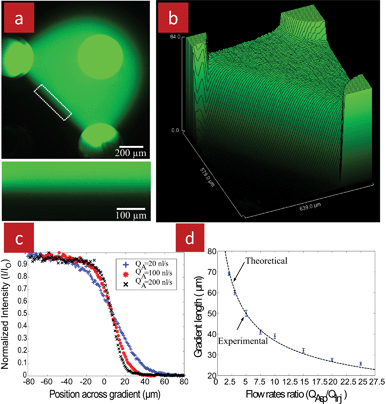 | ||
| Fig. 12 Floating concentration gradient formed using the quadrupolar MFP. (a) A fluorescent micrograph obtained using an inverted microscope. Solutions of fluorescein and pure water were injected through the top right and bottom left apertures, respectively, and aspirated back in through the other two apertures. A gradient was formed across the SP and all along the interface of the two injected solutions. A close up view of the concentration gradient corresponding to the white rectangle is shown in the inset. (b) Surface plot of the fluorescence intensity within the quadrupole. (c) Fluorescent intensity profiles of the gradients generated across the SP for different aspiration flow rates, illustrating the range of gradient slopes that can be obtained by adjusting the QA/QI ratio. (d) Measured and calculated length of the gradient with different aspiration flow rates (the injection flow rate for all cases was kept constant at 10 nl s−1). | ||
The gradient slope can be rapidly changed, within a few seconds, simply by changing the aspiration flow rates, Fig. 12c&d. Moreover, the gradient can be moved hydrodynamically along with the SP by changing the flow ratio between the two injection apertures, thus pushing the SP to the aperture with the lower flow rate. The gradient which is centred on the SP thus “floats” between the two streams. In addition, the MFP itself can be displaced, thus providing an additional degree of freedom to position the gradient at any position over a substrate. These characteristics are now used to study cell chemotaxis under different conditions.
By arranging multiple apertures into a quadrupole configuration, SPs and floating gradients were generated using the MFP, and scanned across surfaces. Double gradients may readily be formed where each stream serves both as the source and the sink, respectively, continuously replenishing one chemical and continuously carrying away the other chemical. We expect that floating gradients will be useful for cell chemotaxis studies.
Conclusion and outlook
With the MFP, microfluidic streams are delivered to the underlying sample without contact. The MFP designs have evolved and many new probes now follow a vertical setup and can be manipulated like pipettes, but while generally maintaining a Hele–Shaw flow condition. A variety of samples or substrates have been processed using the MFP without need for specific or modified protocols or particular sample preparation, notably in the case of cell and tissue culture. The MFP was used to deposit complex and multiple proteins patterns with spots that were 50 μm long with a density of 15,000 spot/cm2. Moreover, using the MFP technology, adherent cells with the size of 20 μm were selectively removed from a dissociated cell culture and cells stimulated with sub-cellular resolution. The MFP was also used with tissue cultures to selectively process sub-populations of cells, (∼50 μm resolution), and with multi-layer tissue slices to deliver reagents with a spatial resolution of less than 100 μm. In addition, the MFP was used to perform multiplex IHC staining on invasive ductal carcinoma breast cancer tissues. Each spot of staining was around 100 μm in size, which allowed for performing multiple staining on the same slice with minimized reagents consumption (100× less than the conventional methods). Convective flow of reagents that is associated with the MFP allowed for faster staining process, which was reported to be 20 s for each spot in comparison to more than 30 min with the conventional methods. Moreover, tunable and mobile concentration gradients were generated using MFPs fabricated with two pairs of injection and aspiration apertures.These results illustrate the strength of the MFP, and notably the ability to process surfaces and objects while immersed in solution using a stream. However this approach has some drawbacks, and if the processing time is long, only small areas can be processed within a given time. Under such circumstances, forming large microarrays will be prohibitive. Or performing biological studies with cells that require many repeat experiments to reach statistical significance will be impractical. However, the MFP is well suited for single cell experiments that require dynamic monitoring of the cell response following localized chemical stimulation. It is worth mentioning that the integration of MFP with microscopes allows real-time observation and characterization of the flow which is particularly useful for cell biological applications, but the MFP can of course be operated in the absence of a microscope to pattern any sort of surface.
The aperture-size of the different MFPs has been varied from 360 μm to 20 μm depending on the application, but it should be possible to make smaller and more closely spaced apertures following the development of novel designs and microfabrication processes. Conversely, it may also be possible to make MFPs with arrays of apertures to process multiple areas simultaneously.
Thus, MFPs have opened up new experimental avenues for life sciences research by overcoming the limitations of closed-channel microfluidics. We believe that the MFP will further empower the field of life sciences and develop new experimental methodologies, and will be a valuable tool in medicine when developed for pathological staining for example.
Acknowledgements
We are greatly thankful to David Stellwagen, Nageswara R Ghattamaneni, and Dalinda Liazoghli from McGill University and the Montreal Neurological Institute for supplying neuronal cultures and contributing with the use of MFPs with these cultures. We thank Govind V. Kaigala and Emmanuel Delamarche from IBM Zurich Research Laboratory for sharing their figures and Adiel Mallik for critical reading the manuscript. M.A.Q. acknowledges Alexander Graham Bell Canada Graduate Scholarship (CGSD) and S.G.R. the NSERC-CREATE Integrated Sensors Systems and Neuroengineering programs, while D.J. acknowledges support from a Canada Research Chair.References
- C. Hansen and S. R. Quake, Curr. Opin. Struct. Biol., 2003, 13, 538–544 CrossRef CAS.
- G. A. Cooksey, J. T. Elliott and A. L. Plant, Anal. Chem., 2011, 83, 3890–3896 CrossRef CAS.
- R. Cheong, C. J. Wang and A. Levchenko, Sci. Signaling, 2009, 2, 12 Search PubMed.
- A. M. Skelley, O. Kirak, H. Suh, R. Jaenisch and J. Voldman, Nat. Methods, 2009, 6, 147–152 CrossRef CAS.
- H. Hou, W. Lee, M. Leong, S. Sonam, S. Vedula and C. Lim, Cell. Mol. Bioeng., 2011, 4, 591–602 Search PubMed.
- D. R. Albrecht, G. H. Underhill, J. Resnikoff, A. Mendelson, S. N. Bhatia and J. V. Shah, Integr. Biol., 2010, 2, 278–287 RSC.
- M. R. Bennett and J. Hasty, Nat. Rev. Genet., 2009, 10, 628–638 CrossRef CAS.
- J. Li and F. Lin, Trends Cell Biol., 2011, 21, 489–497 CrossRef CAS.
- E. W. K. Young and D. J. Beebe, Chem. Soc. Rev., 2010, 39, 1036–1048 RSC.
- G. M. Walker, H. C. Zeringue and D. J. Beebe, Lab Chip, 2004, 4, 91–97 RSC.
- D. Juncker, H. Schmid and E. Delamarche, Nat. Mater., 2005, 4, 622–628 CrossRef CAS.
- G. K. Batchelor, An Introduction to Fluid Dynamics, Cambridge University Press, London, 2000 Search PubMed.
- D. Chen, W. Du, Y. Liu, W. Liu, A. Kuznetsov, F. E. Mendez, L. H. Philipson and R. F. Ismagilov, Proc. Natl. Acad. Sci. U. S. A., 2008, 105, 16843–16848.
- H. Shiku, T. Yamakawa, Y. Nashimoto, Y. Takahashi, Y.-s. Torisawa, T. Yasukawa, T. Ito-Sasaki, M. Yokoo, H. Abe, H. Kambara and T. Matsue, Anal. Biochem., 2009, 385, 138–142 CrossRef CAS.
- A. Ainla, E. T. Jansson, N. Stepanyants, O. Orwar and A. Jesorka, Anal. Chem., 2010, 82, 4529–4536 CrossRef CAS.
- A. Ainla, G. Jeffries and A. Jesorka, Micromachines, 2012, 3, 442–461 Search PubMed.
- D. L. Robert, D. Ute and D. Emmanuel, J. Micromech. Microeng., 2009, 19, 115006 CrossRef.
- C. M. Perrault, M. A. Qasaimeh, T. Brastaviceanu, K. Anderson, Y. Kabakibo and D. Juncker, Rev. Sci. Instrum., 2010, 81, 115107–115108 CrossRef CAS.
- A. Queval, N. R. Ghattamaneni, C. M. Perrault, R. Gill, M. Mirzaei, R. A. McKinney and D. Juncker, Lab Chip, 2010, 10, 326–334 RSC.
- G. V. Kaigala, R. D. Lovchik, U. Drechsler and E. Delamarche, Langmuir, 2011, 27, 5686–5693 CrossRef CAS.
- R. D. Lovchik, G. V. Kaigala, M. Georgiadis and E. Delamarche, Lab Chip, 2012, 12, 1040–1043 RSC.
- M. A. Qasaimeh, T. Gervais and D. Juncker, Nat. Commun., 2011, 2, 464 Search PubMed.
- C. M. Perrault, M. A. Qasaimeh and D. Juncker, J Vis Exp, 2009, e1418 Search PubMed.
- A. Khademhosseini, S. Jon, K. Y. Suh, T. N. T. Tran, G. Eng, J. Yeh, J. Seong and R. Langer, Adv. Mater., 2003, 15, 1995–2000 CrossRef CAS.
- J. T. Delaney, P. J. Smith and U. S. Schubert, Soft Matter, 2009, 5, 4866–4877 RSC.
- E. E. Hui and S. N. Bhatia, Langmuir, 2007, 23, 4103–4107 CrossRef CAS.
- S. Wang, C. Wong Po Foo, A. Warrier, M.-m. Poo, S. Heilshorn and X. Zhang, Biomed. Microdevices, 2009, 11, 1127–1134 CrossRef CAS.
- R. S. Kane, S. Takayama, E. Ostuni, D. E. Ingber and G. M. Whitesides, Biomaterials, 1999, 20, 2363–2376 CrossRef.
- M. Pla-Roca and D. Juncker, in Biological Microarrays, ed. A. Khademhosseini, K.-Y. Suh and M. Zourob, Humana Press, 2011, vol. 671, pp. 177–194 Search PubMed.
- E. Delamarche, D. Juncker and H. Schmid, Adv. Mater., 2005, 17, 2911–2933 CrossRef CAS.
- C. M. Nelson and M. J. Bissell, Annu. Rev. Cell Dev. Biol., 2006, 22, 287–309 CrossRef CAS.
- G. Velve-Casquillas, M. Le Berre, M. Piel and P. T. Tran, Nano Today, 2010, 5, 28–47 CrossRef CAS.
- A. Folch and M. Toner, Annu. Rev. Biomed. Eng., 2000, 2, 227–256 CrossRef CAS.
- K. R. King, S. Wang, A. Jayaraman, M. L. Yarmush and M. Toner, Lab Chip, 2008, 8, 107–116 RSC.
- S. Takayama, E. Ostuni, P. LeDuc, K. Naruse, D. E. Ingber and G. M. Whitesides, Chem. Biol., 2003, 10, 123–130 CrossRef CAS.
- S. Takayama, J. C. McDonald, E. Ostuni, M. N. Liang, P. J. A. Kenis, R. F. Ismagilov and G. M. Whitesides, Proc. Natl. Acad. Sci. U. S. A., 1999, 96, 5545–5548 CrossRef CAS.
- D. Liazoghli, A. D. Roth, P. Thostrup and D. R. Colman, ACS Chem. Neurosci., 2011, 3, 90–95 Search PubMed.
- D. Stellwagen and R. C. Malenka, Nature, 2006, 440, 1054–1059 Search PubMed.
- J. Yarrow, Z. Perlman, N. Westwood and T. Mitchison, BMC Biotechnol., 2004, 4, 21 CrossRef.
- A. D. van der Meer, K. Vermeul, A. A. Poot, J. Feijen and I. Vermes, Am. J. Physiol.: Heart Circ. Physiol., 2010, 298, H719–H725 CrossRef CAS.
- T. M. Pearce, J. A. Wilson, S. G. Oakes, S.-Y. Chiu and J. C. Williams, Lab Chip, 2005, 5, 97–101 RSC.
- F. McCarthy, A. Fletcher, N. Dennis, C. Cummings, H. O'Donnell, J. Clark, P. Flohr, R. Vergis, S. Jhavar, C. Parker and C. S. Cooper, J. Clin. Pathol., 2009, 62, 694–698 Search PubMed.
- J. Kim, R. Stein and M. O'Hare, Breast Cancer Res. Treat., 2004, 85, 281–291 CrossRef.
- F. Pampaloni, E. G. Reynaud and E. H. K. Stelzer, Nat. Rev. Mol. Cell Biol., 2007, 8, 839–845 CrossRef.
- J. C. Davila, R. J. Rodriguez, R. B. Melchert and D. Acosta, Annu. Rev. Pharmacol., 1998, 38, 63–96 Search PubMed.
- P. M. van Midwoud, M. T. Merema, E. Verpoorte and G. M. M. Groothuis, Journal of the Association for Laboratory Automation, 2011, 16, 468–476 Search PubMed.
- P. M. van Midwoud, E. Verpoorte and G. M. M. Groothuis, Integr. Biol., 2011, 3, 509–521 RSC.
- M. S. Kim, T. Kim, S.-Y. Kong, S. Kwon, C. Y. Bae, J. Choi, C. H. Kim, E. S. Lee and J.-K. Park, PLoS One, 2010, 5, e10441 CrossRef.
- A. J. Blake, T. M. Pearce, N. S. Rao, S. M. Johnson and J. C. Williams, Lab Chip, 2007, 7, 842–849 RSC.
- B. Song, V. Sivagnanam, C. D. B. Vandevyver, I. Hemmila, H.-A. Lehr, M. A. M. Gijs and J.-C. G. Bunzli, Analyst, 2009, 134, 1991–1993 RSC.
- P. M. van Midwoud, G. M. M. Groothuis, M. T. Merema and E. Verpoorte, Biotechnol. Bioeng., 2010, 105, 184–194 CrossRef CAS.
- K. Rambani, J. Vukasinovic, A. Glezer and S. M. Potter, J. Neurosci. Methods, 2009, 180, 243–254 CrossRef.
- B. H. Gähwiler, S. M. Thompson and D. Muller, in Current Protocols in Neuroscience, John Wiley & Sons, Inc., 2001 Search PubMed.
- B. H. Gähwiler, M. Capogna, D. Debanne, R. A. McKinney and S. M. Thompson, Trends Neurosci., 1997, 20, 471–477 CrossRef CAS.
- L. Sundstrom, A. Pringle, B. Morrison and M. Bradley, Drug Discovery Today, 2005, 10, 993–1000 Search PubMed.
- R. A. Walker, Histopathology, 2006, 49, 406–410 Search PubMed.
- C. M. Perou, T. Sorlie, M. B. Eisen, M. van de Rijn, S. S. Jeffrey, C. A. Rees, J. R. Pollack, D. T. Ross, H. Johnsen, L. A. Akslen, O. Fluge, A. Pergamenschikov, C. Williams, S. X. Zhu, P. E. Lonning, A.-L. Borresen-Dale, P. O. Brown and D. Botstein, Nature, 2000, 406, 747–752 CrossRef CAS.
- S. R. Lakhani and A. Ashworth, Nat. Rev. Cancer, 2001, 1, 151–157 Search PubMed.
- G. Sauter, R. Simon and K. Hillan, Nat. Rev. Drug Discovery, 2003, 2, 962–972 CrossRef CAS.
- J. S. Mohammed, H. H. Caicedo, C. P. Fall and D. T. Eddington, Lab Chip, 2008, 8, 1048–1055 RSC.
- C. B. Moelans, R. A. de Weger, E. Van der Wall and P. J. van Diest, Crit. Rev. Oncol. Hematol., 2011, 80, 380–392 Search PubMed.
- H. Ali, R. M. Richardson, B. Haribabu and R. Snyderman, J. Biol. Chem., 1999, 274, 6027–6030 CrossRef.
- S. Nourshargh, J. Perkins, H. Showell, K. Matsushima, T. Williams and P. Collins, The Journal of Immunology, 1992, 148, 106–111 Search PubMed.
- E. Tomhave, R. Richardson, J. Didsbury, L. Menard, R. Snyderman and H. Ali, The Journal of Immunology, 1994, 153, 3267–3275 Search PubMed.
- H. Chen, Z. He, A. Bagri and M. Tessier-Lavigne, Neuron, 1998, 21, 1283–1290 CrossRef.
- E. F. Foxman, J. J. Campbell and E. C. Butcher, J. Cell Biol., 1997, 139, 1349–1360 CrossRef CAS.
- G.-l. Ming, S. T. Wong, J. Henley, X.-b. Yuan, H.-j. Song, N. C. Spitzer and M.-m. Poo, Nature, 2002, 417, 411–418 CrossRef.
- T. M. Keenan and A. Folch, Lab Chip, 2008, 8, 34–57 RSC.
- S. Toetsch, P. Olwell, A. Prina-Mello and Y. Volkov, Integr. Biol., 2009, 1, 170–181 RSC.
| This journal is © The Royal Society of Chemistry 2013 |
