Enantioselective reduction of sparingly water-soluble ketones: continuous process and recycle of the aqueous buffer system†
Susanne
Leuchs
a,
Shukrallah
Na'amnieh
b and
Lasse
Greiner
*ac
aDECHEMA-Forschungsinstitut, Theodor-Heuss-Allee 25, 60486 Frankfurt am Main, Germany. E-mail: greiner@dechema.de; Fax: +49 69 7564 388; Tel: +49 69 7564 428
bJohnson Matthey X-Zyme, Merowingerplatz 1a, 40225 Düsseldorf, Germany
cInstitut für Technische und Makromolekulare Chemie, RWTH Aachen University, Worringerweg 1, 52074 Aachen, Germany
First published on 2nd November 2012
Abstract
Low solubility of starting materials and products in water and low enzyme utilisation are the two main obstacles for the production of enantiopure long-chain alcohols with alcohol dehydrogenases. A combination of techniques was used to overcome these limitations. A previously identified ionic liquid was used as a detergent to increase the low solubility for the starting materials as well as for the products. The low enzyme utilisation was increased by using ultrafiltration in an enzyme membrane reactor. Based on kinetic characterisation and stability data of the alcohol dehydrogenase from Lactobacillus brevis and glucose dehydrogenase from Bacillus sp. used for ketone reduction and cofactor regeneration, respectively, a continuous process was realised. In a configuration of a cascade of two enzyme membrane reactors the process could be demonstrated for more than 1000 hours with turnover numbers of more than 106 and space time yields of up to 34 g L−1 d−1 with 99.9% enantioselectivity. Furthermore, downstream processing via adsorption of the alcohols was included, allowing 90% recycle of the aqueous buffer. Thus, the E-factor (amount of waste stream per product) was reduced to 13.
1 Introduction
In view of the growing demand for enantiopure substances, especially in the pharma industry,1 asymmetric reduction with soluble precious metal catalysts and other means like the reduction after Corey, Bakshi and Shibata (CBS-reduction) has been investigated extensively with great success.2–7 However, those catalysts lack enantioselectivity for the reduction of long-chain aliphatic ketones.8,9 The use of oxidoreductases is a straightforward way to produce enantiomerically pure substances starting from prochiral ketones and is being applied more and more for the synthesis of active pharmaceutical ingredients (API).10 An oxidoreductase with outstanding selectivity and activity towards long-chain aliphatic ketones is the alcohol dehydrogenase from Lactobacillus brevis (LbADH).11 The need of oxidoreductases for expensive cofactors is generally regarded as their main drawback. Nowadays, a number of high standard oxidoreductases for the in situ regeneration of cofactors are available. Therefore, cofactor costs are significantly reduced.1 However, the cofactor contribution to the overall cost of a process depends on several aspects and has to be assessed individually for every case. The cofactor turnover number (TON, molproduct/molcofactor) is directly coupled to the amount of substrate which can be dissolved as well as the overall conversion. To overcome this limitation, the advantages of using ionic liquids (IL) as a solubiliser for hardly water-soluble substrates have been proven recently. Especially, NR4+Cl−-IL were beneficial for the TON of the cofactor as well as for the space-time-yield (STY) and the reaction rate.12,13Biocatalysis is generally regarded as safer, greener and more sustainable than conventional chemical catalysis.14 This is often credited with the fact that water is used as a solvent. It is true that the environmental impact of water at an ambient temperature is low, but high salt loadings can be imposed by process needs. In addition, extraction is typically included for down-stream-processing in order to avoid energy intensive evaporation of water. Low product concentrations in the aqueous phase lead to the extraction step often being ineffective.14 A method which is suitable for concentrating substances from aqueous diluted solutions is adsorption, also called solid-phase extraction (SPE).15,16 This method is easy to handle, easy to automate, and the formation of emulsions is avoided. In addition, the aqueous solution is not contaminated with organic solvents, which simplifies its disposal and allows for water recycling, even when solvent-sensitive biocatalysts are used.
2 Experimental
Reporting our experimental data, we followed the standards given in ref. 17 as closely as possible.2.1 Chemicals
All ketones and alcohols were purchased from Sigma-Aldrich, Schnelldorf, Germany. N-Methyl-N-trimethylsilyl-trifluoroacetamide (MSTFA) came from CS-Chromatographie-Service, Langerwehe, Germany. All other chemicals were obtained from Carl-Roth, Karlsruhe, Germany. Ethanol and n-heptane were of technical grade. Ultrapure water was obtained by reverse osmosis and ultrafiltration in an ELGA purelab ultra-system if not stated otherwise. Enzymes were provided by X-Zyme GmbH/Johnson Matthey Catalysts. The ionic liquid TEGO IL K5 was from Evonik Industries (purity according to the material safety data sheet (MSDS): 100%, methyl chloride ≤0.03%).2.2 Preparation of reaction media
All initial rate measurements were carried out in a solution containing N-(2-acetamido)iminodiacetic acid (ADA) as a buffer with a concentration of 100 mmol L−1, containing 10 mmol L−1 MgCl2 at pH = 7.0 at 25 °C with addition of 0, 100, or 200 g L−1 TEGO IL K5. All continuous experiments were carried out in ADA-buffer with a concentration of 150 mmol L−1, containing 20 mmol L−1 MgCl2 at pH = 7.5 in the substrate solution at 25 °C with addition of 100 g L−1 TEGO IL K5. The reaction media for the continuous syntheses were prepared using a 500 mmol L−1 ADA-buffer solution. The respective volume was charged, MgCl2·6H2O, the respective amounts of IL and glucose were added. After the dissolution of all solid substances, pH was adjusted with concentrated NaOH-solution. The respective 2-ketone was then dissolved and, finally, the solution was brought to the final volume with water. This solution could be stored, cofactor was dissolved only prior to the use in the continuous synthesis in order to prevent degradation. Reaction media for kinetic measurements and stability tests were prepared in the same manner but only dissolving one of the substances glucose, gluconic-acid-δ-lactone (GDL), 2-ketone or 2-alcohol. For the stability tests of the enzymes in different buffers, the solutions were prepared accordingly, the buffers tested are the following: N-(2-acetamido)-2-aminoethanesulfonic acid (ACES); N-(2-acetamido)iminodiacetic acid (ADA); N,N-bis-(2-hydroxyethyl)-2-amino-ethane sulfonic acid (BES); 2-[4-(2hydroxyethyl)-1-piperazinyl]-ethanesulfonic acid (HEPES), potassium phosphate buffer (KPi) and piperazine-N,N-bis(2-ethane-sulfonic acid) (PIPES).2.3 Determination of protein content
Prior to the use of LbADH and GDH, the protein-content of the enzyme preparation was determined using the method proposed by Bradford18 with a commercial kit from Carl-Roth, Karlsruhe, Germany. The protein content of LbADH was 44 weight%, the protein content of GDH used with 2-octanone and 2-decanone was 14.1 weight%, and for the 2-nonanone experiment and for kinetic measurements with all 2-ketones 35.1%. The kinetics for both GDH-lots could be described with a single set of kinetic parameters.2.4 Enzyme stability
Stability was determined by storing the enzymes in the respective substrate solution in a thermomixer MKR13, HLC at 300 rpm at 25 °C at pH 7.0 if not stated otherwise. Samples of 10 μL were withdrawn and the residual activity was measured via fluorescence spectrometry (excitation at 340 nm, reading at 460 nm, BioTek Synergy MxHT) at 25 °C. For the determination of the stability in different buffer solutions, the activity was determined by adding 180 μL of a solution containing 100 mmol L−1 KPi-buffer, 1 mmol L−1 MgCl2 and 6 mmol L−1 of 2-octanone for LbADH resp. 750 mmol L−1 glucose for GDH, pH of the buffer solution was 7.0. The reaction was started with a 1 mmol L−1 cofactor solution in the same buffer to give a final cofactor concentration of 0.05 mmol L−1. To determine the activity in all other stability tests, 2-octanone and glucose were dissolved in a 100 mmol L−1 ADA-buffer-solution containing 10 mmol L−1 MgCl2. For both, LbADH and GDH, a first order degradation kinetics was assumed and half life was determined assuming first order exponential decay.192.5 Activity and kinetics
Kinetic measurements were carried out in a Biotek Powerwave HT multiplate fluorescence spectrometer in black 96-well-plates (nunc immuno modules). All kinetic measurements were conducted at a final pH of 7.0 in an ADA-buffer (100 mmol L−1 with MgCl2, 2.5 mmol L−1). The total reaction volume was 200 μL. Substrate, product, co-substrate, co-product, cofactor, and product-cofactor concentration variations were prepared in a total volume of 180 μL by dilution of stock solutions. 10 μL of a 1 mmol L−1 cofactor-solution was added to give a final concentration of 0.05 mmol L−1, the reaction was started with 10 μL of the respective enzyme-solution. The final concentration of LbADH was 1.25 mg L−1 (≅0.55 mg L−1 protein), the final concentration of GDH was 10 mg L−1 (≅3.51 mg L−1 protein). Dilution rows were prepared using stock solutions of glucose 1500 mmol L−1, gluconic acid δ-lactone 1000 mmol L−1. 2-Octanone, 2-octanol, 2-nonanone and 2-nonanol stock solutions were 6, 60 or 120 mmol L−1 in a buffer containing 0 (only for 2-octanone), 100 or 200 g L−1 ionic liquid. 3-Octanone and 3-octanol stock solution was 40 and 80 mmol L−1, 2-decanone and 2-decanol stock solution was 30 and 60 mmol L−1 in a buffer containing 100 and 200 g L−1 ionic liquid.2.6 Continuous experiments
Prior to the continuous experiments, the reactor setup (V = 0.015 L) was flushed with ethanol and water. A 10![[thin space (1/6-em)]](https://www.rsc.org/images/entities/char_2009.gif) 000 Dalton (Da) cut-off polyethersulfone membrane from Sartorius Stedim (ø = 63 mm) was soaked in water for at least 1 h and then carefully placed in the reactor avoiding air-inclusions. The reactor was flushed with ADA-buffer-solution (100 mmol L−1 ADA, 10 mmol L−1 MgCl2, pH = 7.0). The enzymes were then flushed into the reactor before the reaction was started by pumping the respective substrate solution into the reactor. All continuous experiments were started with a fresh substrate solution, the recycled substrate solution was used after 72 h of stable conversion. Conversion was determined after the first and second reactor by automatically taking samples of 0.5 μL with an autosampler (see below) from a flow cell and directly injecting the sample together with 1 μL of an internal standard (respective 1-alcohol, 20 mmol L−1 in ethanol) into the gas chromatograph (GC) for analysis. The product solution was processed using solid phase extraction. The 2-ketone and 2-alcohol content was determined via GC. If less than 0.5 mmol L−1 was detected, the solution was used for recycling by mixing it with a fresh solution (cglucose = 750 mmol L−1), pH was adjusted to the initial value of 7.5, fresh ketone was dissolved as well as 0.1 mmol L−1 cofactor, and the solution was then reused for synthesis. For the continuous syntheses the following standard reaction conditions were used: cADA-buffer = 150 mmol L−1, cMgCl2 = 20 mmol L−1, cglucose = 200 mmol L−1, cTEGO IL K5 = 100 g L−1, c2-ketone = 60 (or 30 for 2-decanone) mmol L−1, cNADP+ = 0.1 mmol L−1, pH = 7.5, τ = 2.75 h ⇒
000 Dalton (Da) cut-off polyethersulfone membrane from Sartorius Stedim (ø = 63 mm) was soaked in water for at least 1 h and then carefully placed in the reactor avoiding air-inclusions. The reactor was flushed with ADA-buffer-solution (100 mmol L−1 ADA, 10 mmol L−1 MgCl2, pH = 7.0). The enzymes were then flushed into the reactor before the reaction was started by pumping the respective substrate solution into the reactor. All continuous experiments were started with a fresh substrate solution, the recycled substrate solution was used after 72 h of stable conversion. Conversion was determined after the first and second reactor by automatically taking samples of 0.5 μL with an autosampler (see below) from a flow cell and directly injecting the sample together with 1 μL of an internal standard (respective 1-alcohol, 20 mmol L−1 in ethanol) into the gas chromatograph (GC) for analysis. The product solution was processed using solid phase extraction. The 2-ketone and 2-alcohol content was determined via GC. If less than 0.5 mmol L−1 was detected, the solution was used for recycling by mixing it with a fresh solution (cglucose = 750 mmol L−1), pH was adjusted to the initial value of 7.5, fresh ketone was dissolved as well as 0.1 mmol L−1 cofactor, and the solution was then reused for synthesis. For the continuous syntheses the following standard reaction conditions were used: cADA-buffer = 150 mmol L−1, cMgCl2 = 20 mmol L−1, cglucose = 200 mmol L−1, cTEGO IL K5 = 100 g L−1, c2-ketone = 60 (or 30 for 2-decanone) mmol L−1, cNADP+ = 0.1 mmol L−1, pH = 7.5, τ = 2.75 h ⇒ ![[V with combining dot above]](https://www.rsc.org/images/entities/i_char_0056_0307.gif) = 4 mL h−1.
= 4 mL h−1.
2.7 Solid phase extraction
The breakthrough curve as well as the down-stream-processing in the continuous synthesis was carried out using a stainless steel column 8 mm inner diameter (ID) and 250 mm length filled with 4.4 g of HR-P material (Macherey-Nagel, Düren, Germany). For the breakthrough curves, 500 mL of ADA-buffer solution (100 mmol L−1, cMgCl2 = 10 mmol L−1, c2-ketone = 30 mmol L−1, c2-alcohol = 30 mmol L−1, pH = 7.0) were prepared and pumped through the column. Fractions of ≈10–15 mL were collected. The volume of each fraction was determined and concentrations of the 2-ketone and 2-alcohol were determined using GC.2.8 Gas chromatography
The concentration of the respective ketones and alcohols was determined using an internal standard (20 mmol L−1 of the respective 1-alcohol in ethanol) by mixing 300 μL sample with 600 μL standard and subsequent analysis via GC. For the continuous syntheses, 0.5 μL samples were automatically withdrawn with an autosampler TriPlus, Thermo Scientific, Dreieich, Germany from a flow cell (V = 150 μL, workshop of the institute) in the product stream, mixed with 1 μL of standard solution and injected into a Focus or Trace GC from Thermo Scientific, Dreieich, Germany. Aqueous samples were analysed via GC (Chirasil-Dex, length 25 m, inner diameter 0.25 mm, Varian GC Capillary Columns, carrier gas: H2, 0.4 bar). Octanol: 100 °C (2 min), 5 °C min−1 to 120 °C (6.5 min), 40 °C min−1 to 180 °C (1 min), 2-octanone (4.8 min), 2-octanol (6.6 min), internal standard 1-octanol (8.7 min). Nonanol: 110 °C (1 min), 2 °C min−1 to 120 °C (1 min), 40 °C min−1 to 180 °C (2 min), 2-nonanone (7.6 min), 2-nonanol (8.7 min), internal standard 1-nonanol (9.8 min). Decanol: 120 °C (2 min), 3 °C min−1 to 150 °C (1 min), 40 °C min−1 to 180 °C (2 min), 2-decanone (5.01 min), 2-decanol (6.61 min), internal standard 1-decanol (8.4 min).To determine enantiomeric excess (ee), samples of the n-heptane phase (250 μL) were mixed with N-MSTFA (50 μL), heated to 80 °C for 30 min and analysed by GC.13 Octanol: 80 °C (4 min), 1 °C min−1 to 100 °C (10 min), 40 °C min−1 to 180 °C (1 min), (R)-2-octanol (22.8 min), (S)-2-octanol (23.1 min). Nonanol: 75 °C (60 min), 40 °C min−1 to 180 °C (1 min), (R)-2-nonanol (62.9 min), (S)-2-nonanol (63.1 min). Decanol: 80 °C (120 min), 40 °C min−1 to 180 °C (2 min), (R)-2-decanol (122.4 min), (S)-2-decanol (122.5 min).
2.9 Modelling
Parameter estimation for the initial rate experiments was performed with Origin 8G, the modelling of continuously operated enzyme-membrane reactor-experiments using a set of ordinary differential equations was done with Berkeley Madonna.3 Results and discussion
The enantioselective reduction of aliphatic ketones in biphasic systems showed good results for substrates with sufficient solubility in aqueous solutions. However, with increasing chain length and decreasing solubility or increasing partitioning, respectively, the conversion and the space–time–yield (STY) dropped dramatically.20 A monophasic solubiliser-aided approach seemed to be more suitable for the conversion of substrates with very low aqueous solubility.13 The aim of our study was to assess continuous process conditions for the enantioselective reduction of hardly water-soluble ketones with integrated product separation and the reuse of the substrate solution after product-removal by SPE. For the ketone reduction, the (R)-selective alcohol dehydrogenase from Lactobacillus brevis (LbADH) was used.11 This enzyme needs NADPH as a reduction equivalent (Fig. 1). For cofactor-regeneration, several approaches are available, in connection with the LbADH especially the substrate-coupled approach with 2-propanol is often preferred.11 We decided to use an enzyme-coupled approach with the glucose dehydrogenase from Bacillus sp. (GDH) and glucose because of the lower price of one redox equivalent of glucose compared to one redox equivalent of 2-propanol.21 Another motivation is the unfavorable equilibrium of the system. A high excess of 2-propanol is normally necessary when using a substrate-coupled approach.20 The excess R0 = c0,2-propanol/c0,2-ketone which is necessary to reach a conversion of 95% was calculated.22–24 At a substrate-concentration (2-ketone) of 60 mmol L−1, a 50-fold excess would be necessary, meaning that in order to reach a conversion of 95% 3 mol L−1 2-propanol are minimally required. As the calculated conversion is an equilibrium conversion, within reasonable reaction times only lower conversion would be accessible. Therefore, with increased solubility, substrate coupled cofactor regeneration became less attractive.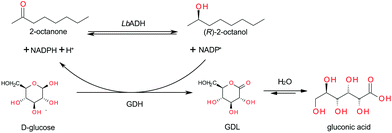 | ||
| Fig. 1 Reaction system for the enantioselective reduction of aliphatic ketones. | ||
The intended process is a complex system with various parameters. A fully informed decision on reaction conditions (concentrations, pH, flow rate, temperature) is desirable, but not always accessible in view of time and labour. To reduce the complexity of the system, technical and economic constraints should be considered from the beginning. Preliminary investigations concerning activity/initial rate experiments and stability were carried out to find adequate reaction conditions for the synthesis in an enzyme-membrane-reactor (EMR). Down-stream-processing (DSP) using solid phase extraction (or adsorption SPE) has also been investigated as well as the possibility of reusing the aqueous buffer solution for ecologic and economic reasons.
3.1 Enzyme characterisation
Stability of the catalyst under process conditions is a key requirement for use in continuous synthesis. It has been shown previously that both catalysts, LbADH and GDH, are stable in potassium phosphate buffer (KPi-buffer).13 KPi buffer was chosen as the starting point for further investigations. Storage stability was determined for KPi-buffer, TEGO IL K5, MgCl2, and pH. High buffer-concentrations (above 500 mmol L−1) are beneficial for the stability of GDH, but decrease the stability of LbADH (see ESI†). High concentrations of TEGO IL K5 increase the half life of LbADH and GDH whereas low concentrations (≤200 g L−1) decrease the half life of GDH (see ESI†). The half life of both enzymes was determined at different pH values between 5.5 and 8.5 in KPi-buffer (see ESI†). For both enzymes, the half life decreases sharply at pH ≥ 7.5. The best stability was found for both enzymes between pH 6.5 and 7.0.Both LbADH as well as GDH-stability benefit from high MgCl2-concentrations (see ESI†). However, high MgCl2-concentration in combination with KPi-buffer will lead to oversaturation. Working with oversaturated solutions in batch is possible but not advisable. In continuous application, precipitations and blocking of the capillaries as well as the micropumps especially at pH ≥ 7.0 may occur. Thus, a non-phosphate based buffer had to be found. Different buffers were chosen according to their pKa![[thin space (1/6-em)]](https://www.rsc.org/images/entities/char_2009.gif) 25 and the enzyme's half life was determined in a solution of 100 mmol L−1 in the respective buffer with 2.5 mmol L−1 of MgCl2 (Fig. 2). The buffers tested were ACES, ADA, BES, HEPES, PIPES. GDH was most stable in ACES-, ADA-, and PIPES-buffers, the half life of LbADH was ≥1000 h in HEPES-buffer, and sufficiently high in ADA-buffer. ADA-buffer was chosen for all further experiments due to its compatibility with both enzymes and reasonable price. Furthermore, a switch to ADA-buffer imposed no issues regarding down-stream-processing.
25 and the enzyme's half life was determined in a solution of 100 mmol L−1 in the respective buffer with 2.5 mmol L−1 of MgCl2 (Fig. 2). The buffers tested were ACES, ADA, BES, HEPES, PIPES. GDH was most stable in ACES-, ADA-, and PIPES-buffers, the half life of LbADH was ≥1000 h in HEPES-buffer, and sufficiently high in ADA-buffer. ADA-buffer was chosen for all further experiments due to its compatibility with both enzymes and reasonable price. Furthermore, a switch to ADA-buffer imposed no issues regarding down-stream-processing.
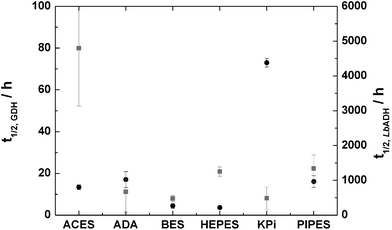 | ||
| Fig. 2 Half-life of LbADH and GDH in the presence of different buffer salts, black: GDH; grey: LbADH; pH = 7.0; T = 25 °C; 300 rpm; cbuffer = 100 mmol L−1; cMgCl2 = 2.5 mmol L−1. | ||
From the stability tests, standard reaction conditions were set for all kinetic experiments: cADA-buffer = 100 mmol L−1; cMgCl2 = 10 mmol L−1; pH = 7.0. The substrate-, product- and cofactor-concentrations were chosen according to the conditions intended for the continuous experiments. The main reaction (M) of LbADH, its back reaction (B) and the cofactor-regeneration reaction with GDH (R) were investigated independently for all substrates at IL-concentrations of 0, 100, and 200 g L−1 (Fig. 3). The respective interaction matrix is given in Table 1.26 It turned out that inhibition of the LbADH-catalysed reaction by glucose or GDL was relevant. Uncompetitive inhibition was identified (data not shown) and was assumed to be applicable for all LbADH catalysed experiments. The parameters of a modified Michaelis–Menten model
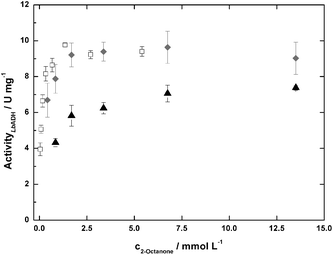 | ||
| Fig. 3 LbADH-activities for the 2-octanone-reduction at 0 (open squares), 100 (grey diamonds), and 200 (black triangles) g L−1 TEGO IL K5; cADA-buffer = 100 mmol−1; cMgCl2 = 10 mmol L−1; pH = 7.0; T = 25 °C. | ||
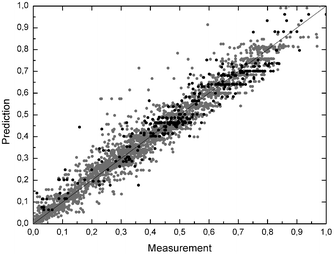 | ||
| Fig. 4 Normalised residual plot of all kinetic measurements, scaling with the maximum measured activity for LbADH and GDH separately; LbADH: grey dots (2626 data points); GDH: black dots (319 data points); black line: prediction = measurement. | ||
| Reaction | M | B | R |
|---|---|---|---|
| M = main reaction (reduction of 2-octanone to (R)-2-octanol); B = back reaction (oxidation of (R)-2-octanol to 2-octanone); R = cofactor-regeneration. | |||
| Enzyme | LbADH | LbADH | GDH |
| Ketone | S1 | P1 | — |
| Alcohol | P1 | S1 | — |
| NADPH | S2 | P2 | P2 |
| NADP+ | P2 | S1 | S2 |
| Glucose | I1 | I1 | S1 |
| GDL | I2 | I2 | P1 |
3.2 Down-stream-processing
Among a selection of commercial solid-phase-materials, HR-P from Macherey-Nagel was identified as the best alternative.13 Thus, a packed bed with 4.4 g of HR-P was applied for DSP in the continuous synthesis of (R)-2-octanol. Prior to the use of the column for DSP in the continuous synthesis, its performance was tested using a model solution containing 100 g L−1 IL and 30 mmol L−1 of 2-octanone and 30 mmol L−1 2-octanol. The solution was pumped through the column. Fractions of the solution were collected and analysed via GC (Fig. 5). 155 mL of the model solution could be pumped through the column to give a complete 2-octanone/ol-free solution. At this point, the column was loaded with 0.55 g 2-octanone and 0.60 g 2-octanol (1.15 g in total). 2-Octanol was the first compound to break through the column, followed by 2-octanone. Interestingly, the 2-octanol-concentration in the outlet exceeded the inlet concentration (50 mmol L−1vs. 30 mmol L−1) before 2-octanone broke through. The maximum loading of the column of 1.66 g material (1.12 g 2-octanone + 0.52 g 2-octanol) was reached at a volume of 363 mL. To verify these results and to show the flexibility of the setup, the same experiment was carried out with a model solution containing 2-nonanone and 2-nonanol, each at 30 mmol L−1 (Fig. 5). The results were comparable to those obtained with 2-octanone/2-octanol. Approximately 140 mL of the model solution could be passed through the reactor to get a complete 2-nonanone/2-nonanol-free solution (concentrations – 0.5 mmol L−1). At this point, the loading of the column was 0.65 g of each compound and 1.30 g in total. The first substance to break through was again the alcohol. The total loading at the end of the experiment was 2 g. This slight selectivity for the ketone which was observed when an IL–buffer-mixture was used may be used for separation techniques like simulated-moving-bed (SMB).27 This technology is established and routinely applied in large-scale applications.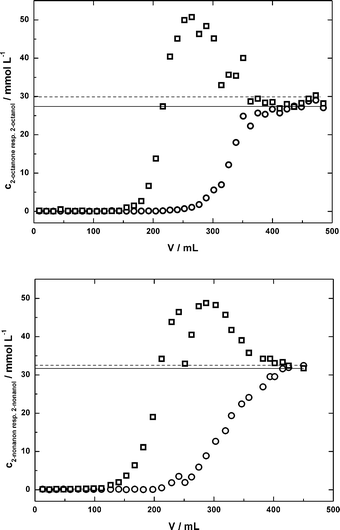 | ||
| Fig. 5 Breakthrough curve for a packed bed with 4.4 g of HR-P material, solutions: cADA-buffer = 100 mmol L−1; cMgCl2 = 10 mmol L−1; pH = 7.0; c2-octanone(2-nonanone) = 30 mmol L−1; c2-octanol(2-nonanol) = 30 mmol L−1; circles = ketones; squares = alcohols, horizontal lines indicate inlet concentrations. | ||
The results from these experiments are important for down-stream-processing of the continuous experiments to prevent accumulation of organic compounds (2-ketones and 2-alcohols). The remaining 2-alcohol in the feed-solution may lead to falsified results when determining the conversion, whereas by feeding too much 2-ketone, the solubility limit might be exceeded. To avoid these problems and to make use of the whole capacity of the column, the product solution was fractionated behind the column. Only fractions with a 2-ketone- and 2-alcohol-concentration ≤0.5 mmol L−1 were used for the feed-stream. By using this technique, more than 80 cycles of loading and regenerating with solutions containing 2-octanone/ol, 2-nonanone/ol, or 2-decanone/ol were possible with an average loading of 0.90 g per cycle and an alcohol-recovery of 63%. Although the loading per cycle fluctuated, an overall decrease in the capacity was not observed and the SPE-material was well suited for this purpose. Future focus should be laid on the recovery of 2-octanol. An option for the recovery of 2-ketone and 2-alcohol is the elution with super-critical carbon dioxide (scCO2).13 This way, the purity of the product may be increased as IL are mostly insoluble in scCO2. However, using scCO2 for product elution is technically more challenging (pressure of ≈80 bar at ≈40 °C28) than using an organic solvent. A final decision has to be taken according to the technical effort and achievable product purities for both cases.
3.3 Continuous Syntheses
For the continuous syntheses of enantiopure alcohols, a cascade of two enzyme-membrane-reactors (EMR) was realised (Fig. 6). The EMR is a long-known, well-established and industrially proven technology.29–33 Hyperbolic kinetics, like in the present case, always conduct the operation window to lower conversions to make use of the higher reaction rate and to get as much information as possible concerning the process-stability. This is also true for the product inhibition which was measured in the initial rate experiments. Thus, a reactor-cascade allows information to be gained and use to be made of the high reaction rate in the first reactor. The reaction is then brought to completion in the second reactor to simplify DSP. A more detailed discussion and evaluation of the advantages of a cascade of two EMR compared to a single EMR and a batch-setup can be found in ref. 34. Down-stream-processing was done via SPE in a stainless steel column as described above. The product and substrate-free solution was then brought to the initial pH. As the EMR can be considered as a continuously stirred tank reactor (CSTR), the reaction conditions in the reactor are uniform on the space- and time-scale (assuming a stable catalyst). Thus, using a pH-stat in the reactor can be avoided as the pH can be adjusted by the initial pH in the substrate-solution. Using a pH-stat in a closed reactor is rather challenging. Good stirring has to be guaranteed together with a relatively low base-concentration to prevent degradation of the biocatalysts. Dilution of the solution in the reactor further complicates the control and regulation of the process. Thus, adjusting the pH after the solution leaves the reactor helps to reduce the complexity of the whole system. A part of the aqueous stream was then replaced by a solution with high glucose- and cofactor-concentration in order to compensate for the reacted glucose and degraded cofactor. Finally, the ketone was added and the solution was then applied again for synthesis. From the breakthrough curves, it was known that ≈160 mL of product solution can be passed through the column resulting in a ketone- and alcohol-free solution (both concentrations ≤0.5 mmol L−1). This solution has to be treated prior to its reuse in the continuous synthesis. In contrast to the LbADH-process presented in ref. 35, the coupled product GDL cannot easily be removed by stripping or other physical methods. Thus, in order to avoid accumulation of GDL and depletion of glucose (which is solid in contrast to 2-propanol, see ref. 35), the solution has to be partly replaced. The replacement ratio depends on the concentration of ketone in the feed. By numerical simulations, taking solubility constraints and practical handling of highly concentrated replacement solutions into account, it turned out that replacing 10% of the product solution with a glucose concentration of cglucose = 750 mmol L−1, a stable concentration of 600 mmol L−1 GDL in the product-solution and a concentration of cglucose = 210 mmol L−1 in the feed solution are obtained assuming quantitative conversion (Fig. 7). Using lower ketone concentrations of 30 mmol L−1 (for 2-decanone) allows for a higher recycling rate of 95% with a glucose concentration of cglucose = 180 mmol L−1 in the substrate solution (data not shown).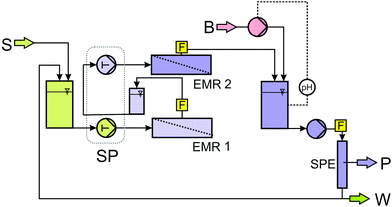 | ||
| Fig. 6 Flow scheme of the cascade of two EMR with integrated down-stream-processing (S: substrate solution; B: base; P: product by reextraction; W: 10% waste; EMR: enzyme membrane reactor; SP: syringe pump equipped with two pairs of syringes running synchronously; F: flow cells for automated sampling for gas chromatography; SPE: solid phase extraction/adsorption). | ||
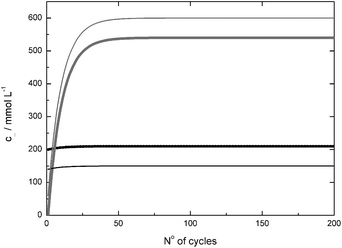 | ||
| Fig. 7 Simulation of concentration of glucose (black) and GDL (grey) in substrate (thick line) and product (thin line) solution when a substrate solution with c0glucose = 200 mmol L−1 and c0ketone = 60 mmol L−1 is used when 90% of the solution is recycled and the replacing solution has a concentration of cglucose = 750 mmol L−1 (assuming quantitative conversion). | ||
The amount of GDL, and thus gluconic acid, is directly coupled to the amount of 2-ketone which is converted (see Fig. 1). Previous experiments showed that both enzymes are unstable at pH ≥ 7.0. As the EMR is a CSTR, the conditions in the reactor are equal to those at the outlet. When the substrate solution is at pH = 7.5, the effective pH in the reactor is between 6.7 and 7.0 (for conversion ≥50%). Applying this method unfortunately also implicates a self-accelerating enzyme deactivation, as higher pH at lower conversion/activity results in faster deactivation.
The continuous synthesis with 2-octanone was first carried out in one EMR. After 24 h of synthesis, a conversion of 76% was achieved. After 140 h of stable operation with a slight decrease of 0.8 × 10⁻³ h−1 conversion, a second reactor was added to give a cascade of two EMR, leading to nearly full conversion in the outlet of the second reactor (Fig. 8). In order to compensate for the degraded enzyme, 1 mg GDH (0.14 mg protein) was dosed into the first reactor after 643 and 1083 h runtime and 0.5 mg LbADH were added (0.22 mg protein) at a runtime of 1174 h. Both times, dosing GDH led to a slight increase in conversion. However, the highest improvement was achieved dosing supplemental LbADH into the reactor. A continuous dosage of the enzyme was not used as the overall stability of the reaction system was of interest. In total, a stable operation for 1250 h was possible. Until the dosage of LbADH at 1174 h a turnover number TONLbADH of 45.6 of 45.6 × 10⁶ and TONGDH of 7.7 × 10⁶ were reached for the first reactor (Table 2). The data of the kinetic experiments were then used to predict the conversion in this setup, assuming a half life of 1000 h for both enzymes. The results are shown in Fig. 8. The overall trend is well represented as well as the enzyme dosage steps.
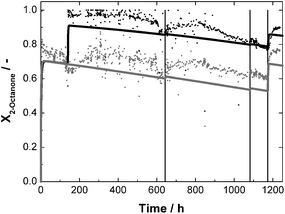 | ||
| Fig. 8 Conversion X as a function of time for continuous synthesis of (R)-2-octanol with standard reaction conditions and a 2-octanone-concentration of 60 mmol L−1; c0,LbADH = 67 mg L−1 each reactor; c0,GDH = 280 mg L−1 each reactor; t = 643, 1083 h 1 mg GDH in reactor 1; t = 1174 h 0.5 mg LbADH in reactor 1; dots: measured data; solid lines = prediction; grey = reactor 1; black = reactor 2. | ||
| Substrate | t/h | Reactor |
X
2-ketone![[thin space (1/6-em)]](https://www.rsc.org/images/entities/char_2009.gif) a a |
TONLbADH![[thin space (1/6-em)]](https://www.rsc.org/images/entities/char_2009.gif) b/106 b/106 |
TONGDH![[thin space (1/6-em)]](https://www.rsc.org/images/entities/char_2009.gif) b/106 b/106 |
TONNADP+![[thin space (1/6-em)]](https://www.rsc.org/images/entities/char_2009.gif) c c |
STYa/mmol L−1 d−1 (/g L−1 d−1) | ee | E-factora w/o recycling (with recycling) |
|---|---|---|---|---|---|---|---|---|---|
| a After 24 h runtime. b At the end of reaction. c Per pass. | |||||||||
| 2-Octanone | 1174 | 1 | 75.8 | 45.6 | 7.7 | 411 | 291 (37.9) | ||
| 2 | 96.9 | 12.8 | 2.9 | 539 | 124 (16.1) | ≥99.9 | 132 (13.2) | ||
| 2-Nonanone | 90 | 1 | 81.7 | 4.3 | 0.34 | 459 | 313 (45.1) | ||
| 2 | 98.9 | 1.0 | 0.19 | 553 | 65 (9.4) | ≥99.9 | 116 (11.7) | ||
| 2-Decanone | 300 | 1 | 97.3 | 8.0 | 1.8 | 275 | 187 (29.6) | ||
| 2 | 99.7 | 0.4 | 0.08 | 289 | 4.4 (0.7) | ≥99.9 | 214 (10.7) | ||
In order to show the potential and to reveal possible limitations of the approach, 2-nonanone and 2-decanone were also tested as substrates. The solubility of 2-nonanone is similar to that of 2-octanone, so that a substrate solution with a ketone-concentration of 60 mmol L−1 was used with analogous reaction conditions, only with slightly decreased GDH-concentration, of 213 mg L−1 instead of 280 mg L−1. The solubility of 2-decanone is much lower, a substrate solution with a ketone-concentration of 30 mmol L−1 was used, taking the same GDH-concentration as for the experiment with 2-octanone. In this case, a recycling rate of 95% of the aqueous solution could be realised (see above). The results of all continuous experiments are summarised in Table 2. Due to the much shorter total runtime for the 2-nonanone and 2-decanone experiments, the TON for both enzymes are reduced compared to the 2-octanone experiment. Other key figures are comparable, at least for 2-octanone and 2-nonanone. The STY, as an indicator for the reaction rate, is comparable with 291 mmol L−1 d−1 for 2-octanone and 313 mmol L−1 d−1 for 2-nonanone. This also holds for the corresponding conversion-levels with respectively 75.8 and 81.7% after 24 h runtime. The STY for the experiment with 2-decanone is lower with 187 mmol L−1 d−1. This is due to the lower concentrated substrate solution. For the experiments with 2-nonanone and 2-decanone, predictions, based on the respective kinetic measurements, are also available and are shown in Fig. 9 and 10 together with the experimental data. A deviation between measured and predicted conversion is again obvious, especially for the experiment with 2-nonanone, but the general trend is well represented.
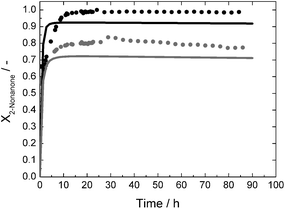 | ||
| Fig. 9 Conversion X as a function of time for continuous synthesis of (R)-2-nonanol with standard reaction conditions and a 2-nonanone-concentration of 60 mmol L−1; c0,LbADH = 67 mg L−1 each reactor; c0,GDH = 213 mg L−1 each reactor; dots: measured data; solid lines = prediction; grey = reactor 1; black = reactor 2. | ||
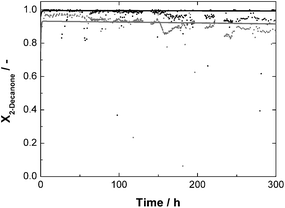 | ||
| Fig. 10 Conversion X as a function of time for continuous synthesis of (R)-2-decanol with standard reaction conditions and a 2-decanone-concentration of 30 mmol L−1; c0,LbADH = 67 mg L−1 each reactor; c0,GDH = 280 mg L−1 each reactor; dots: measured data; solid lines = prediction; grey = reactor 1; black = reactor 2. | ||
The conversions for all substrates are similar in contrast to Leuchs et al.,20 where a decrease in conversion was observed when 2-heptanone (X = 49%), 2-octanone (X = 31%), or 2-nonanone (X = 24%) were used as substrates.
The comparison of experimental data with predictions based on initial rate experiments (Fig. 8–10) shows the potential of this approach. Cost and labour intensive experiments can be reduced by a significant amount if modeling and practical work complement each other. As a first example, a comparison of the predicted STY and the conversion after 48 h runtime for all substrates at a ketone-concentration of 30 mmol L−1 based on the preliminary experiments is shown in Fig. 11. For all substrates, near quantitative conversion is reached after the second reactor. After the first reactor, the conversion increases from 3-octanone to 2-decanone. The same trend was observed for the STY in the first reactor. Apparently, the opposite is true for the STY in the second reactor. As the conversion in the first reactor increases with increasing chain-length of the substrate, the achievable conversion in the second reactor decreases (Fig. 11). Thus, the faster the reaction, the lower the STY in the second reactor. As NADP+ is not retained in the reactor therefore the maximum TONNADP+ is given by the ratio of initial substrate and cofactor concentration and conversion. When using the same cofactor-concentration with different substrates, the conversion and STY is only marginally affected and so is the TONNADP+.
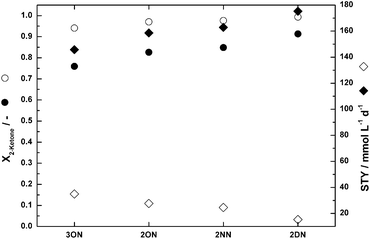 | ||
| Fig. 11 Simulation results based on initial rate experiments in cADA = 100 mmol L−1; cMgCl2 = 10 mmol L−1; pH(inlet) = 7.5; filled symbols: reactor 1; open symbols: reactor 2; conversion X2-ketone: circles; STY: diamonds. | ||
In view of STY and catalyst productivity, especially the synthesis of (R)-2-octanol is clearly in the range of a fine chemical. The range of required productivity in the fine chemical field for an isolated enzyme is indicated with 670–1700 kgproduct/kgenzyme.36 In the experiment with 2-octanone, we reach ≈55 × 103 kgproduct/kgenzyme, which is within the range typically obtained for a bulk chemical. In view of STY, a minimum value of 0.1 g L−1 h −1 (2.4 g L−1 d−1) is given for a competitive synthesis.14 In the 2-octanone experiment, we reach a value of 38 g L−1 d−1. Even though the process has not been optimized yet, it is already competitive for the production of a fine chemical in view of enzyme productivity. An industrial process with LbADH, the production of (R)-ethyl-3-hydroxybutyrate, is conducted at a STY of 92 g L−1 d−1.35 This value is probably achievable with our setup with the aid of further process optimisation, in particular higher enzyme concentrations in combination with a higher volumetric flow rate should lead to an improved STY.
Furthermore, by using the recycling concept for the aqueous-solution, it was possible to reduce the E-factor (kgwaste/kgproduct)37 by a considerable amount. A typical value for a fine chemical is 5–50. Taking the case of the (R)-2-octanol synthesis without recycling, the E-factor is 132, including water. With recycling the E-factor can be reduced by a factor of 10 to 13.2. For the 2-decanone experiment even an improvement by a factor of 20 was reached due to the higher recycling rate. This is clearly in the range suggested for sustainable production.37 Generally, water is regarded as a green solvent, but care has to be taken in detailed analysis.14,38 The environmental impact of pure water is nil (as long as it is not too hot), problems occur when polluted water, e.g. high salt content, has to be treated prior to its release in the environment. The general statement that IL are green solvents has also been disproved.39,40 The toxicity of IL with a high structure similarity to TEGO IL K5 on zebrafish has been found to be high with LD50 in the range of a few mg L−1.39 Also, TEGO IL K5 is considered as a water pollutant that is potentially harmful to the environment. Here, the recycling of the aqueous buffer with IL is mandatory for low environmental impact.
4 Conclusion
The process presented here is well suited for the continuous synthesis of enantiopure aliphatic alcohols. We proved that substrates with low solubility in water can be converted with high reaction rates using an ionic liquid as the solubiliser. Especially for LbADH, the turnover numbers are extremely high with more than 40 × 106. Using a cascade of two EMR allows for a fast reaction, and thus a high STY in the first reactor, and completion of the reaction in the second reactor to reduce complexity and cost of the separation step. The SPE-recycling-concept we used is well suited for this type of reaction and allows for an overall reduced environmental impact of the process.Acknowledgements
The authors thank Prof. Marcel Liauw (RWTH Aachen University) for discussion and support. We thank Kerstin Hell and Dr Peter Schwab (both Evonik Goldschmidt, Essen, Germany) for the kind provision of TEGO IL K5. Partial funding by Deutsche Forschungsgemeinschaft (DFG) (GR2282) and Federal Ministry of Economics and Technology (BMWi) through the AiF (ZIM KF2609402) is gratefully acknowledged. We are also grateful to the Max-Buchner-Forschungsstiftung for a research scholarship.References
- M. Hall and A. S. Bommarius, Chem. Rev., 2011, 111, 4088–4110 CrossRef CAS.
- R. Noyori and T. Ohkuma, Angew. Chem., Int. Ed., 2001, 40, 40–73 CrossRef CAS.
- R. Noyori, Angew. Chem., Int. Ed., 2002, 41, 2008–2022 CrossRef CAS.
- T. Ohkuma, M. Koizumi, H. Doucet, T. Pham, M. Kozawa, K. Murata, E. Katayama, T. Yokozawa, T. Ikariya and R. Noyori, J. Am. Chem. Soc., 1998, 120, 13529–13530 CrossRef CAS.
- E. J. Corey, R. K. Bakshi and S. Shibata, J. Am. Chem. Soc., 1987, 109, 5551–5553 CrossRef CAS.
- E. J. Corey and C. J. Helal, Angew. Chem., Int. Ed., 1998, 37, 1986–2012 CrossRef CAS.
- P. V. Ramachandran, Z.-H. Lu and H. C. Brown, Tetrahedron Lett., 1997, 38, 761–764 CrossRef CAS.
- J. Kim and B. Singaram, Tetrahedron Lett., 2006, 47, 3901–3903 CrossRef CAS.
- Y. Kawanami, Y. Mikami, K. Hoshino, M. Suzue and I. Kajihara, Chem. Lett., 2009, 38, 722–723 CrossRef CAS.
- U. T. Bornscheuer, G. W. Huisman, R. J. Kazlauskas, S. Lutz, J. C. Moore and K. Robins, Nature, 2012, 485, 185–194 CrossRef CAS.
- S. Leuchs and L. Greiner, Chem. Biochem. Eng. Q., 2011, 25, 267–281 CAS.
- C. Kohlmann, N. Robertz, S. Leuchs, Z. Dogan, S. Lütz, S. Na'amnieh and L. Greiner, J. Mol. Catal. B: Enzym., 2011, 68, 147–153 CrossRef CAS.
- C. Kohlmann, S. Leuchs, L. Greiner and W. Leitner, Green Chem., 2011, 13, 1430–1436 RSC.
- S. Wenda, S. Illner, A. Mell and U. Kragl, Green Chem., 2011, 13, 3007–3047 RSC.
- E. Thurman and M. Mills, Solid-Phase Extraction – Principles and Practice, John Wiley, 1998 Search PubMed.
- M.-C. Hennion, J. Chromatogr., A, 1999, 3–54 CrossRef CAS.
- L. Gardossi, P. B. Poulsen, A. Ballesteros, K. Hult, V. K. Švedas, D. Vasíc-Rački, G. Carrea, A. Magnusson, A. Schmid, R. Wohlgemuth and P. J. Halling, Trends Biotechnol., 2010, 28, 171–180 CrossRef CAS.
- M. M. Bradford, Anal. Biochem., 1976, 72, 248–257 CrossRef CAS.
- J. P. Henley and A. Sadana, Biotechnol. Bioeng., 1986, 28, 1277–1285 CrossRef CAS.
- S. Leuchs, T. Nonnen, D. Dechambre, S. Na'amnieh and L. Greiner, J. Mol. Catal. B: Enzym., 2012 DOI:10.1016/j.molcatb.2012.09.017.
- C. Wandrey, Chem. Rec., 2004, 4, 254–265 CrossRef CAS.
- L. Greiner, S. Laue, A. Liese and C. Wandrey, Chem.–Eur. J., 2006, 12, 1818–1823 CrossRef CAS.
- M. F. Eckstein, J. Lembrecht, J. Schumacher, W. Eberhard, A. C. Spiess, M. Peters, C. Roosen, L. Greiner, W. Leitner and U. Kragl, Adv. Synth. Catal., 2006, 348, 1597–1604 CrossRef CAS.
- M. F. Eckstein, M. Peters, J. Lembrecht, A. C. Spiess and L. Greiner, Adv. Synth. Catal., 2006, 348, 1591–1596 CrossRef CAS.
- R. Beynon and J. Easterby, Buffer Solutions, IRL Press, 1996 Search PubMed.
- P. A. Santacoloma, G. Sin, K. V. Gernaey and J. M. Woodley, Org. Process Res. Dev., 2011, 15, 203–212 CrossRef CAS.
- A. Seidel-Morgenstern, L. C. Keßler and M. Kaspereit, Chem. Eng. Technol., 2008, 31, 826–837 CrossRef CAS.
- P. G. Jessop and W. Leitner, Chemical Synthesis using Supercritical Fluids, Wiley-VCH, Weinheim, 1999 Search PubMed.
- R. Wichmann and C. Wandrey, Biotechnol. Bioeng., 1981, 2789–2802 CrossRef CAS.
- J. Wöltinger, A. Karau, W. Leuchtenberger and K. Drauz, Adv. Biochem. Eng./Biotechnol., 2005, 92, 289–316 Search PubMed.
- U. Kragl, W. Kruse, W. Hummel and C. Wandrey, Biotechnol. Bioeng., 1996, 52, 309–319 CrossRef CAS.
- W. Kruse, W. Hummel and U. Kragl, Recl. Trav. Chim. Pays-Bas, 1996, 115, 239–243 CrossRef CAS.
- U. Kragl, D. Vasíc-Rački and C. Wandrey, Chem. Ing. Tech., 1992, 64, 499–509 CrossRef CAS.
- U. Kragl, D. Vasíc-Rački and C. Wandrey, Bioprocess Eng., 1996, 14, 291–297 CAS.
- A. Liese, K. Seelbach and C. Wandrey, Industrial Biotransformations, Wiley-VCH, 2006 Search PubMed.
- P. Tufvesson, J. Lima-Ramos, M. Nordblad and J. M. Woodley, Org. Process Res. Dev., 2011, 15, 266–274 CrossRef CAS.
- R. A. Sheldon, Chem. Commun., 2008, 3352–3365 RSC.
- M. J. Hernáiz, A. R. Alcántara, J. I. García and J. V. Sinisterra, Chem.–Eur. J., 2010, 16, 9422–9437 CrossRef.
- C. Pretti, C. Chiappe, D. Pieraccini, M. Gregori, F. Abram, G. Monnia and L. Intorre, Green Chem., 2006, 8, 238–240 RSC.
- D. Zhao, Y. Liao and Z. Zhang, Clean, 2007, 35, 42–48 CAS.
Footnote |
| † Electronic supplementary information (ESI) available: Kinetic constants used in the model and figures illustrating activity and stability. See DOI: 10.1039/c2gc36558h |
| This journal is © The Royal Society of Chemistry 2013 |

