Physicochemical and toxicological characteristics of welding fume derived particles generated from real time welding processes†
Cali
Chang
*a,
Philip
Demokritou
*b,
Martin
Shafer
c and
David
Christiani
b
aHarvard School of Public Health-Environmental and Occupational Medicine Epidemiology, 665 Huntington Ave., Boston, Massachusetts 02115, USA
bHarvard School of Public Health-Environmental Health, Boston, Massachusetts, USA. E-mail: pdemokri@hsph.harvard.edu
cWisconsin State of Hygiene Laboratory, Madison, Wisconsin, USA
First published on 23rd November 2012
Abstract
Welding fume particles have been well studied in the past; however, most studies have examined welding fumes generated from machine models rather than actual exposures. Furthermore, the link between physicochemical and toxicological properties of welding fume particles has not been well understood. This study aims to investigate the physicochemical properties of particles derived during real time welding processes generated during actual welding processes and to assess the particle size specific toxicological properties. A compact cascade impactor (Harvard CCI) was stationed within the welding booth to sample particles by size. Size fractionated particles were extracted and used for both off-line physicochemical analysis and in vitro cellular toxicological characterization. Each size fraction was analyzed for ions, elemental compositions, and mass concentration. Furthermore, real time optical particle monitors (DustTrak™, TSI Inc., Shoreview, Minn.) were used in the same welding booth to collect real time PM2.5 particle number concentration data. The sampled particles were extracted from the polyurethane foam (PUF) impaction substrates using a previously developed and validated protocol, and used in a cellular assay to assess oxidative stress. By mass, welding aerosols were found to be in coarse (PM2.5–10), and fine (PM0.1–2.5) size ranges. Most of the water soluble (WS) metals presented higher concentrations in the coarse size range with some exceptions such as sodium, which presented elevated concentration in the PM0.1 size range. In vitro data showed size specific dependency, with the fine and ultrafine size ranges having the highest reactive oxygen species (ROS) activity. Additionally, this study suggests a possible correlation between welders' experience, the welding procedure and equipment used and particles generated from welding fumes. Mass concentrations and total metal and water soluble metal concentrations of welding fume particles may be greatly influenced by these factors. Furthermore, the results also confirmed the hypothesis that smaller particles generate more ROS activity and should be evaluated carefully for risk assessment.
Environmental impactMost welding fume exposure studies focus on particles emitted in a controlled environment with machine generated systems. Therefore, there is a need to assess the physico-chemical and toxicological properties of particles during actual welding fume exposures. This study is one of the first descriptive studies to our knowledge that performed a complete characterization of the welding fume exposure generated during real-time welding activity. In addition, welders' characteristics, the welding procedure, and equipment were evaluated and linked to particle properties. Lastly, the physico-chemical properties of the generated particles were linked directly to toxicological outcomes. The results presented in this study can be used as a guideline for future exposure and risk assessment studies. |
Introduction
Epidemiological studies have identified combustion-derived particles such as diesel particulates, welding fumes and coal fly ash as the driving force of particulate matter (PM) induced cardiovascular effects;1–3 additionally, these conclusions were drawn mainly based on measurements of size specific PM mass concentrations, namely for particles with aerodynamic diameters (AD) of less than 10 μm (PM10) and 2.5 μm (PM2.5).4,5While most of the combustion derived particle mass is found in the PM2.5 size range, the largest PM number counts are those in the nano-sized particle range (AD < 100 nm).6 Recently, emphasis has been shifted from coarse and fine PM (PM10 and PM2.5, respectively) to nano-scaled particles or nanoparticles (PM0.1). Epidemiological7 and toxicological8,9 studies have identified the unique properties of nanoparticles compared to larger size fractions, including high lung deposition, higher particle number concentration, and much higher surface area per mass.10 Furthermore, recent toxicological studies have implicated atmospheric nanoparticles in increased toxicity.11,12
Nanoparticles are abundant in both environmental and occupational settings; yet the level of occupational nanoparticle exposure is often much higher than in general ambient environment. In occupational settings, boilermaker construction workers are especially at high risk of having adverse cardiovascular outcomes when exposed to high levels of fine and nanoparticles during their usual welding procedures.13 Furthermore, the type of electrodes and rods used during welding, and the various activities performed during a welding session (e.g. grinding vs. welding) determine the chemical and physical characteristics of the emitted particles. It was shown that grinding dust has a different chemical composition from welding fumes.14
One of the biological mechanisms responsible for the cardiopulmonary effects of combustion derived particulate exposure is the pro-inflammatory response driven by oxidative stress.11,15,16 The inhaled particles increase the production of reactive oxygen species (ROS) in the alveoli and airways and induce inflammatory reaction.17 It is worth pointing out that many in vivo and in vitro studies have shown that ambient nanoparticles, even at low mass doses, have the ability for generating ROS and oxidative stress due to their high number and surface to mass ratio.18–22
ROS generation and the pro-inflammatory reactions have also been reported among welders who are exposed to high levels of PM in welding fumes.23,24 Because combustion-derived welding fume particles are comprised of a greater proportion by number of nanoparticles than fine particulates in mass,25 it is reasonable to hypothesize that nano-sized particles generated from welding fumes drive the toxicological outcome for this type of occupational exposure.
This study aimed to characterize the physicochemical and toxicological properties of particles derived during real time welding processes performed by welders in the field. PM exposures were characterized using both real-time instruments as well as time integrated PM samplers. Collected size fractionated PM samples were analyzed for mass and elemental composition including total and water soluble metals, as well as inorganic ions. Furthermore, the cellular toxicity of welding fume particles was assessed by measuring the ROS generation induced by each PM size fraction, which is an indicator of cellular oxidative stress.
Method
Study population
This investigation was part of a larger on-going study examining the association between particulate matter exposure from welding operations and adverse cardiovascular health outcomes. The study participants were male boilermakers recruited from the Local 29 International Brotherhood of Boilermakers, Blacksmiths, Forgers and Helpers located in Quincy, Massachusetts. This is an active union with approximately 400 active and retired members. Members of this union include younger apprentices and older boilermakers with experience. Both apprentices and boilermakers were monitored for this ongoing study, thus providing a structure to explore the physiological responses of a more age diverse cohort and also to examine the influence of welding technique. Sample monitoring was performed on weekends during a regular welding training session, which was scheduled in advance. Four randomly selected participants were asked to conduct regular welding classes for this study.Particulate matter (PM) study design
Aerosol PM samples and exposure information were collected in a number of sampling campaigns where participants perform and complete their welding training sessions. A weekday welding session usually starts at 3 pm and ends around 7 pm; weekend welding sessions usually start at 10 am and end around 3 pm. The sampling campaign consists of 4 welding days, with an average of 4.5 hours in each monitored day.Site description and welding types
Area air monitoring sessions were conducted at the welding school which consists of ten primary workstations in one large room. Each workstation is equipped with local exhaust ventilation. Apprentices are taught three different types of welding: (1) manual metal arc welding (MMAW), which was most commonly performed; (2) tungsten inert gas welding (TIG) and (3) metal inert gas welding (MIG). MMAW (is also referred to as stick welding) is performed on mild and stainless steel and is widely applied by welders on work sites. All three types of welding techniques were represented in the sampling performed for this study and Table 1 presents a summary. The monitored welders were asked to keep logs of all activities (welding, smoking, breaks, etc.) every 10 minutes during welding session.| Day 1 | Day 2 | Day 3 | Day 4 | |
|---|---|---|---|---|
| a Percentage of time (minutes) spent on specific activity during the whole monitoring session. b Percentage of time the pump of CCI is running with no welding activity. c Percentage of time the electrodes were applied during time spent on welding activities. d CCI adjusted DustTrak mean averaged over total monitored minutes. e Calculated for each sampling day according to eqn (1). f Background mass concentration based on DustTrak on non-welding days. g 6010 and 7018 are used during MMWA welding; E70S2 are used during TIG welding. | ||||
| Temperature/relative humidity | 80 °F | 76 °F | 79.2 °F | 76.8 °F |
| Relative humidity | 64.4% | 62.1% | 65.2% | 63.3% |
| Welder's age | 28 | 49 | 33 | 23 |
| Smokers | No | No | No | Yes |
| Years of experience | 3 | 3.5 | 9 | 3 |
| Day of the week | Fri | Tues | Fri | Tues |
| Exposure duration (minutes) | 320 | 270 | 400 | 270 |
| Activities monitored | ||||
| Lunch break | 7.8% | 5.6% | 18.8% | 0.0% |
| Smoking break | 0.0% | 0.0% | 0.0% | 3.7% |
| No welding activityb | 17.2% | 33.3% | 13.8% | 27.8% |
| Stick (arc) welding (MMAW) | 65.6% | 27.8% | 0.0% | 5.6% |
| MIG welding | 0.0% | 0.0% | 52.5% | 0.0% |
| TIG welding | 0.0% | 12.2% | 0.0% | 0.0% |
| Grinding/buffing | 4.7% | 12.2% | 5.0% | 55.6% |
| Cutting with torch | 0.0% | 0.0% | 0.0% | 5.6% |
| Prep/break/clean up | 4.7% | 8.9% | 10.0% | 1.9% |
| Base metal | Mild steel | Mild steel | Mild steel | Mild steel |
| Electrodes used during welding | ||||
| 6010g | 35.7% | 0.0% | 0.0% | 0.0% |
| E70S2g | 0.0% | 37.5% | 0.0% | 0.0% |
| 7018g | 64.3% | 62.5% | 100.0% | 100.0% |
| PM2.5 meand (μg m−3) | 800.69 | 387.09 | 1308.56 | 3385.54 |
| Correction Factor (CF)e | 0.68 | 0.33 | 0.09 | 0.21 |
| Background PM2.5 meanf (μg m−3) | 14.91 | 5.09 | 10.73 | 18.14 |
Particulate matter (PM) sampling analysis strategy
Fig. 1 illustrates the overall PM sampling and analysis strategy. A compact cascade impactor (Harvard CCI), previously developed and validated by the investigators,26,27 was stationed within the welding booth to collect the size fractionated PM (Fig. 2a). In this study, the Harvard CCI was operated at 30 L min−1, and only three impaction stages were used corresponding to the PM2.5–10 (coarse PM10), PM0.1–2.5 (fine-accumulation mode), and PM0.1 (ultrafine particles UFP)) size fractions.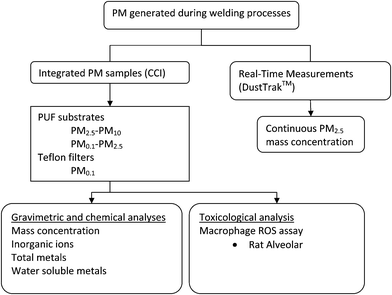 | ||
| Fig. 1 Sampling schematics. | ||
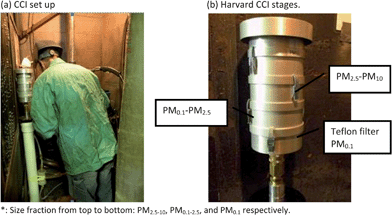 | ||
| Fig. 2 Compact Cascade Impactor (CCI) set up illustration: (a) CCI set up at breathing zone. (b) Harvard CCI Stages*. | ||
The first two size fractions are collected onto polyurethane foam (PUF) substrates. A 47 mm backup Teflon filter is used to collect particles smaller than 0.1 μm (Fig. 2b). The major feature of this novel sampler is its ability to both fractionate by size and collect relatively large amounts of particles (mg quantities) onto inert PUF impaction substrates without the use of any adhesives.27 The air flow rate was checked and reported at the beginning and at the end of the sampling using an analog flow meter with digital display (4100 series; TSI Inc.).
Both PUF substrates and Teflon filters were chemically pre-cleaned prior to use, as per the protocol developed by the investigators:28 Teflon filters with 1.2 M high-purity HCl (individual filters mounted into an all-Teflon vacuum filtration column and 30 mL of the dilute acid processed through filter); the PUF substrates in small batches contained within Teflon beakers, with sequential methanol (repeated twice) and 0.2 M high-purity HCl (repeated twice) soaks (20 minutes each with sonication). All stages of the impactor were cleaned prior to every sample monitoring session, and cleaned filters were replaced in a clean room with minimal metallic particle exposure after the impactor was cleaned. All Harvard CCI components and parts were cleaned with 95% alcohol wipes and swabs, and soaked in 95% ethanol overnight.
To ensure no residual particles, CCI components were sonicated in distilled (DI) water for 60 minutes and left in the hood to air dry. To minimize exposure to non-welding PM, the Harvard CCI was usually stationed and set up just one hour prior to the welding session. For each sampling day, one field blank for both PUF substrate and Teflon filter were collected prior to initiating welding activity. Field observations noting timing of instrument operation, welding activity, air flow and welding room conditions were reported and shown in Table 1.
Real time particulate matter (PM) monitoring
To provide real time exposure information, workers were also fitted with real time aerosol monitors (DustTrak™ from TSI Inc., Shoreview, Minn., USA) to record PM2.5 concentration on a 1 min average basis. Monitors were placed in padded pouches with tubing secured to the participants' shoulders to collect particle exposure information within the breathing zone. DustTrak data were also recorded on non-welding days to provide information on background exposure. DustTrak uses a light scattering technique that continuously measures the number of particles in a given air sample. Therefore, the PM readings measured by DustTrak are only surrogates of the particular mass concentration, given that the density of the particles is unknown. In order to convert the mass concentration real time data collected by DustTrak to corrected mass concentration data adjusting for the particle density, a correction factor (CF) needs to be applied, as described in detail elsewhere.29 The method used in this study to determine the correction factor is described in more detail below (eqn (1)).The integrated Compact Cascade Impactor (CCI) PM2.5 concentration (CCIPM2.5) is determined by the net mass collected on the PM0.1–2.5 PUF substrate and PM0.1 Teflon filter, and divided by the volume of air sampled. The volume of air sampled is calculated based on measured air flow and duration of the sampling.
The correction factor (CF) for each sampling day is calculated using the time averaged PM2.5 mass concentration value measured by the DustTrak divided by mass concentration (CCIPM2.5), as follows.
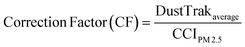 | (1) |
Sample analysis
Gravimetric analysis
The mass of collected PM on the PUF substrates and Teflon filters was determined as mass difference between pre- and post-sampling weights of the substrates following 48 hours of equilibration time in temperature (21 ± 2 °C) and humidity controlled (35 ± 3%) conditions in a dedicated weighing room using a Mettler-Toledo MX5 scale (Mettler-Toledo, Columbus, OH, USA; 1 μg resolution). Substrates were weighed twice, both before and after sampling, and weights logged electronically. Static charges were discharged using a 210Po ionization source. Uncertainties in the measurement of the particle mass on the substrates were determined from the standard deviation of the replicate weighing of the samples and associated blanks. The total uncertainty associated with the PM mass measurement is <5%.Chemical analysis
The PUF substrates and filters were each sectioned using ceramic blades into three equal portions to enable comprehensive elemental and toxicological characterization of the collected PM. One section was extracted in high purity water (15.0 mL in acid-washed polypropylene tubes for 6 hours with continuous shaking in the dark) and the filtered (0.45 μm) extract was analyzed for water soluble elements (49 major and trace elements listed at the end of this section) using magnetic-sector inductively coupled plasma-mass spectrometry (SF-ICP-MS; Thermo-Finnigin Element 2) and for soluble inorganic ions (ammonium, chloride, nitrate, phosphate, sulfate) ion chromatography (IC) was used.30The PM in the second section was digested for total elemental analysis (again by SF-ICPMS).31 Digestions were carried out by an automated microwave-aided mixed acid (1.5 mL 16 M nitric, 0.50 mL 12 M hydrochloric, 0.25 mL 28 M hydrofluoric) protocol which effected a complete solubilization of the PM (and PUF). The PUF digestion protocol was enhanced by the addition of 0.50 mL peroxide. All digestates were diluted to 30.00 mL for SF-ICPMS analysis. Estimates of total uncertainty for each sample/element were derived by propagating the uncertainty (1 standard dev.) components from the ICP-MS analysis (three analytical replicates), blank subtraction (multiple blanks), and the uncertainty in digestion/extraction recovery. The total uncertainty ranged from 5 to 25% (median 9%) across all elements. The third substrate section was extracted in 2.5 mL of high-purity water and the filtered (0.45 μm) extract used in an in vitro cellular bio-assay to determine the reactive oxygen species activity of the particle extracts; the details are discussed below in the ROS macrophage cellular assay section.
A total of 49 metals were analyzed: lithium (Li), boron (B), sodium (Na), magnesium (Mg), aluminum (Al), phosphorus (P), sulfur (S), potassium (K), calcium (Ca), scandium (Sc), titanium (Ti), vanadium (V), chromium (Cr), manganese (Mn), iron (Fe), cobalt (Co), nickel (Ni), copper (Cu), zinc (Zn), arsenic (As), rubidium (Rb), strontium (Sr), yttrium (Y), niobium (Nb), molybdenum (Mo), rhodium (Rh), palladium (Pd), silver (Ag), cadmium (Cd), tin (Sn), antimony (Sb), caesium (Cs), barium (Ba), lanthanum (La), cerium (Ce), praseodymium (Pr), neodymium (Nd), samarium (Sm), europium (Eu), dysprosium (Dy), holmium (Ho), ytterbium (Yb), lutetium (Lu), tungsten (W), platinum (Pt), thallium (Tl), lead (Pb), thorium (Th),and uranium (U).
Reactive oxygen species (ROS) macrophage cellular assay
The ROS activity of the water soluble components of the collected PM was determined by in vitro exposure to rat alveolar macrophage cells (NR8383, ATCC# CRL-2192) using dichlorofluorescein diacetate (DCFH-DA) as the fluorescent probe.32 DCFH-DA is membrane permeable and is de-acetylated by cellular enzymes. ROS species produced within the cell cytoplasm converts DCFH to the fluorescing species DCF.The assay quantifies biologically mediated production of ROS within the macrophage cell in response to cell stimulation from “toxic” species. The sample extracts were prepared for ROS analysis by adding an aliquot of 10× concentrated solution of salts glucose medium (SGM). Cultured non-adherent macrophage cells were harvested and gently concentrated by centrifugation at 750 rpm for 5 minutes, and the culture media removed and replaced with SGM to produce a cell suspension of 1000 cells per μL. Macrophage cells (100 μL = 100![[thin space (1/6-em)]](https://www.rsc.org/images/entities/char_2009.gif) 000 cells) were dispensed into each well of a 96 well plate and incubated for 2 hours in a 37 °C incubator under a 6% CO2 atmosphere.
000 cells) were dispensed into each well of a 96 well plate and incubated for 2 hours in a 37 °C incubator under a 6% CO2 atmosphere.
Approximately 15 minutes before the end of the incubation period, DCFH-DA was added to each prepared sample to achieve a final concentration of 45 μM. After the incubation period, during which time >98% of the cells have settled and adhered to the well bottom, the SGM was pipetted off and immediately replaced with 100 μL of the SGM-buffered sample extract or control sample. The plate was returned to the 37 °C incubator for 2.5 hours after which time the fluorescence intensity of each well was determined at 30 minute intervals at 504 nm excitation and 529 nm emission (515 nm cutoff) using a m5e microplate reader (Molecular Devices). Raw fluorescence data were blank-control corrected and normalized to the Zymosan controls to account for minor variations in method sensitivity and to aid comparisons between studies. Zymosan is a β-glactide and has been used as a positive control because it binds to Toll-like receptor-2 on macrophage cells and then activates a respiratory burst and ROS production. By normalizing all data to the activity of Zymosan, small within run and between run variations in the sensitivity of the assay can be accounted for. This approach has been evaluated and applied by several research groups.32,33
All samples were analyzed in triplicate (3-wells). A minimum of six dilutions (each in triplicate) of every sample extract were run to ensure that a linear dose–response region could be identified. Dose levels were in the range of 20–150 μg mL−1 (200–1500 pg per cell). The overall uncertainty in the ROS method was estimated by propagating the standard deviation of the triplicate ROS measurements with the standard deviation of the applied method blank. Each ROS analysis run incorporated a series of positive controls including a Zymosan suspension, an Urban Dust (NIST 1649) extract, and tert-butyl hydroperoxide (TBH), as well as negative controls (method extraction and media blanks). Method blanks were not significantly different from zero, and positive controls were well within acceptable limits. Additional details of the method can be found in a referenced paper.32 This macrophage ROS assay has been used by the investigators in similar studies that examined ambient combustion derived PM16,28,34 and has been shown to be a robust approach to access the biological oxidative stress potential of the PM.
To further understand how metal components correlate with ROS activity from the cellular assay, a correlation analysis was performed between each of the metal concentrations and ROS activities. Because the concentrations of transitional metals were not normally distributed, they were log transformed to obtain the coefficient of determination (R2) of ROS activities,35 which is the square of the Pearson product–moment correlation coefficient.36
Results and discussion
Adjusted real time DustTrak™ PM mass concentration
Table 1 presents the exposure characteristics of each monitored day. Welders have different activity profiles, and their exposure profiles were also different. The adjusted real time PM mass concentration level as measured by the DustTrak on each sampling day is illustrated in Fig. 3. The mean PM2.5 mass concentration is in line with the results obtained from Harvard CCI, which will be discussed in a later section.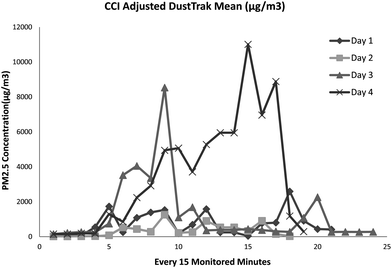 | ||
| Fig. 3 Real time PM2.5 concentration (μg m−3) for each sampling day. | ||
To illustrate how welding activity affects particle size distribution, Fig. 4 presented the real time PM2.5 mass concentration in conjunction with daily activity monitored on days 1 and 2. It is clear that welding and grinding produce higher PM2.5 mass concentration.14 When performing MMAW, the 7018 electrodes seem to generate significantly higher mass concentrations when compared to 6010 electrodes. TIG welding appears to have smaller impact on the mass concentration when compared to MMAW with 7018 electrodes. When compared to MMAW with 6010 electrodes, the effective TIG welding does not differ significantly.
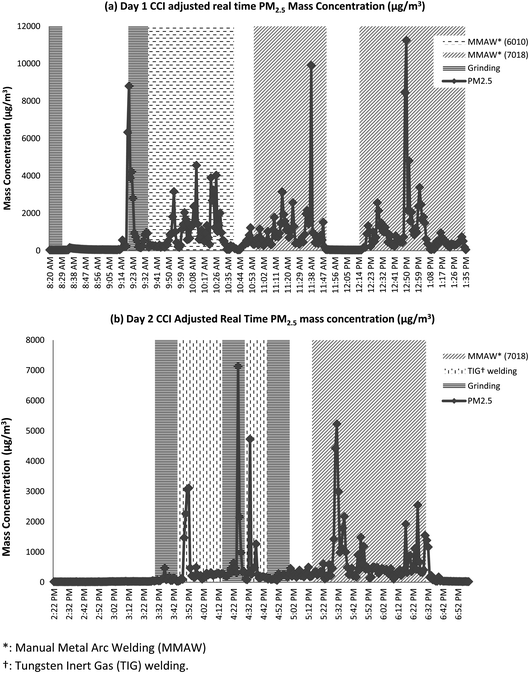 | ||
| Fig. 4 Real time PM2.5 concentration (μg m−3) in conjunction with daily activity, using (a) day 1 and (b) day 2 as examples. | ||
CCI measured PM mass concentration
Fig. 5 shows the mass concentration as a function of size respectively for each monitored day, as measured by the Harvard CCI. Mass concentration profiles showed a similar trend across all four sampling days, with the highest mass concentration levels to be found in the PM2.5–10 and PM0.1–2.5 size ranges. These data are in agreement with a previous study that examined particle size distribution from various types of welding techniques.37 Days 1 and 2 presented the highest concentration levels in the PM2.5–10 particulate size range while the day 3 monitor session had the peak in the PM0.1–2.5 particle size ranges. In addition, day 3 had the highest nano-particulate concentration levels (PM0.1) among the four sampling days. Day 4 also presented a higher concentration in the PM2.5–10 and PM0.1–2.5 particulate size ranges.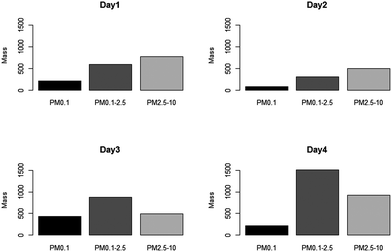 | ||
| Fig. 5 Mass concentration (μg m−3) distribution in different size ranges measured by CCI on different days. | ||
Welders monitored on days 1 and 2 had similar years of experiences; this might explain why the two days presented similar mass concentration profiles from CCI. However, the welder monitored on day 1 spent more than 65% of the monitored time welding while the day 2 welder only spent 40%. The time these welders spent on welding is a plausible explanation as to why day 1 has higher mass concentration levels across all size fractions compared to day 2. It is worth pointing out that the welder monitored on day 2 was the only welder who performed TIG welding.
As discussed earlier, TIG welding appears to generate lower mass concentrations when compared to MMAW using 7018 electrodes. However, TIG welding does not seem to generate different exposure profiles from MMAW with 6010 electrodes. While this particular type of a welding technique does not show significant differences on the size distribution of the particles in this study, other studies have shown that TIG welding generates particles in different size ranges when compared to other types of welding techniques.38 The day 4 welder spent more than 50% of his time grinding and buffing the base metal, which explains the higher concentration in the PM0.1–2.5 and PM2.5–10 size ranges.
As presented in Table 1, the day 4 welder is the only smoker monitored in this study. After a careful review of the activity logs, 75% of the smoking breaks were logged simultaneously as the welding and grinding took place. It is likely that the Harvard CCI collected cigarette smoke particles during his smoking break. After examining real time CCI adjusted DustTrak data, it appears that when there was smoking during welding or grinding, the mass concentration recorded contributed to a higher mass concentration (ESI, Fig. S1†). Other studies that examined tobacco smoke particles found that most particles were in the fine (PM0.1–2.5) particulate size ranges.39,40 This may explain the higher concentration in the PM0.1–2.5 particulate size ranges in our study. Our results suggest that welders' experience, welding activities, and the material used may influence the amount and size of emitted particles. These findings are also consistent with previous studies.6,38,41,42
Total metals
As presented in Table 2(a), most welding related metals were found to be in the PM2.5–10 and PM0.1–2.5 particulate size ranges. Iron (Fe) was found to be relatively higher compared to metals across all size ranges, which was consistent with results from previous studies.43 Transitional metals in different size ranges do not present the same patterns across four sampling days; some metals were found to be higher in the smaller size ranges while the others are more abundant in the PM2.5–10 size ranges. This may be explained by the years of experience and the amount of time that the welders spent on welding.| Day 1 | Day 2 | Day 3 | Day 4 | |||||||||
|---|---|---|---|---|---|---|---|---|---|---|---|---|
| PM2.5–10 | PM0.1–2.5 | PM0.1 | PM2.5–10 | PM0.1–2.5 | PM0.1 | PM2.5–10 | PM0.1–2.5 | PM0.1 | PM2.5–10 | PM0.1–2.5 | PM0.1 | |
| a Found related to welding fume and also known as one of the redox active metals. | ||||||||||||
| (a) Total metals (μg m−3) | ||||||||||||
| Na | 11.89 | 4.50 | 1.04 | 1.64 | 0.62 | 0.06 | 2.13 | 21.31 | 14.04 | 1.29 | 11.91 | 0.34 |
| Mg | 1.06 | 0.14 | 0.05 | 1.96 | 3.77 | 1.48 | 1.96 | 3.77 | 1.48 | 0.29 | 2.05 | 0.05 |
| Al | 9.51 | 1.73 | 0.29 | 2.29 | 0.33 | 0.02 | 1.77 | 0.92 | 0.27 | 5.44 | 47.74 | 0.24 |
| Mn | 4.46 | 2.13 | 0.47 | 0.62 | 0.40 | 0.05 | 5.05 | 39.50 | 14.73 | 1.02 | 8.20 | 0.19 |
| Fe | 203.99 | 33.82 | 7.89 | 23.17 | 3.91 | 0.53 | 37.56 | 102.13 | 38.97 | 100.58 | 620.50 | 7.03 |
| Co | 0.04 | 0.01 | 0.02 | 0.01 | 0.00 | 0.00 | 0.01 | 0.01 | 0.01 | 0.03 | 0.17 | 0.00 |
| Ni | 0.32 | 0.07 | 0.03 | 0.04 | 0.01 | 0.01 | 0.15 | 0.41 | 0.51 | 0.04 | 2.92 | 0.07 |
| Cu | 0.37 | 0.30 | 0.46 | 0.12 | 0.04 | 0.04 | 0.14 | 0.71 | 0.78 | 0.60 | 4.31 | 1.24 |
| Zn | 0.27 | 0.08 | 0.08 | 0.10 | 0.02 | 0.01 | 0.10 | 0.23 | 0.22 | 0.07 | 0.57 | 0.04 |
| As | 0.04 | 0.04 | 0.05 | 0.01 | 0.01 | 0.00 | 0.01 | 0.03 | 0.06 | 0.03 | 0.21 | 0.07 |
| Pb Sum | 0.02 | 0.02 | 0.03 | 0.01 | 0.00 | 0.00 | 0.01 | 0.08 | 0.07 | 0.01 | 0.08 | 0.02 |
| (b) Water soluble metals (μg m−3) | ||||||||||||
| Na | 13.55 | 0.07 | 1.81 | 1.97 | 0.70 | 0.21 | 1.96 | 12.43 | 9.62 | 1.77 | 7.95 | 0.21 |
| Mg | 0.18 | 0.01 | 0.02 | 0.08 | 0.02 | 0.02 | 0.11 | 0.43 | 0.15 | 0.07 | 0.21 | 0.02 |
| Al | 0.87 | 0.01 | 0.18 | 0.74 | 0.06 | 0.01 | 0.33 | 0.15 | 0.04 | 0.45 | 2.03 | 0.01 |
| Mn | 0.67 | 0.01 | 0.10 | 0.04 | 0.06 | 0.01 | 0.10 | 1.48 | 0.61 | 0.05 | 0.03 | 0.00 |
| K | 5.50 | 0.06 | 1.67 | 1.25 | 0.76 | 0.11 | 0.72 | 1.74 | 0.92 | 0.77 | 4.15 | 0.13 |
| Cra | 0.00 | 0.00 | 0.00 | 0.00 | 0.00 | 0.00 | 0.00 | 0.05 | 0.08 | 0.00 | 0.02 | 0.00 |
| Fea | 0.16 | 0.00 | 0.05 | 0.01 | 0.01 | 0.00 | 0.14 | 3.60 | 1.58 | 0.01 | 0.03 | 0.00 |
| Coa | 0.00 | 0.00 | 0.00 | 0.00 | 0.00 | 0.00 | 0.00 | 0.00 | 0.00 | 0.00 | 0.00 | 0.00 |
| Cua | 0.01 | 0.00 | 0.01 | 0.01 | 0.00 | 0.00 | 0.01 | 0.03 | 0.04 | 0.01 | 0.03 | 0.06 |
| Zna | 0.01 | 0.00 | 0.03 | 0.00 | 0.01 | 0.03 | 0.00 | 0.01 | 0.03 | 0.00 | 0.00 | 0.03 |
| Asa | 0.00 | 0.00 | 0.00 | 0.00 | 0.00 | 0.00 | 0.00 | 0.01 | 0.02 | 0.01 | 0.03 | 0.00 |
| Ba | 0.14 | 0.03 | 0.01 | 0.76 | 0.42 | 0.02 | 0.17 | 0.01 | 0.01 | 0.07 | 0.19 | 0.01 |
| Pb Suma | 0.00 | 0.00 | 0.00 | 0.00 | 0.00 | 0.00 | 0.00 | 0.00 | 0.00 | 0.00 | 0.00 | 0.00 |
It is worth mentioning that although PUF substrates and Teflon filters were analyzed for 49 metals, not all metal concentrations were presented in Table 2(a), with only metals with significant levels reported here. Additionally, limit of detection (LOD) values were calculated based on the standard deviations of both field blank and lab blank. LOD levels were calculated as three times the standard deviation from the blank samples. Sample concentrations that are below the limit of detection (LOD) were assigned the value of the LOD. Metal concentrations presented in Table 2 were calculated by dividing the metal mass by the sampled air volume (μg m−3 air).
Interestingly, samples collected on day 3 presented the highest iron (Fe) concentration in the PM0.1 particle size ranges. The day 3 welder spent more than 50% of the total monitored time using electrode 7018 welding on mild steel and only 5% on grinding. Although less abundant, day 3 samples also presented the highest manganese (Mn) levels across all four days. Similarly, most of the metals found in day 3 samples presented higher concentration in the smaller size particle fractions (PM0.1–2.5 and PM0.1).
Water soluble (WS) metals
Table 2(b) also presents water soluble (WS) metal concentrations by different size ranges between different monitored days. Chromium (Cr) particularly presented low levels of concentration; this has been also found in previous studies.44 The concentration level of water soluble chromium (Cr) depends on the type of welding and is particularly higher when performing MMA stainless steel welding due to its high % solubility.45All of the welders monitored used mild steel as the base plate during welding session, therefore low levels of chromium and high levels of iron were expected. While most water soluble metals were found to have higher concentration levels in the PM2.5–10 size fraction, some metals (e.g., Mg, Fe, etc.) presented in Table 2(b) were found to have elevated concentrations in the PM0.1 particle size range.
The chemical species of sodium (Na), magnesium (Mg), aluminum (Al) and potassium (K) are highly soluble compared to the forms of other metals listed in Table 2(b), with an average % solubility of 61.3%, 52% and 53% for PM2.5–10, PM0.1–2.5., and PM0.1 respectively. Interestingly, Mg and Al have higher % water soluble metrics in the PM0.1 size ranges (39% and 31%, respectively) compared to PM0.1–2.5 and PM2.5–10, possibly reflecting a surface area dependence of solubility or less likely a different chemical form/association. Note that for some highly water soluble metals (Na, Mg, and K), the % soluble metrics are higher than 100% in certain size fractions on different days. Given the propagated uncertainties, which can range upward to ±20%, in comparing/subtracting two large numbers from analyses of separate filter sections, these values are generally not significantly different from 100%.
It is worth mentioning that some of the WS metals presented in Table 2(b) are also found to be redox active metals.46–48 The size distributions of these redox active metals are not the same across four monitored days. Days 1 and 2 have higher concentration levels in the PM2.5–10 and PM0.1–2.5 size fractions while days 3 and 4 showed elevated concentrations in the PM0.1 size fraction. The association between reactive oxygen species (ROS) activity and redox active metals will be discussed below in the Macrophage ROS activity section.
Inorganic ions
Table 3 summarizes the results for 7 water soluble inorganic ions: chloride (Cl−), nitrate (NO3−), phosphate (PO4−2), sulfate (SO4−2), sodium (Na+), ammonium (NH4+), and potassium (K+). Our results indicate higher concentrations of SO4−2, Na+ and K+, mostly in the PM0.1–2.5 particle size fractions. SO4−2 has been found to be the secondary aerosol species formed during photo-oxidation, for which it is normal to have a higher concentration in a normal room with exposure to sunlight. K+ was also found to have higher concentration level in the PM0.1–2.5 and PM0.1 size ranges. K+ is one of the major elements generated during combustion processes, which is commonly found in welding fumes.49 One study found a high concentration level of Na+, followed by SO4−2 and K+;50 data from our study were in agreement with their findings.| Cl− | NO3− | PO4−2 | SO4−2 | Na+ | NH4+ | K+ | ||
|---|---|---|---|---|---|---|---|---|
| Day 1 | PM2.5–10 | 1.66 | 0.30 | N/D | 2.52 | 16.24 | 0.01 | 7.14 |
| PM0.1–2.5 | 1.54 | 1.74 | N/D | 6.62 | 23.20 | N/D | 22.10 | |
| PM0.1 | 0.31 | 0.35 | 0.05 | 2.04 | 5.09 | N/D | 4.31 | |
| Day 2 | PM2.5–10 | 5.06 | N/D | 0.25 | 4.52 | 9.62 | 0.02 | 7.02 |
| PM0.1–2.5 | 2.40 | 1.79 | N/D | 6.73 | 10.64 | N/D | 13.45 | |
| PM0.1 | 0.23 | N/D | N/D | 0.78 | 2.88 | N/D | 2.84 | |
| Day 3 | PM2.5–10 | 0.86 | 0.22 | 0.09 | 0.90 | 2.32 | N/D | 0.83 |
| PM0.1–2.5 | 3.58 | 3.29 | 0.72 | 4.85 | 56.35 | N/D | 7.81 | |
| PM0.1 | 1.35 | 2.86 | 1.33 | 3.84 | 95.03 | N/A | 10.18 | |
| Day 4 | PM2.5–10 | 1.02 | N/D | N/D | 3.14 | 7.01 | 0.09 | 3.14 |
| PM0.1–2.5 | 2.73 | 0.91 | 1.00 | 5.28 | 12.39 | N/D | 7.74 | |
| PM0.1 | 0.10 | N/D | N/D | 0.98 | 1.22 | N/D | 1.17 | |
Macrophage ROS activity
Table 4(a) presents the mass normalized ROS activity for each particle size fraction on each sampling day. These data (μg Zymosan unit per mg) were then ratioed with the particulate mass concentration in the air (mg m−3) to help better understand the ROS activity of different size fractions across different sampling days. Day 1 has the highest activity across all PM size fractions among the four monitored days. This may be attributed to the high amount of time this welder spent on welding (60%). The day 1 welder also used a different electrode during the welding session; the type of electrode may also be the cause for the difference in composition.| (b) R2 | |||
|---|---|---|---|
| WS metalsa | PM2.5–10 | PM0.1–2.5 | PM0.1 |
| Cr | 0.07 | 0.92 | 0.23 |
| Fe | 0.05 | 0.68 | 0.07 |
| Zn | 0.23 | 0.10 | 0.06 |
| As | 0.04 | 0.82 | 0.35 |
| Cd | 0.74 | 0.29 | 0.26 |
| Cu | 0.03 | 0.98 | 0.89 |
| Pb sum | 0.00 | 0.16 | 0.34 |
The ROS activity from day 4 showed the highest concentration level in the PM2.5–10 size range but lowest in the PM0.1–2.5 size fraction. Days 2 and 3 presented higher ROS activity in the PM0.1 size range. These results are not in line with the mass concentration levels from gravimetric analysis. Day 4 has the highest mass concentration in the PM0.1–2.5 size range, and yet the lowest ROS activity level; days 2 and 3 have the lowest mass concentration levels in the PM0.1 size fraction but possess a higher ROS activity level. This is a clear indication that a mass dose metric might not be a good metric for toxicity related to welding fumes; however, it is clear that regardless of the mass concentration level, nano-scaled particles will induce more ROS activity.51,52
Table 4(b) presents the coefficient of determination (R2) between the ROS activity and redox active metals. Except for cadmium (Cd) and zinc (Zn), most metals presented higher R2 in the PM0.1–2.5 to PM0.1 size ranges; this trend is consistent with the ROS activity observed. The coefficient of determination analyses further confirms our hypothesis that toxicity increases as the size of particle decreases.
We point out that due to the small sample of data points in this study, results presented in this paper may be underestimated. The effect of nano-particles on ROS activity may be greater than what was presented here. Furthermore, the correlation between size distribution and ROS activity may be greater than results presented by our study.
In conclusion, our results showed that nano-particles may induce more toxic effects at the cellular level when compared to particles that are larger, and is consistent with findings from previous studies.53,54
Conclusion
This study focuses on the physicochemical and toxicological characterization of particles emitted from real world welding activities using state of the art real time instrumentation and analytical methods. The physicochemical and ROS generation profiles across different size fractions and sampling days provided insights in terms of determinants of exposure and toxicity. The results confirmed our hypothesis that smaller particles (PM0.1–2.5 and PM0.1) generate more ROS activity and should be evaluated carefully for risk assessment. The results from this study will be helpful for future exposure and risk assessment studies related to nanoparticles in occupational settings.Acknowledgements
The authors would like to thank the members from the Local 29 International Brotherhood of Boilermakers, Blacksmiths, Forgers and Helpers located in Quincy, Massachusetts for their help and support with air monitoring performed at the union hall. Dr Jennifer Cavallari, Dr Shona Fang, Miss Tianteng Angela Fan, and the Harvard School of Public Health Boilermaker research team under Dr Christiani's supervision have also contributed greatly during the investigation. This study was supported in part by NIOSH training grant no. 1 T42 OH008416 pilot project grant awarded by the Harvard-NIOSH Education and Research Center under grant no. 2 T42 OH008416 and NIH (NIEHS) grant R01 ES009860.References
- R. D. Brook, Cardiovascular effects of air pollution, Clin. Sci., 2008, 115(6), 175–187 CrossRef CAS.
- H. Schulz, et al. Cardiovascular effects of fine and ultrafine particles, J. Aerosol Med., 2005, 18(1), 1–22 CrossRef CAS.
- M. J. Utell, et al. Cardiovascular effects associated with air pollution: potential mechanisms and methods of testing, Inhalation Toxicol., 2002, 14(12), 1231–1247 CrossRef CAS.
- P. E. Schwarze, et al. Particulate matter properties and health effects: consistency of epidemiological and toxicological studies, Hum. Exp. Toxicol., 2006, 25(10), 559–579 CAS.
- B. Brunekreef, et al. Personal, indoor, and outdoor exposures to PM2.5 and its components for groups of cardiovascular patients in Amsterdam and Helsinki, Res. Rep. - Health Eff. Inst., 2005, 127, 1–70 Search PubMed ; discussion 71-9-1-70; discussion 71-9.
- J. M. Antonini, Health effects of welding, Crit. Rev. Toxicol., 2003, 33(1), 61–103 CrossRef CAS.
- Z. Chen, et al. Age-related differences in pulmonary and cardiovascular responses to SiO2 nanoparticle inhalation: nanotoxicity has susceptible population, Environ. Sci. Technol., 2008, 42(23), 8985–8992 CrossRef CAS.
- K. Peters, et al. Metallic nanoparticles exhibit paradoxical effects on oxidative stress and pro-inflammatory response in endothelial cells in vitro, Int. J. Immunopathol. Pharmacol., 2007, 20(4), 685–695 CAS.
- M. Helfenstein, et al. Effects of combustion-derived ultrafine particles and manufactured nanoparticles on heart cells in vitro, Toxicology, 2008, 253(1–3), 70–78 CrossRef CAS.
- R. Duffin, N. L. Mills and K. Donaldson, Nanoparticles – a thoracic toxicology perspective, Yonsei Med. J., 2007, 48(4), 561–572 CrossRef CAS.
- G. Oberdörster, E. Oberdörster and J. Oberdörster, Nanotoxicology: an emerging discipline evolving from studies of ultrafine particles, Environ. Health Perspect., 2005, 113(7), 823–839 CrossRef.
- N. L. Mills, et al. Adverse cardiovascular effects of air pollution, Nat. Clin. Pract. Cardiovasc. Med., 2009, 6(1), 36–44 CrossRef CAS.
- L. Borska, et al. Health risk of occupational exposure in welding processes I. Genotoxic risk, Acta Med. (Hradec Kralove, Czech Repub.), 2003, 46(1), 25–29 Search PubMed.
- J. T. Karlsen, et al. Chemical composition and morphology of welding fume particles and grinding dusts, Am. Ind. Hyg. Assoc. J., 1992, 53(5), 290–297 CrossRef CAS.
- A. Erdely, et al. Inhalation exposure of gas-metal arc stainless steel welding fume increased atherosclerotic lesions in apolipoprotein E knockout mice, Toxicol. Lett., 2011, 204(1), 12–16 CrossRef CAS.
- M. M. Shafer, et al. Reactive oxygen species activity and chemical speciation of size-fractionated atmospheric particulate matter from Lahore, Pakistan: an important role for transition metals, J. Environ. Monit., 2010, 12(3), 704–715 RSC.
- V. Stone, H. Johnston and M. J. D. Clift, Air pollution, ultrafine and nanoparticle toxicology: cellular and molecular interactions, IEEE Trans Nanobioscience, 2007, 6(4), 331–340 CrossRef.
- L. Müller, et al. Oxidative stress and inflammation response after nanoparticle exposure: differences between human lung cell monocultures and an advanced three-dimensional model of the human epithelial airways, J. R. Soc., Interface, 2010, 7(Suppl 1), S27–S40 CrossRef.
- C. Mühlfeld, P. Gehr and B. Rothen-Rutishauser, Translocation and cellular entering mechanisms of nanoparticles in the respiratory tract, Swiss Med. Wkly, 2008, 138(27–28), 387–391 Search PubMed.
- A. Elder and G. Oberdörster, Translocation and effects of ultrafine particles outside of the lung, Clin. Occup. Environ. Med., 2006, 5(4), 785–796 Search PubMed.
- H.-L. Hsieh, et al. NADPH oxidase-mediated redox signal contributes to lipoteichoic acid-induced MMP-9 upregulation in brain astrocytes, J. Neuroinflammation, 2012, 9(1), 110 CrossRef CAS.
- D. Bello, et al., Exposure to nanoscale particles and fibers during machining of hybrid advanced composites containing carbon nanotubes, J. Nanopart. Res., 2008, 11(1), 231–249 CrossRef.
- J. M. Antonini, et al. Effect of short-term stainless steel welding fume inhalation exposure on lung inflammation, injury, and defense responses in rats, Toxicol. Appl. Pharmacol., 2007, 223(3), 234–245 CrossRef CAS.
- J.-C. J. Luo, K.-H. Hsu and W.-S. Shen, Inflammatory responses and oxidative stress from metal fume exposure in automobile welders, J. Occup. Environ. Med., 2009, 51(1), 95–103 CrossRef CAS.
- J. D. McNeilly, et al. Soluble transition metals cause the pro-inflammatory effects of welding fumes in vitro, Toxicol. Appl. Pharmacol., 2004, 196(1), 95–107 CrossRef CAS.
- P. Demokritou, et al. A compact multistage (cascade) impactor for the characterization of atmospheric aerosols, J. Aerosol Sci., 2004, 35(3), 281–299 CrossRef CAS.
- R. O. Salonen, A. S. Pennanen, A. I. Halinen, M.-R. Hirvonen, M. Sillanpaa, R. Hillamo, V. Karlson, T. Koskentalo, P. Aarnio, S. T. Ferguson and P. Koutrakis, A chemical and toxicological comparison of urban air PM10 collected during winter and spring in Finland, Inhalation Toxicol., 2000, 12(suppl 2), 95–104 CAS.
- W. Kam, et al. Chemical characterization and redox potential of coarse and fine particulate matter (PM) in underground and ground-level rail systems of the Los Angeles metro, Environ. Sci. Technol., 2011, 45(16), 6769–6776 CrossRef CAS.
- M. Sotiriou, et al. Measurement of particle concentrations in a dental office, Environ. Monit. Assess., 2008, 137(1–3), 11 Search PubMed.
- S. Hu, et al. Redox activity and chemical speciation of size fractioned PM in the communities of the Los Angeles – Long Beach Harbor, Atmos. Chem. Phys., 2008, 8(3), 11643–11672 CrossRef.
- S. Hu, et al. Metals emitted from heavy-duty diesel vehicles equipped with advanced PM and NOX emission controls, Atmos. Environ., 2009, 43(18), 2950–2959 CrossRef CAS.
- A. P. Landreman, et al. A macrophage-based method for the assessment of the reactive oxygen species (ROS) activity of atmospheric particulate matter (PM) and application to routine (daily-24 h) aerosol monitoring studies, Aerosol Sci. Technol., 2008, 42(11), 946–957 CrossRef CAS.
- D. M. Underhill, Macrophage recognition of zymosan particles, J. Endotoxin Res., 2003, 9(3), 176–180 CAS.
- V. Verma, et al. Physicochemical and toxicological profiles of particulate matter in Los Angeles during the October 2007 southern California wildfires, Environ. Sci. Technol., 2009, 43(3), 954–960 CrossRef CAS.
- R. G. D. Steel, J. H. Torrie and D. A. Dickey, Principles and Procedures of Statistics: A Biometrical Approach, McGraw-Hill, 1997 Search PubMed.
- J. L. Rodgers and W. A. Nicewander, Thirteen ways to look at the correlation coefficient, Am. Stat., 1988, 42(1), 59 CrossRef.
- J. Dasch and J. D'Arcy, Physical and chemical characterization of airborne particles from welding operations in automotive plants, J. Occup. Environ. Hyg., 2008, 5(7), 444–454 CrossRef CAS.
- B. Berlinger, et al. Physicochemical characterisation of different welding aerosols, Anal. Bioanal. Chem., 2010, 399(5), 1773–1780 CrossRef.
- D. M. Bernstein, A review of the influence of particle size, puff volume, and inhalation pattern on the deposition of cigarette smoke particles in the respiratory tract, Inhalation Toxicol., 2004, 16(10), 15 CrossRef.
- N. Gowadia, M. J. Oldham and D. Dunn-Rankin, Particle size distribution of nicotine in mainstream smoke from 2R4F, Marlboro Medium, and Quest1 cigarettes under different puffing regimens, Inhalation Toxicol., 2009, 21(5), 435–446 CrossRef CAS.
- C. A. Hovde and P. C. Raynor, Effects of voltage and wire feed speed on weld fume characteristics, J. Occup. Environ. Hyg., 2007, 4(12), 903–912 CrossRef CAS.
- A. T. Zimmer and P. Biswas, Characterization of the aerosols resulting from arc welding processes, J. Aerosol Sci., 2001, 32(8), 993–1008 CrossRef CAS.
- G. Jane, L. Zhang, L. Lu, P. Wu and W. Zheng, Occupational exposure to welding fume among welders: alterations of mangenese, iron, zinc, copper, and lead in body fluids and the oxidative stress status, J. Occup. Environ. Med., 2004, 46, 8 Search PubMed.
- C. S. Yoon, N. W. Paik and J. H. Kim, Fume generation and content of total chromium and hexavalent chromium in flux-cored arc welding, Ann. Occup. Hyg., 2003, 47(8), 671–680 CrossRef CAS.
- J. M. Antonini, et al. Effect of stainless steel manual metal arc welding fume on free radical production, DNA damage, and apoptosis induction, Mol. Cell. Biochem., 2005, 279(1–2), 17–23 CrossRef CAS.
- M. Valko, H. Morris and M. T. D. Cronin, Metals, toxicity and oxidative stress, Curr. Med. Chem., 2005, 12(20), 48 Search PubMed.
- S. D. Aust, L. A. Morehouse and C. E. Thomas, Role of metals in oxygen radical reactions, J. Free Radicals Biol. Med., 1985, 1(1), 3–25 CrossRef CAS.
- X. Huang, et al. Redox-active metals, oxidative stress, and Alzheimer's disease pathology, Ann. N. Y. Acad. Sci., 2004, 1012, 153–163 CrossRef CAS.
- G. Loupa, E. Karageorgos and S. Rapsomanikis, Potential effects of particulate matter from combustion during services on human health and on works of art in medieval churches in Cyprus, Environ. Pollut., 2010, 158(9), 2946–2953 CrossRef CAS.
- B. O'Connor and S. Genest, PM10 and PM2.5 Emissions from Pulp and Paper Mill Combustion Sources Using a Dilution Tunnel Sampler, in TAPPI International Environmental Conference, Pointe-Claire, Quebec, 2003 Search PubMed.
- H. C. Fischer and W. C. W. Chan, Nanotoxicity: the growing need for in vivo study, Curr. Opin. Biotechnol., 2007, 18(6), 565–571 CrossRef CAS.
- C. Carlson, et al. Unique cellular interaction of silver nanoparticles: size-dependent generation of reactive oxygen species, J. Phys. Chem. B, 2008, 112(43), 13608–13619 CrossRef CAS.
- H. L. Karlsson, et al. Copper oxide nanoparticles are highly toxic: a comparison between metal oxide nanoparticles and carbon nanotubes, Chem. Res. Toxicol., 2008, 21(9), 1726–1732 CrossRef CAS.
- H. L. Karlsson, et al. Size-dependent toxicity of metal oxide particles – a comparison between nano- and micrometer size, Toxicol. Lett., 2009, 188(2), 112–118 CrossRef CAS.
Footnote |
| † Electronic supplementary information (ESI) available. See DOI: 10.1039/c2em30505d |
| This journal is © The Royal Society of Chemistry 2013 |