Li–S batteries: simple approaches for superior performance†
Rezan
Demir-Cakan
ab,
Mathieu
Morcrette
ab,
Gangulibabu
ac,
Aurélie
Guéguen
db,
Rémi
Dedryvère
db and
Jean-Marie
Tarascon
*ab
aLRCS, University of Picardie Jules Verne, 33 Rue Saint-Leu, 80039, Amiens, France. E-mail: jean-marie.tarascon@sc.u-picardie.fr; Tel: +33 03 22 82 75 71
bALISTORE-ERI, 33 Rue Saint-Leu, 80039, Amiens, France
cCSIR – Central Electrochemical Research Institute, Karaikudi, 630 006, India
dIPREM-ECP (UMR 5254 CNRS), University of Pau, France
First published on 23rd October 2012
Abstract
Although promising improvements have been made in the field of Li–S rechargeable batteries, they are still far from reaching the market place due to several drawbacks. To combat the solubility of polysulphides, confinement approaches aiming to trap sulphur within the cathode side have been pursued, but success has been limited. Herein, we drastically deviate from this approach and use a liquid cathode obtained either by dissolving polysulphides within the electrolyte or by placing sulphur powders in contact with the Li negative electrode. Such approaches are shown to result in greater performance than confinement approaches. Such a strategy eliminates the detrimental Li2S formation inside a porous carbon matrix and moreover leads to the formation of a protective SEI layer at the Li electrode, as deduced by impedance spectroscopy and XPS, which seems beneficial to the cell cycling performance.
Broader contextDeveloping lithium ion batteries for load levelling and transport is a formidable challenge, especially for materials chemistry, and will be a major focus of endeavour for years to come. However, in the longer term, lithium ion batteries cannot deliver high energy densities and more radical approaches are necessary to go beyond this limit. One of the possibilities for achieving longer storage life and high energy batteries associated with cost advantage is the lithium–sulphur (Li–S) system which can offer 3–5 times the increase in energy density compared with conventional Li-ion cells. Although the Li–S system has interested the battery community for more than five decades, it still faces issues such as poor cycle life, to reach the market place. The paper targets this issue, both at the fundamental and applied level. Most of today's Li–S battery research is devoted, without great success, to design the best cathode architecture to trap sulphur or its reduction species. Knowing the fact that there is an unavoidable diffusion of polysulphides from the confined matrixes, herein, a new path that totally deviates from these confinement approaches is explored. As a midway approach, the use of chemically synthesized polysulphide species as an active material rather than sulphur impregnated composites is explored with satisfactory results. Moreover, a totally unusual cell configuration lies in the assembling of “S deposited on Li anode” which performs astonishingly and compares favourably to the conventional Li–S cell set-up. Such an improvement is based on a native SEI film forming at the Li negative surface similar to what is happening for the Li–SO2Cl cells. This last approach provides a wide range of opportunities to reconsider the assembly of Li–S cells with the hope that they could finally reach the market place. |
Introduction
The lithium–sulphur (Li–S) battery system is one of the viable options for electric vehicles to achieve a long driving range (i.e. >300 km) since the present prototypes effectively offer higher specific energy density than conventional lithium ion batteries. Despite such an appeal, Li–S batteries are not yet commercialized, the reason being that they suffer from rapid capacity fading. This poor performance comes from each cell compartment. Among them are: (i) the use of a Li metal anode which essentially brings safety problems with liquid electrolytes, (ii) the low active material utilization due to the insulating nature of sulphur, (iii) the soluble polysulphide species generated during the battery operation, which diffuse throughout the separator and deposit on the Li electrode resulting in a loss of active material, and (iv) the irreversible deposition of non-soluble lithium sulphide (Li2S) both at the cathode and Li anode.These issues are not new as this battery technology has been extensively studied over the past five decades,1 nevertheless they partially remain despite intense research efforts. Recently, most of the studies have been aiming at finding the best cathode configuration via a precise control of its porosity so as to retain part of the electrochemically generated polysulphide species generated at the cathode side. Different strategies of cathode architectures have been pursued. They rely on the use of either conductive carbonaceous materials2–7 or insulating powders having high microporosity such as MOFs or porous silica.8 Although these strategies have slowed down the diffusion of soluble polysulphides, they have not led to a viable solution for long time use. No matter whether the starting sulphur is a solid powder or not, the migration of soluble polysulphides is unavoidable with the present cell configurations.
Moreover, another issue is rooted in the formation of non-soluble and insulating Li2S which further precipitates on the composite matrix. Such a Li2S deposit, which accounts for ∼50% volume expansion as compared to S, might result in the collapse of the porous host matrix. This collapse upon formation of Li2S was nicely demonstrated by Aurbach et al. in the study of the aging of a sulphur–carbon mixture electrode.9 Hence a great amount of work is being presently devoted to the engineering of better host carbon matrices.
In this paper we deviate from these approaches and explore the use of chemically synthesized polysulphide species as an active material rather than sulphur impregnated composites in order to eliminate the formation of Li2S within a porous structure. Cells that have polysulphides acting as active materials are shown to present superior performance to the conventional Li–S cell configuration. Moreover, we found that these performances can even be further enhanced when sulphur is directly deposited on the Li negative electrode. A native SEI film (as deduced by in situ EIS measurements and XPS analysis) could be at the origin of this improvement.
Experimental section
Preparation of catholytes
Electrolyte solutions used in this study were 1 M lithium bis (trifluoromethanesulfonyl) imide (LiTFSI) containing tetramethylene sulfone (TMS). Polysulphides with a nominal formula of Li2Sx (x > 2) were chemically synthesized by reacting with stoichiometric amounts of sulphur and lithium in ethylene glycol diethyl ether at 150 °C. Afterwards, those polysulphides were dissolved in the electrolyte (catholyte) and used directly as an active material. Sulphur loading in the polysulphide was carefully tuned; for instance, 100 mM, 200 mM and 300 mM Li2S5 in 0.1 mL of electrolyte contain 1.6, 3.2 and 4.8 mg of sulphur, respectively.Preparation of S deposited on Li (SLi)
Deposition of sulphur on Li (denoted as “SLi”) was performed manually by weighing (3.2, 5.1 and 6.8 mg) sulphur powder on a 0.5 cm2 Li foil surface, and 10 mg of carbon (Ketjen Black, EC-300J) was used as both a conductive additive and counter electrode. Ketjen Black and SLi were separated by a Whatman® separator. The sulphur content in the entire cell was calculated considering Ketjen Black carbon and sulphur as one composite (x mg S/(10 mg C + x mg S)).Preparation of the mesoporous C–S composite
For comparison, the mesoporous C–S (50/50 wt%) composite was prepared by infiltration of sulphur (at 155 °C) into the mesoporous carbon.2 Prior to testing, the composite was hand-milled with 20 wt% Ketjen Black carbon. The final composite contained 40% S, and the sulphur content in the Swagelok cell was adjusted to 2.4 mg. For the electrochemical test 0.1 mL of 1 M LiTFSI containing TMS was used as the electrolyte.Electrochemical measurements
Galvanostatic cycling measurements were performed with a classical two-electrode Swagelok-type™ cell using 0.1 mL of 1 M LiTFSI containing TMS with the C/10 current density voltage range between 1.0 and 3.0 V vs. Li using a galvanostat/potentiostat VMP3. The amount of electrolyte was fixed to be 0.1 mL for all the cases, namely, the C–S composite, SLi and the catholytes.Electrochemical impedance spectroscopy (EIS) measurements
EIS of the Li electrode was carried out using a 3 electrode cell where Li is used as the reference and measured within the range of 200 kHz to 2 mHz, with a voltage amplitude of 5 mV around 0 V (Li/Li+) in VMP3. First, the spectra of the Li electrode were collected at open circuit voltage (OCV) every 2.5 h time interval until it reaches a steady-state RSL value (SL: surface layer). For comparing the rate of the SEI growth as well as the impact of sulphur or the polysulphide on Li surface layer formation over time, three different media were used (i) only the electrolyte, (ii) 1.6 mg of S on Li with the electrolyte, (iii) 100 mM Li2S5 (equivalent to 1.6 mg of S) with the electrolyte (Fig. 4). Moreover, 3.2 mg of S on Li after being aged for 72 h is cycled and the corresponding EIS is measured for each Δx = 0.1 change of composition in LixS (Fig. 5).Viscosity measurements
The viscosities of the electrolyte at different concentrations of the polysulphides dissolved into the electrolyte were measured with a Brookfield viscosimeter at different speeds ranging from 30 to 80 rpm at ambient temperature.XPS measurements
The measurements were carried out with a Thermo Scientific K-Alpha spectrometer, using a focused monochromatized Al Kα radiation (hν = 1486.6 eV). The XPS spectrometer was directly connected through a transfer chamber to an argon dry box, in order to avoid moisture/air exposure of the samples. For the Ag 3d5/2 line the full width at half maximum (FWHM) was 0.65 eV under the recording conditions. The analyzed area of the samples was a 400 μm diameter disk. Peaks were recorded with a 20 eV pass energy and with charge neutralization. The pressure in the analysis chamber was around 2 × 10⁻⁷ mbar. Short acquisition time spectra were recorded before and after each normal experiment to check that the samples did not suffer from degradation during the measurements. The binding energy scale was calibrated from the hydrocarbon contamination using the C 1s peak at 285.0 eV. Core peaks were analyzed using a nonlinear Shirley-type background.10 The peak positions and areas were optimized by a weighted least-square fitting method using 70% Gaussian and 30% Lorentzian lineshapes.Four different samples were analyzed. Firstly we tested the Li foil after ageing into the electrolyte for 6 days to see the impact of the solvent and salt on the surface of the Li. Other three analyses consist of Li foils recovered from the Swagelok cells after being cycled, which aim to observe the surface layer formation in the presence of the mesoporous C–S composite, 100 mM Li2S5 containing the polysulphide and 1.6 mg of S deposited on Li. No washing procedures were applied before the analysis.
Results and discussions
We attempted to visualize the Li2S formation and the resulting morphological changes at the mesoporous carbon–sulphur composite during battery operation by variable analytical means. In situ X-ray diffraction studies were performed on a Li–S cell (Fig. 1a) showing the appearance of a Bragg peak near 2θ = 32° corresponding to the formation of crystalline Li2S through the end of the discharge (Fig. 1b). This Li2S does not fully convert back to a long chain polysulphide upon recharge since its corresponding Bragg peak still remains visible at the end of the first charge. To further confirm the Li2S deposit upon cycling, cycled electrodes were observed by SEM, and the micrographs are reported for a pristine C–S composite electrode (Fig. 1c) and a similar electrode cycled 20 times (Fig. 1d). The cycled electrode shows the presence of a copious film surrounding the particles. We believe that this growing layer results from the deposit of insulating species on the mesoporous carbon.9,11 Moreover, association with this Li2S deposit within the pores of the composite triggers a nearly ∼50% volume expansion as compared to free S. This implies a stress on the porous robust structure, which we believe to be detrimental to the electronic percolation within the electrode. As can be seen in Fig. S1 (ESI†), the TEM images of the pristine C–S composite and the composite after the 20th cycle reveal that the morphological change occurs upon cycling in which the carbon nano-rods are not well defined any longer after the 20th cycle.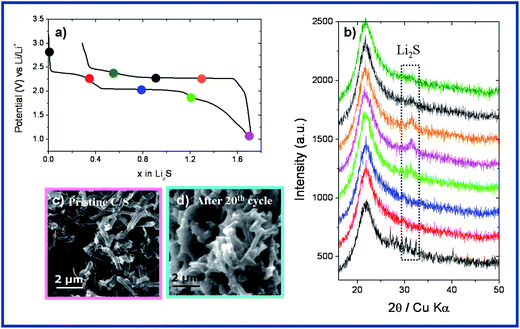 | ||
| Fig. 1 (a) First discharge–charge profile of the mesoporous carbon–sulphur composite, (b) in situ XRD observation showing the formation of Li2S and its partial reversibility upon oxidation, (c) SEM picture of the pristine mesoporous carbon–sulphur composite, (d) SEM picture of the mesoporous carbon–sulphur composite after the 20th cycle. | ||
As a consequence, to combat the electrode structural deformation caused by Li2S, we suggest exploring the use of catholytes (e.g. polysulphides dissolved into the electrolyte) as active materials, while being aware that a similar approach leading to deceiving results (e.g. limited capacity coupled with a low coulombic efficiency) has recently been reported.12,13 We carried out our study by monitoring the voltage profiles of two different catholytes made by dissolving polysulphides of different lengths, namely Li2S2 and Li2S8, in the 1 M LiTFSI containing TMS electrolyte. The results are shown in Fig. 2a together with those obtained on a conventional mesoporous C–S composite for comparison purposes. Since sulphur and its reduction species are not electronically conductive, Ketjen Black carbon was selected to facilitate the electronic wiring and used as the positive electrode. The Li2S8-bearing cell shows a voltage composition curve which is analogous to that of a Li–S cell but with reduced polarization, implying better kinetics (Fig. 2a). In contrast to the Li2S8-bearing cell, the behavior of the Li2S2-bearing cell is less spectacular (e.g. the presence of a long voltage continuous decay towards the end of charge) and this is most likely due to the fact that Li2S2 is poorly soluble in many electrolytes, the reason why catholytes made out of Li2S2 were not further studied.
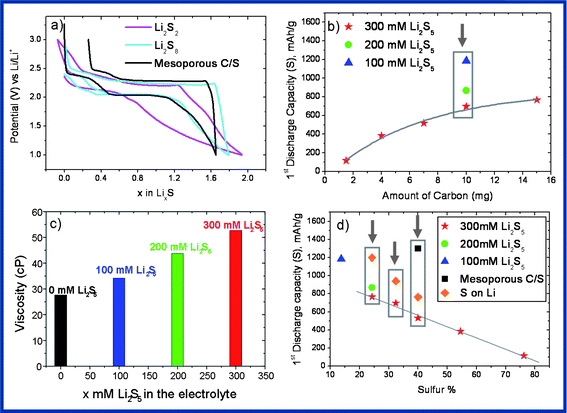 | ||
| Fig. 2 (a) First discharge–charge profile of the chemically synthesized Li2S2 and Li2S8 as active materials and the mesoporous C–S composite. Note: the polysulfide with the given length (synthesized with a careful stoichiometric ratio between S and Li) is known to undergo a disproportion reaction in the solvent (e.g. Li2S6 = Li2S4 + Li2S8). This is why in order to eliminate a possible misleading, x = 0 is used for both Li2S2 and Li2S8 cases, (b) the impact of the carbon amounts on the first discharge capacity, (c) the viscosity of the electrolyte/catholytes at different concentrations, (d) the impact of the sulphur content on the first discharge capacity (note: the value for the S deposited on Li (SLi) samples is considered after obtaining a typical charge–discharge curve). | ||
At this juncture, for practical reasons, the ratio of S (coming from the dissolved polysulphide species) to carbon (e.g. weight of the positive electrode, Ketjen Black EC-300J) needs to be quantified and its effect on the cell performance needs to be determined. To do so we mounted several cells using either the constant positive carbon electrode and changing the amount of polysulphides or vice versa. We started with a 300 mM Li2S5 catholyte which translates into a positive electrode containing 4.8 mg of S for 10 mg of Ketjen Black carbon and then changed the amount of carbon purposely. Fig. 2b (red stars) shows that there is an exponential correlation between the amount of carbon and the discharge capacity as expected since addition of carbon improves the electronic percolation. An increase in the amount of carbon per gram of sulphur can also be achieved by simply reducing the initial concentration of Li2S5 in TMS which at the same time reduces the electrolyte viscosity. The result of such a complementary effect is shown in Fig. 2b which displays the impact of the concentration of Li2S5 in the presence of 10 mg of Ketjen Black carbon, with the highest first discharge capacity being achieved for the less concentrated solution, namely 100 mM Li2S5 containing TMS (blue triangle). The viscosity measurements (Fig. 2c) naturally revealed an increase in viscosity by dissolving a higher amount of polysulphides into the electrolyte. We indeed experimentally found that at 60 rpm, the room temperature viscosity of the 1 M LiTFSI containing TMS electrolyte (27.58 cP) increases to 34.22, 43.76, and 52.66 cP, as 100 mM, 200 mM and 300 mM Li2S5 are added to the electrolyte, respectively. To confirm this hypothesis, viscosity measurements were performed at room temperature and at different speeds ranging from 30 to 80 rpm in which the viscosity values remained stable showing the Newtonian type of fluid.
To test further the effect of viscosity, the first discharge capacity was determined for the cells containing 40 wt% S by using either a classical mesoporous C–S positive electrode or a 300 mM Li2S5/C catholyte (4.8 mg S/7.5 mg C). The results reported in Fig. 2d indicate a greater discharge capacity for the cell using the less viscous electrolyte (e.g. free of polysulphides to start with). This does not come as a surprise since low viscosity favors wettability and enhances the transport of soluble species. Therefore, in spite of the initial larger capacity, the mesoporous C–S cell shows poorer capacity retention than the polysulphide-based one, further indicating the unfavorable structural deformations caused by Li2S formation within the porous carbon (Fig. 3b).
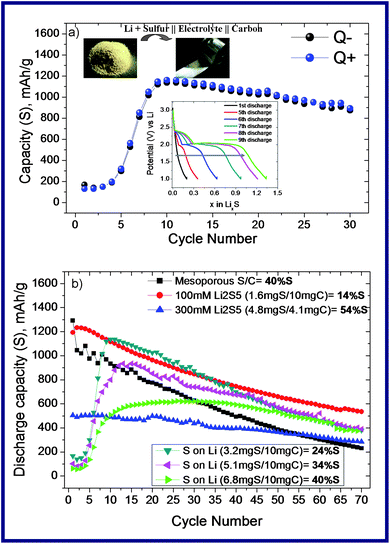 | ||
| Fig. 3 (a) Cycling performance of SLi (3.2 mg of sulphur is deposited on the Li disc and directly used as an active material which is separated by a Whatman® separator from a 10 mg of Ketjen Black carbon which is employed as a conductive additive and counter electrode. The inset figure shows the in situ formation of the polysulphides upon cycling; (b) cycling performance of the different samples (the specific capacity was calculated by using the active material mass (sulphur) of the composites, given in mA h g−1). | ||
The aforementioned beneficial effect of having polysulphides as a positive electrode in Li–S cells is somewhat counterintuitive in light of early literature reports which state that those polysulphides are poisoning species for the Li metal electrode. Upon cycling, the polysulphides are believed to be copiously reduced at the Li metal surface, leading to the growth of an insulating thin film deposit preventing electron transfer and causing premature cell cycling failure. Thus, at this stage a question that still remains concerns the effect of such an approach on the state of the Li negative electrode.
With the aim of throwing some light on this issue, we employ an unusual cell system where S is deposited on the Li anode (SLi) and cycled (Fig. 3a). Astonishingly, as cycling progresses this new cell configuration performs as good as the conventional Li–S cell set-up thanks to the in situ created polysulphide species. In the beginning, there is almost no capacity gain presumably due to the insulating nature of sulphur. During the first several discharge–charge cycles, the reversible capacity of the cell increases and reaches a maximum near the 8th cycle (inset of Fig. 3a). At this stage, the voltage–composition curve displays the same signature, with two well pronounced plateaus, as classical Li–S cells. Upon subsequent cycling, we pleasantly note that the capacity fading is less pronounced than for cells based on mesoporous C–S composite electrodes and we further experienced that this capacity can be further tuned by the C–S ratio (Fig. 3b).
To investigate the rate of the SEI growth on the Li electrode, a control impedance spectroscopy (EIS) experiment has been performed by using (i) a bare electrolyte, (ii) 1.6 mg of SLi in the presence of the electrolyte, and (iii) 100 mM Li2S5 dissolved into the electrolyte (Fig. 4). For this study we use a 3-electrode cell to monitor the impedance change on the Li surface with storage time. Every 2.5 h one EIS is recorded at OCV without applying any current. Fig. 4a, c and e show the evolution of EIS spectra collected as a function of time for a freshly assembled Li–S cell in three different cases. They are all characterized by a semicircle mirroring the Li+ diffusion in the surface film. Note that this film is initially formed even at a time scale of seconds due to the interaction of solvent molecules with the active metal surface.14 Upon aging, the resistance of the surface layer (RSL) gradually increases (Fig. 4b, d and f), indirectly indicating the advent of interfacial chemical reactions between the in situ native polysulphides, salts and the solvent to finally approach a steady-state value of time beyond 72 hours. The impact of the presence of sulphur or the polysulphide on the formation of the protective layer is evident by the sulphur particles (Fig. 4d) or polysulphide (Fig. 4f) which acts as an active participant resulting in higher Li surface resistance growth over time.
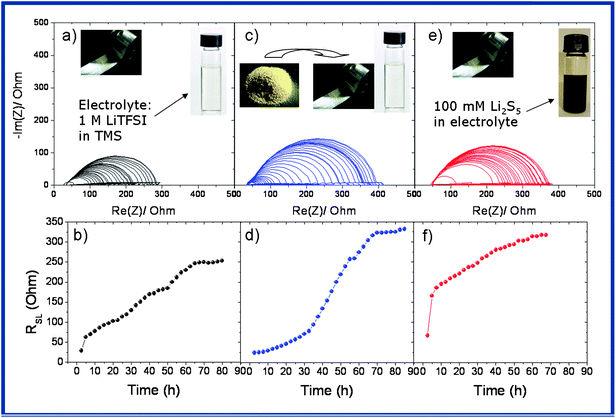 | ||
| Fig. 4 EIS measurements for monitoring the rate of SEI growth on the Li electrode in the presence of (a and b) an electrolyte, (c and d) 1.6 mg of S on Li with the electrolyte, (e and f) 100 mM Li2S5 (equivalent to 1.6 mg S). Measurements are performed every 2.5 h. RSL = resistance on the Li surface. | ||
To understand this apparent Li surface resistance upon cycling for Li–S cells built by the deposition of 3.2 mg of S on the Li foil we decided to perform in situ electrochemical impedance spectroscopy (EIS). Fig. 5a shows the EIS spectra evaluation upon storage and the impact of the amount of sulphur on the surface layer formation is clear when 1.6 mg (Fig. 4c) and 3.2 mg (Fig. 5a) of S are compared. After a 72 h ageing period at OCV, the cell was electrically connected and a quantity of electricity corresponding to the uptake of 0.1 Li+ was passed through the cell and the EIS spectrum was collected (Fig. 5b). The same sequence was repeated for every 0.1 Li+ until complete reduction of the cell. A drastic drop in the cell resistance (Fig. 5c) is observed as soon as the cell is exposed to an electrical field and the resistance further drops upon subsequent removal of Li+ till the end of the discharge. Such an electric-driven resistance is not new and has been already observed in the past and explained in terms of the surface film formation having different transport properties for Li ion.15 At this stage, it is tempting to view the present Li–S configuration as mimicking somewhat the primary lithium thionyl chloride cells which consist of a metallic lithium anode and a liquid cathode comprising a porous carbon current collector filled with thionyl chloride (SOCl2). Interestingly, during the operation of such a cell there is an instantaneous formation of an ionic blocking LiCl membrane whose ionic conductivity decreases considerably when the cell is connected. Moving back to the EIS spectra collected upon oxidation of our samples it must be noted that whatever the value of x, the resistance on the Li electrode surface almost remains the same whereas the solution resistance is increased (Fig. 5d). The latter is most likely rooted in a viscosity effect with the formation of a longer chain polysulphide creating a viscous solution which diminishes ion transport, hence leading to an increase in resistance. So in short, a protecting film seems to develop as soon as the Li foil covered with Li is placed.
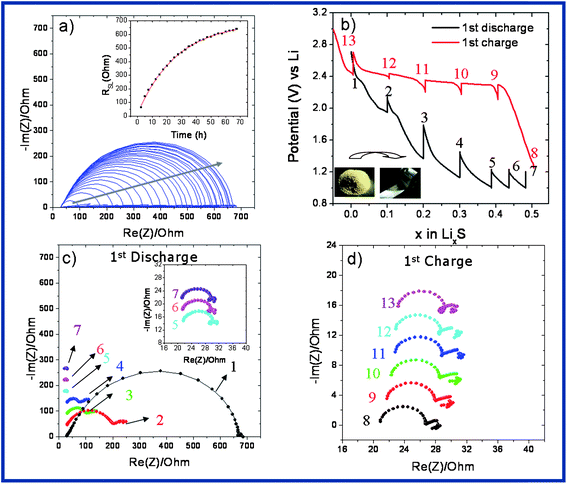 | ||
| Fig. 5 (a) 3-Electrode EIS spectra of SLi recorded at OCV at 2.5 h time intervals until it reaches a steady-state RSL value, (b) first discharge–charge profile of SLi in which every 0.1 electron insertion EIS was applied, (c) EIS results of the first discharge of SLi, and (d) EIS results of the first charge of SLi. | ||
In order to have a clearer picture of the surface processes leading to the growth of surface films at the Li anode we performed XPS analysis, a powerful technique to scrutinize electrode surfaces. To start with, we studied the surface evolution of the Li foil sample being exposed to the electrolyte for 6 days. Afterwards, XPS analyses were performed on the Li foils after being recovered from Swagelok cells. No washing of the recovered Li foils by TMS was done prior to the XPS analysis so as to not alter the surface deposits which may contain soluble species in TMS. Fig. 6 shows the S 2p spectra for the aforementioned four samples. Note that, common to all the spectra, the splitting of the S 2p signal into two components S 2p3/2 and S 2p1/2 separated by 1.2 eV and with an intensity ratio of 2/1 is the result of a spin–orbit coupling effect.
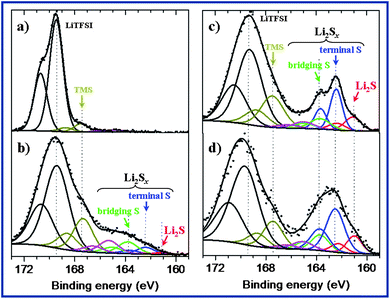 | ||
| Fig. 6 XPS S 2p spectra of: (a) a Li foil simply soaked into the electrolyte (TMS/LiTFSI) for 6 days and of Li electrodes recovered after cycling in Swagelok cells, (b) Li recovered from the SLi sample after 8 cycles, (c) Li recovered after the first discharge of the mesoporous C–S composite and (d) Li recovered after the first discharge of the cell containing Li2S5 in the electrolyte. | ||
The S 2p spectrum of the Li foil simply soaked into the electrolyte (Fig. 6a) shows the signatures of the salt LiTFSI (S 2p3/2 at 169.5 eV) and of the solvent TMS at 167.5 eV (dark yellow). An additional weak peak at ∼165 eV (pink) can also be detected, probably associated to the degradation of the TMS solvent at the Li surface. Besides, note that F 1s and N 1s spectra (not shown here) allowed the evidence of a slight degradation process of the LiTFSI salt at the surface of Li, especially by deposition of a small amount of LiF. This is in good agreement with EIS experiments as discussed above in Fig. 4a in which reduction of the salt and solvent takes place on the highly reactive Li surface and results in an increase in the surface layer resistance.
XPS analysis of the Li foil after cycling is displayed in Fig. 6b–d. The S 2p spectrum of the Li electrode recovered after the first discharge of the mesoporous C–S composite (Fig. 6c) displays a main peak at 162.4 eV (blue component) assigned to terminal sulphur atoms of Li2Sx. As the green component assigned to bridging sulfur atoms (163.7 eV) of Li2Sx is much weaker, the main species at the surface appears to be Li2S2. Lithium sulfide Li2S (red component) is also present. The green component may be due to other short-chain Li2Sx compounds (probably Li2S3).
The S 2p spectrum of the Li electrode recovered after the first discharge of the cell containing Li2S5 in the electrolyte (Fig. 6d) is very similar to that of the mesoporous C–S composite despite a broadening effect of the peaks due to the parasitic charging effect in the XPS analysis chamber. Therefore, the addition of Li2S5 in the electrolyte does not result in significant changes at the surface after a first discharge in the Swagelok cell.
However, for the SLi electrode recovered after cycling the surface chemistry is rather different (Fig. 6b) as both the amount of Li2S is very low (red component) and that of other Li2Sx compounds at the surface of this sample is also rather low compared to previous samples. In this case the proportion of bridging sulfur (green) is greater than that of terminal sulfur (blue). Therefore, the length of the polysulphide chains is greater than for previous samples. In summary, the surface chemistry of the SLi as deduced from XPS experiments tends to show that a SEI type of layer is formed at the surface of Li by reduction of sulphur during contact with the electrolyte, and this layer prevents the formation of the last reduction product of sulphur (namely Li2S) at the surface of Li upon further cycling. This lower Li2S content at the Li surface seems to be at the origin of the improvement of the electrochemical performance.
Conclusions
Targeting the origin of the rapid capacity decay in Li–S batteries is a must if we ever want this system to become a reality for load leveling and transport. To address this issue we report on two different approaches enlisting the use of either polysulphides as active materials or S deposited on Li, both aiming to eliminate the detrimental formation of Li2S at the porous carbon matrix. Besides leading to performance improvements in terms of capacity retention, these approaches have also led to better insights regarding the impact of sulfur deposited on the Li surface. Via the use of EIS spectroscopy, we have shown evidence for the growth of a specific SEI which can act as a self-limiting barrier for chemical reactions while enabling to carry Li-ions upon application of an electrical field. To conclude, this SEI layer seems to combine attractive features, hence the crucial importance to understand both its nature and composition and to pursue more intensive chemical/physical analysis enlisting combined XPS-NMR surface analytical techniques. Although not fully understood, such a finding, which somewhat mimics what happens in Li–thionylchloride primary cells, holds some promises regarding the feasibility to build Li–S cells differently for sustainable performance.Acknowledgements
The authors acknowledge ALISTORE European Research Institute (ERI) for the financial support. We are also thankful to Robert Dominko and Danielle Gonbeau for helpful discussions. Jean-Pierre Bonnet is acknowledged for the help with the viscosity measurements. Carine Davoisne is acknowledged for the TEM microstructural analyses.References
- D. Herbert and J. Ulam, US Pat., No: 3043896, 1962.
- X. Ji, K. T. Lee and L. F. Nazar, Nat. Mater., 2009, 8, 500 CrossRef CAS.
- C. Liang, N. J. Dudney and J. Y. Howe, Chem. Mater., 2009, 21, 4724 CrossRef CAS.
- C. Wang, J. J. Chen, Y. N. Shi, M. S. Zheng and Q. F. Dong, Electrochim. Acta, 2010, 55, 7010 CrossRef CAS.
- S. Li, M. Xie, J. B. Liu, H. Wang and H. Yan, Electrochem. Solid-State Lett., 2011, 14, A105 CrossRef CAS.
- H. Wang, Y. Yang, Y. Liang, J. T. Robinson, Y. Li, A. Jackson, Y. Cui and H. Dai, Nano Lett., 2011, 11, 2644 CrossRef CAS.
- G. Zheng, Y. Yang, J. J. Cha, S. S. Hong and Y. Cui, Nano Lett., 2011, 11, 4462 CrossRef CAS.
- R. Demir-Cakan, M. Morcrette, F. Nouar, C. Davoisne, T. Devic, D. Gonbeau, R. Dominko, C. Serre, G. Ferey and J.-M. Tarascon, J. Am. Chem. Soc., 2011, 133, 16154 CrossRef CAS.
- R. Elazari, G. Salitra, Y. Talyosef, J. Grinblat, C. Scordilis-Kelley, A. Xiao, J. Affinito and D. Aurbach, J. Electrochem. Soc., 2010, 157, A1131 CrossRef CAS.
- D. A. Shirley, Phys. Rev. B: Solid State, 1972, 5, 4709 CrossRef.
- C. Barchasz, J.-C. Leprêtre, F. Alloin and S. Patoux, J. Power Sources, 2012, 199, 322 CrossRef CAS.
- S. S. Zhang and J. A. Read, J. Power Sources, 2012, 200, 77 CrossRef CAS.
- S. S. Zhang and D. T. Tran, J. Power Sources, 2012, 211, 169 CrossRef CAS.
- A. Zaban, E. Zinigrad and D. Aurbach, J. Phys. Chem., 1996, 100, 3089 CrossRef CAS.
- D. Aurbach, E. Pollak, R. Elazari, G. Salitra, C. S. Kelley and J. Affinito, J. Electrochem. Soc., 2009, 156, A694 CrossRef CAS.
Footnote |
| † Electronic supplementary information (ESI) available. See DOI: 10.1039/c2ee23411d |
| This journal is © The Royal Society of Chemistry 2013 |
