Aqueous dye-sensitized solar cell electrolytes based on the cobalt(II)/(III) tris(bipyridine) redox couple†
Wanchun
Xiang
a,
Fuzhi
Huang
b,
Yi-Bing
Cheng
b,
Udo
Bach
bcd and
Leone
Spiccia
*a
aSchool of Chemistry, Monash University, Victoria 3800, Australia. E-mail: Leone.Spiccia@monash.edu; Fax: +61 3 9905 4597; Tel: +61 3 9905 4526
bDepartment of Materials Engineering, Monash University, Victoria 3800, Australia. E-mail: Udo.Bach@monash.edu; Fax: +61 3 9905 4940; Tel: +61 3 9905 6264
cCommonwealth Scientific and Industrial Research Organization, Materials Science and Engineering, Flexible Electronics Theme, Clayton South, Victoria 3169, Australia
dMelbourne Centre for Nanofabrication, 151 Wellington Road, Clayton, VIC 3168, Australia
First published on 8th October 2012
Abstract
In this study, we report the first application of a cobalt(II)/(III) tris(2,2′-bipyridine) based aqueous electrolyte in the fabrication of dye-sensitized solar cells. An improvement in short circuit current was observed by adjusting the concentration of polyethylene glycol in the aqueous electrolyte, which is attributed to better diffusion of the redox mediator within the electrolyte. Replacement of platinum with a composite ITO/platinum counter electrode material results in a further increase in energy conversion efficiency to above 5%. Electrochemical impedance measurements indicate a dramatic decrease in charge transport resistance at the interface between the counter electrode and aqueous electrolyte when ITO/Pt was used. Moreover, significantly improved device stability over previously reported water based DSCs under 1 sun illumination suggests that cobalt(II)/(III) tris(2,2′-bipyridine) is a promising redox mediator for highly efficient aqueous dye-sensitized solar cells.
Broader contextDye-sensitized solar cells (DSCs) are viable alternatives to conventional solid-state semiconductor devices because they provide the prospect of producing photovoltaic devices at low cost and from abundant starting materials. Another attractive feature of DSCs is the wide variety of different electrolyte components that can be utilized, affording great opportunities to improve device performance as well as stability. The benchmark efficiency of DSCs has been obtained by using liquid electrolytes based on organic solvents which possess the potential disadvantage of toxicity. Water, an earth-abundant, non-toxic and non-flammable resource, has not been paid great attention with regard to its usage in DSCs. In this paper, an aqueous electrolyte incorporating the cobalt(II)/(III) tris(2,2′-bipyridine) redox couple is introduced into the DSC for the first time. In order to enhance the device performance, polyethylene glycol has been used as an electrolyte additive in conjunction with an ITO/Pt film as a counter electrode resulting in a record aqueous DSC efficiency of 5.1%. An evaluation of the variation in device performance on storage in the dark and under one sun light illumination reveals that these cobalt-based aqueous DSCs exhibit very high stability. |
Introduction
Dye-sensitized solar cells (DSCs) have been intensely studied as a promising renewable energy technology with the potential to achieve high energy conversion efficiencies at low cost.1–8 DSCs typically consist of a sensitized mesoporous semiconductor film on a conductive substrate as a working electrode and a platinized counter electrode, bridged by an electrolyte film containing the reduced and oxidized forms of the redox mediator. The latter mediates charge transport between the two electrodes and is also responsible for the regeneration of the photooxidized dye, following electron injection into the TiO2. The application of a cobalt(II)/(III) tris(2,2′-bipyridine) based electrolyte has recently resulted in a benchmark efficiency of >12%.9 This result has accelerated the transition to non-iodide based electrolytes, which are less corrosive and exhibit weaker absorption of visible light.10Although high efficiencies have been achieved, these DSCs have been fabricated with liquid electrolytes using organic solvents. Such solvents have the potential disadvantage of high vapor pressure and, most importantly, are not environmentally friendly. Consequently, electrolytes based on ionic liquids, plastic crystals and solid-state conductors11–13 are currently being explored. However, the ingress of moisture or water into the cell still affects their long-term stability,14,15 and thus represents a challenge towards the encapsulation and choice of barrier materials used for the fabrication of DSCs. Alternatively, electrolytes based on water, a cheap, earth-abundant, non-toxic and non-flammable solvent, do not have such problems and have attracted interest.16,17 For example, Law et al. have reported DSCs constructed with iodide-based electrolytes to which varying proportions of water were added.16 For the electrolyte prepared with 100% water, an energy conversion efficiency of 2.4% was achieved. The presence of water in electrolytes has been found to promote the “bleaching” of iodine at the counter electrode (reduction) resulting in an increase in the internal resistance of the cell.18 Recently, an aqueous DSC electrolyte based on the hexacyanoferrate(II)/(III) redox couple ([Fe(CN)6]4−/3−) was developed, which resulted in a device efficiency of 4.1%.17 However, the photoinstability of [Fe(CN)6]3− represents a major drawback of this electrolyte. Here, the application of the [Co(bpy)3]2+/3+ redox couple (Fig. 1a) in aqueous DSC electrolytes is reported for the first time. Device efficiencies of over 5% have been achieved – the highest reported so far for aqueous DSCs – together with greatly improved stability over the [Fe(CN)6]4−/3− based devices.
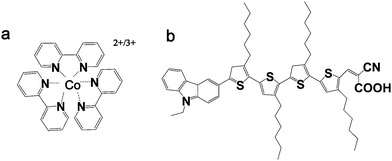 | ||
| Fig. 1 Chemical structures of: (a) cobalt(II)/(III) tris(2,2′-bipyridine) complexes and (b) MK2. | ||
Results and discussion
The electrolytes developed for aqueous DSCs consisted of 0.20 M [Co(bpy)3]2+, 0.040 M [Co(bpy)3]3+, 0.70 M NMBI and various amounts of added polyethylene glycol (mainly PEG 300). The water-soluble, environmentally benign and low toxicity PEG derivatives19 were used in order to minimize phase separation between the hydrophobic dye (MK2, Fig. 1b) and water-based electrolyte. The dependence of the photovoltaic parameters on the amount of added PEG 300 is summarized in Table S1† and the I–V curves are shown in Fig. 2.![I–V curves of DSCs constructed with MK2 dye and tested under simulated AM1.5 solar irradiation (100 mW cm−2) for aqueous [Co(bpy)3]2+/3+ electrolyte systems containing varying amounts of PEG 300 in water.](/image/article/2013/EE/c2ee23317g/c2ee23317g-f2.gif) | ||
| Fig. 2 I–V curves of DSCs constructed with MK2 dye and tested under simulated AM1.5 solar irradiation (100 mW cm−2) for aqueous [Co(bpy)3]2+/3+ electrolyte systems containing varying amounts of PEG 300 in water. | ||
The addition of 1 wt% PEG 300 to the electrolyte resulted in a 14% increase in short circuit current (Jsc) which, together with a small increase in open circuit voltage (Voc), is responsible for the observed efficiency increase from 3.7% (no PEG 300) to 4.2%. The further addition of PEG 300 into the electrolyte leads to a gradual drop in both the open circuit voltage and short circuit current density. However, even electrolytes containing 12.5 wt% PEG 300 exhibit reasonable efficiencies (3.3%). Notably, when measured at 0.1 sun, similar device performances were observed regardless of the amount of added PEG 300 (η = 4.2–4.4%), suggesting that higher amounts of PEG 300 may be affecting charge transport through the electrolyte (see Table S1†). Interestingly, an increase in Voc observed on addition of 1% PEG 300 is followed by a gradual and systematic decrease for electrolytes containing more PEG 300 (Fig. 3a and b). Overall, the best energy conversion efficiency of 4.2% at 1 sun, achieved with 1 wt% added PEG 300, is the highest reported for DSCs constructed with an aqueous electrolyte. A variety of PEGs with different molecular weights were also studied but aqueous electrolytes with PEG 300 resulted in the best DSC performances (Table S2 and Fig. S1†).
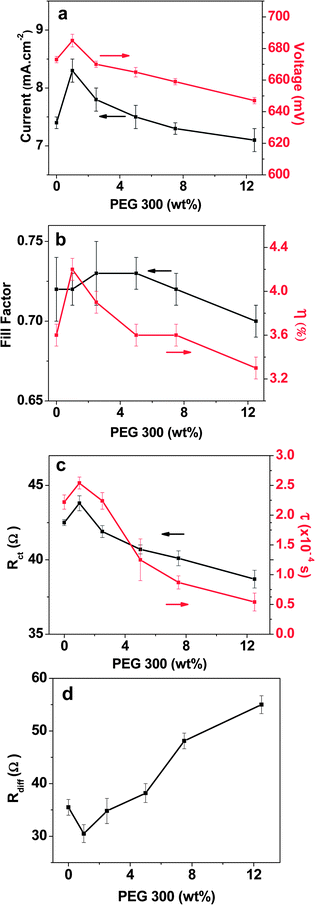 | ||
| Fig. 3 Dependence of DSC parameters on the PEG 300 concentration present in the aqueous electrolyte: (a) short circuit current (Jsc) and open circuit voltage (Voc); (b) fill factor (ff) and energy conversion efficiency (η); (c) charge transport resistance at the interface of TiO2 (Rct) and electron lifetime (τ) of DSCs; (d) charge carrier diffusion resistance (Rdiff). All the measurements were carried out under 100 mW cm−2 irradiation. The corresponding data can be found in Tables S1 and S3.† | ||
Incident photon-to-electron conversion efficiency (IPCE) measurements were conducted to further explore the origin of the variation in performance with different amounts of PEG 300 in the electrolyte. The devices demonstrate similar IPCE behavior and exhibit good light harvesting in the 400–600 nm range (Fig. 4). The IPCE data, obtained under monochromatic illumination conditions at low photon flux, compared to solar irradiation (∼1% sun), show a consistent improvement in IPCE upon addition of PEG 300, independent of the amount of added PEG 300. This is in accordance with the IV data obtained at 0.1 sun (Table S1†), which shows an increase in Jsc from 0.83 mA cm−2 to 0.97 mA cm−2 for all PEG 300 containing electrolytes. The observed improvement is probably due to the better interfacial contact between the aqueous electrolyte and TiO2 surface when PEG is added, which is supported by contact angle measurements (Fig. S2†). Again, the decrease in Jsc observed at full sun upon addition of >1 wt% PEG 300 points towards mass transport problems for these aqueous electrolytes, which, if addressed, could lead to higher efficiencies.
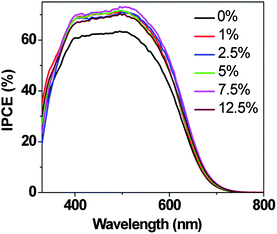 | ||
| Fig. 4 Incident photon-to-current conversion efficiencies (IPCEs) of DSCs corresponding to I–V curves shown in Fig. 2. | ||
The effect of adding different amounts of PEG 300 to the aqueous electrolytes on mass transport in the DSCs was further studied by monitoring photocurrent transients employing a modulation (on/off) of the incident light.20 One set of data is shown in Fig. 5. If there are no mass transport problems, when the light is switched on the photocurrent should rapidly reach a maximum and remain constant thereafter. In our case, however, the peak photocurrent decreased with time and reached a constant value after a few seconds (see Fig. 5a for a typical dataset). As the amount of PEG 300 is increased, the steady state photocurrent gradually decreases, indicating PEG 300 retards the charge carrier transport in the electrolyte and limits the photocurrent generation, as discussed above. At lower light intensities, mass transport is no longer a problem and no current spike is observed (Fig. 5b).
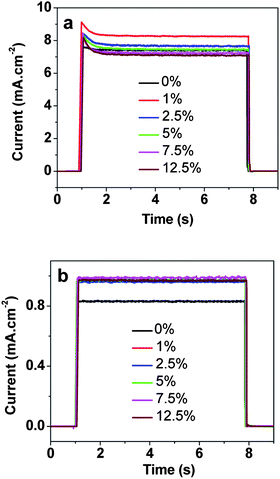 | ||
| Fig. 5 Plots of current transients measured at illumination intensities of: (a) 100 mW cm−2; (b) 10 mW cm−2 for DSCs constructed with electrolytes containing different amounts of PEG 300. The solar cells were illuminated for 7 s, starting at t = 1 s. | ||
Electrochemical impedance spectroscopy (EIS) was used to investigate the effect of PEG 300 content in the electrolyte on the interfacial charge transport and redox species diffusion property. The results, measured under 100 mW cm−2 illumination, are summarized in Fig. S5.† Usually, the impedance spectra have three semicircles, which represent the charge transport resistance between the counter electrode and electrolyte, the electron recombination resistance at the interface of TiO2 and the electrolyte (Rct), and the Warburg diffusion within the electrolyte (Rdiff) from high frequency to low frequency.21 In our case, the first semicircle merges into the second. An equivalent circuit represented in Fig. S5† was used to fit the impedance spectra with ZView software. The data are listed in Table S3† and depicted in Fig. 3c. The charge transport resistance increases up to 1 wt% PEG 300 and decreases thereafter, indicating that electron recombination is not further suppressed by adding more PEG 300. The retardation of recombination is also reflected in the electron lifetimes from EIS measurements (Fig. 3c), which show a similar trend. Electron lifetimes were determined by reading the mid-frequency peak in the Bode curves obtained from EIS and applying the equation, τ = 1/2πf.22 Notably, the change in the diffusion resistance of the redox species in the electrolyte upon addition of PEG 300 also identifies mass transport as a significant problem for these electrolytes, as discussed above.
Thermally deposited platinum on fluorine doped tin oxide (FTO) glass is conventionally used as counter electrode for DSCs. However, relatively large semicircles were found at high frequencies in the EIS (Fig. S8†) for symmetric cells constructed using platinized counter electrodes, which indicated a high charge transport resistance between the aqueous electrolyte and counter electrode. Therefore, we investigated a more efficient counter electrode material prepared by screen-printing mesoporous indium tin oxide (ITO) films onto FTO glass. An ITO paste was prepared by mixing a colloidal ITO nanoparticle solution with ethyl cellulose and terpineol and used to print ITO films with thicknesses ranging from 0 μm to 14.8 μm. A gradual increase in the device efficiencies was observed as the ITO film thickness is increased up to 13.5 μm (Fig. 6a). The device fabricated with 13.5 μm ITO coated with thermally deposited platinum as a counter electrode showed an unprecedented efficiency of 5.0% under one sun illumination (Table 1), comparable with the performance (5.5%) published for a device made from the same dye and redox couple but using an organic solvent.23 Measurement of the same device after two days gave a slightly higher efficiency of 5.1%. The I–V curves of DSCs based on platinum and ITO/platinum counter electrodes are shown in Fig. S6.† An increase in Jsc of 16% is mainly responsible for the significant improvement in efficiency when ITO/Pt counter electrodes are used. Further increase of the ITO thickness may cause longer electron diffusion length from the FTO conductive substrate to the electrolyte and as a result, a lower ff can be observed, which, together with a low Jsc, cause a drop in energy conversion efficiency of the devices. Exploratory experiments were carried out in which the C106 and Z907 ruthenium dyes were used as sensitisers in DSC fabrication. Although the efficiencies were ≤3.7% (Table S4†), scope exists for the further development of aqueous DSCs based on such metal-based dyes.
![(a) Charge transport resistance at the interface between the aqueous electrolyte and counter electrode (Rct) and device efficiencies of DSCs for aqueous electrolytes with different counter electrodes measured under 100 mW cm−2 irradiation; (b) cyclic voltammograms of the [Co(bpy)3]2+/3+ redox couple in water containing KCl (0.10 M) (potential vs. Ag/AgCl) with different counter electrodes.](/image/article/2013/EE/c2ee23317g/c2ee23317g-f6.gif) | ||
| Fig. 6 (a) Charge transport resistance at the interface between the aqueous electrolyte and counter electrode (Rct) and device efficiencies of DSCs for aqueous electrolytes with different counter electrodes measured under 100 mW cm−2 irradiation; (b) cyclic voltammograms of the [Co(bpy)3]2+/3+ redox couple in water containing KCl (0.10 M) (potential vs. Ag/AgCl) with different counter electrodes. | ||
| Counter electrode | V oc (mV) | J sc (mA cm−2) | ff | η (%) |
|---|---|---|---|---|
| a The performance parameters are averaged from the test results obtained for at least three devices. | ||||
| 0 μm ITO/Pt | 687 ± 2 | 8.5 ± 0.1 | 0.70 ± 0.01 | 4.1 ± 0.1 |
| 3.2 μm ITO/Pt | 687 ± 3 | 8.8 ± 0.1 | 0.75 ± 0.01 | 4.6 ± 0.1 |
| 6.3 μm ITO/Pt | 690 ± 1 | 9.1 ± 0.1 | 0.74 ± 0.01 | 4.7 ± 0.1 |
| 9.6 μm ITO/Pt | 687 ± 2 | 9.3 ± 0.1 | 0.75 ± 0.01 | 4.8 ± 0.1 |
| 13.5 μm ITO/Pt | 687 ± 2 | 9.8 ± 0.1 | 0.74 ± 0.01 | 5.0 ± 0.1 |
| 14.8 μm ITO/Pt | 686 ± 1 | 9.5 ± 0.1 | 0.72 ± 0.01 | 4.7 ± 0.1 |
In order to compare the charge transport resistance at the interface between the electrolyte and different counter electrodes, symmetric cells were fabricated with a structure of CE/electrolyte/CE. All the devices were measured with 0 V bias voltage with a frequency range from 500 kHz to 10 mHz (Fig. S8†). The Nyquist plots consist of two semicircles, which are ascribed to the impedance of the CE/electrolyte interface and the Warburg diffusion impedance from high frequency to low frequency. An obvious reduction of interface resistance was observed when platinum counter electrodes (Rct = 7.2 Ω) are compared with ITO/Pt electrodes. As the ITO film thickness is increased (Fig. 6a), the charge transport resistance is further reduced to about 1.6 Ω for 13.5 μm ITO/Pt electrodes. This indicates that the reduction of oxidized species in aqueous electrolyte is more favorable at ITO/Pt counter electrodes compared with their platinum counterpart.
The essential difference between platinum and ITO/Pt with different thicknesses was further studied by cyclic voltammetry (Fig. 6b). A solution of 20 mM [Co(bpy)3]2+ and 4 mM [Co(bpy)3]3+ with 0.1 M KCl in water was used as the electrolyte and the CV measured at a scan rate of 20 mV s−1. ITO/Pt or Pt coated FTO glass was used as the working electrode with platinum wire and Ag/AgCl as the counter and reference electrode, respectively. As is shown in Fig. 6b, the current produced by the ITO/Pt coated films increases with film thickness, and becomes much higher than that recorded for the Pt coated FTO electrode. For the 13.5 μm ITO/Pt film the exchange current is almost double that for the platinum electrode indicating improved electron transfer to the oxidized redox couple. This suggests that the high surface area ITO mesoporous film enables a higher platinum loading and facilitates the reduction of oxidized species at the counter electrode surface.
The stability of the devices was investigated as in previous studies with organic solvent based electrolytes where water ingress was observed to result in device instability and deteriorating performance over time.14,15 The variation in the performance of a typical cobalt aqueous electrolyte based DSC (constructed with 1 wt% PEG 300 in the electrolyte, initial η = 4.0%) was measured under white LED light illumination corresponding to one sun. For comparison, aqueous DSCs based on the [Fe(CN)6]4−/3− redox couple were also fabricated with identical electrolyte additives. The two groups of the devices performed quite differently under illumination (Fig. 7a). The photovoltaic parameters indicate that the [Co(bpy)3]2+/3+-based devices are more stable under illumination than hexacyanoferrate(II)/(III)-based DSCs whose efficiencies drop by more than 50% within the first 10 minutes of illumination. As noted previously, this is due to the photo-instability of [Fe(CN)6]4−/3− on TiO2 under UV and near UV illumination.17 The cobalt aqueous electrolyte based devices were also stored in the dark over a period of 90 days and tested periodically (Fig. 7b). The data show an initial decrease in Voc and ff followed by a significant increase whereas the Jsc values are initially constant and then gradually decrease. Most importantly, the overall device efficiency decreases by only 10% over the initial 30 days of testing and then remains relatively constant over the following 60 days. To the best of our knowledge, these are the most stable aqueous electrolyte based DSCs reported to date.
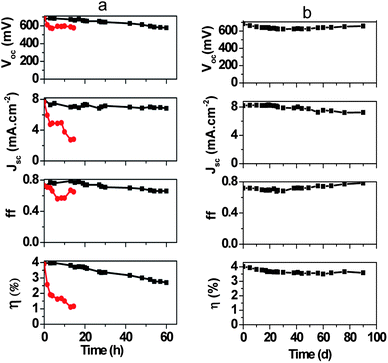 | ||
| Fig. 7 Stability testing of aqueous dye-sensitized solar cells (a) under 100 mW cm−2 white LED illumination; (b) in the dark (black: cobalt-based device, red: hexacyanoferrate-based device). | ||
Conclusion
We have developed an aqueous electrolyte based on the [Co(bpy)3]2+/3+ redox couple and have evaluated the performance of DSCs constructed using this electrolyte in conjunction with a donor–π–acceptor dye. Device efficiencies of 3.7% have been achieved which could be significantly improved by the introduction of small amounts of polyethylene glycol to the electrolyte solution. Addition of 1 wt% PEG 300 resulted in device efficiencies of 4.2% under simulated AM1.5 solar irradiation, which arise from an increase in short circuit current. Further addition of the PEG derivative was found to result in poorer device performance whose origin was attributed to mass transport limitations based on IPCE, current transients and impedance spectroscopy measurements. To address these limitations, improvements of the nanostructured semiconductor films should be pursued in the future. By replacing platinum counter electrodes with ITO/Pt counter electrodes, a device efficiency of 5.1% was realized. To the best of our knowledge, this is the highest reported efficiency for an aqueous electrolyte based DSC. Moreover, we show that devices can be constructed using Ru-dyes pointing to the possibility of applying a variety of metal-based dyes in conjunction with cobalt redox mediators in aqueous DSCs. Finally, the cobalt(II)/(III) electrolyte based devices exhibit excellent stability on storage for 90 days. Under one sun illumination, the cobalt based DSCs are much more stable than the hexacyanoferrate(II)/(III)-based devices. The stability of DSCs based on cobalt aqueous electrolytes, as well as cobalt electrolytes based on organic solvents, is an area worthy of in depth investigation in the future.Experimental
Materials and reagents
The solvents used for reactions were obtained from Merck Specialty Chemicals (Sydney, Australia) and were used as such. All the reagents and chemicals, unless otherwise specified, were purchased from Sigma-Aldrich. C106 {sodium cis-di(thiocyanato)-(4,4′-bis(5-(hexylthio)thiophen-2-yl)-2,2′-bipyridine)(4-carboxylic acid-4′-carboxylate-2,2′-bipyridine)ruthenium(II)} and Z907 {cis-di(thiocyanato)-(2,2′-bipyridyl-4,4′-dicarboxylic acid)(4,4′-dinonyl-2,2′-bipyridyl)ruthenium(II)} were purchased from Organic Feinchemie GmbH Wolfen, Germany and Dyesol, Australia, respectively. The TiO2 paste was purchased from JGC Catalysts and Chemicals Ltd.Synthesis of cobalt complexes
The [Co(bpy)3](NO3)2 complex was synthesized with slight modifications to a literature method.24 One equivalent of Co(NO3)2·6H2O was dissolved in a minimum amount of deionized water and 3.3 equivalents of 2,2′-bipyridine dissolved in methanol were added dropwise. The solution was stirred at room temperature for 1 h and was evaporated to remove the solvents. The product was rinsed with methanol and diethylether and dried under vacuum for 24 h. Oxidation of the Co(II) complex was performed by adding a slight excess of AgNO3 to an acetonitrile solution of the complex. After stirring at room temperature for 2 h, the Ag particles were filtered and the solvent was removed by rotary evaporation. The product was washed with methanol and dried under vacuum for 24 h. These two compounds were used without further purification.Preparation of ITO/Pt counter electrodes
ITO/Pt counter electrodes were made as follows. ITO paste was prepared by mixing 15 g of ITO dispersion (<100 nm (DLS), 30 wt% in isopropanol) with 25 mL of 10 wt% ethyl cellulose in ethanol and 20 mL of terpineol. After a completely homogeneous mixture was formed, the ethanol was removed on a rotary evaporator. ITO films with different thicknesses were then prepared by screen-printing on top of conductive FTO glass. Sintering at 500 °C was applied after printing. A hole was then drilled at one corner of the ITO-coated substrate. A solution of chloroplatinic acid hexahydrate (10 mM) in ethanol was doctor bladed on top of the pre-drilled ITO film and pyrolyzed for 15 min at 400 °C.Device fabrication
N-Methylbenzimidazole (NMBI) and polyethylene glycol (molecular weight: 200, 300, 600, 1000, 1500, 3000, 4000, Fluka) were purchased from commercial suppliers in high purity and used as received. [Co(bpy)3](NO3)2, [Co(bpy)3](NO3)3, NMBI and varying amounts of PEGs were mixed in deionized water. The mixture was heated at 60 °C for 1–2 min to completely dissolve the [Co(bpy)3](NO3)2 compound and then cooled down to room temperature for cell assembly. Working electrodes consisting of a 1 μm thick transparent TiO2 (anatase) layer (30 nm particle size) and a 3 μm thick TiO2 (anatase) scattering layer (400 nm particle size) dyed with MK2, and a platinized FTO counter electrode. Prior to IV characterization, the devices were soaked under one sun illumination at 60 °C for 40 min.Electrochemical impedance spectroscopy
Electrochemical impedance spectroscopy (EIS) measurements on the complete DSCs were made on a potentiostat (BioLogic VSP) with a frequency range of 0.5–105 Hz. The magnitude of the alternative signal was 10 mV. The EIS measurements were carried out under AM 1.5 solar radiation. Symmetric cells were fabricated with a structure of CE/electrolyte/CE system by 7 × 7 mm ITO/Pt counter electrodes and a 65 μm thick Surlyn gasket (Solaronix) of the dimensions 8 × 8 mm. The devices were measured with 0 V bias voltage with a frequency range from 500 kHz to 10 mHz.Cyclic voltammetry
CV measurements were made using a three-electrode electrochemical set-up which had a glass carbon working electrode, a platinum wire as the counter electrode and an Ag/AgCl reference electrode (0.20 V vs. normal hydrogen electrode). The aqueous electrolyte solution contained 0.10 M potassium chloride, 0.20 M [Co(bpy)3](NO3)2, 0.040 M [Co(bpy)3](NO3)3 in water. For the CV measurements of different counter electrodes, ITO/Pt or Pt was used as the working electrode instead of glassy carbon working electrode.Contact angle
Contact angles were measured on a DataPhysics Optical Contact Angle 15 plus instrument from Particle and Surface Sciences Pty Ltd. SCA20 software was used to record and analyse the data. All samples were measured ten times and the data averaged.Transient currents
Transient currents were measured under a solar simulator by EC lab software. The light intensity was adjusted by using a filter wheel equipped with a series of mesh filters. At each light intensity, the transient current was measured three times in order to obtain a stable current response. An on/off ratio of illumination at 2 was fixed, which means that the cells were illuminated for 7 seconds following a 3.5 second period without illumination.IV and IPCE
Methods for IV and IPCE measurements can be found elsewhere.25Stability
For the stability testing, one of the best performing cobalt aqueous electrolyte based devices was chosen. It was constructed with an electrolyte containing 0.20 M [Co(bpy)3](NO3)2, 0.040 M [Co(bpy)3](NO3)3, 0.70 M NMBI and 1 wt% PEG 300 in water and a Pt counter electrode. For hexacyanoferrate(II)/(III)-based device, an electrolyte containing 0.20 M K4Fe(CN)6, 0.040 M K3Fe(CN)6, 0.70 M NMBI and 1 wt% PEG 300 in water was used. A cool white LED (Luxeon Star LEDs, part no. 263, spectrum profile between 400 nm and 750 nm) equipped with a polymer optics 7 cell cluster concentrator lens was used as the light source. The illumination area was calibrated to 1 sun intensity by changing the position of the samples. Prior to light soaking the devices were characterized under AM1.5 simulated sun light. Afterwards, each device was exposed to white LED. The devices were measured after a certain amount of time under AM1.5 simulated sun light. Cobalt aqueous electrolyte based devices stored in the dark with the exact the same component underwent measurement by characterization under AM1.5 simulated sun light at intervals.Acknowledgements
The authors acknowledge the Australian Research Council for providing equipment and fellowship support and the Australian Solar Institute, the Victorian State Government (DBI-VSA and DPI-ETIS) for financial support. The Commonwealth Scientific and Industrial Research Organization is acknowledged for providing support through an OCE Science Leader position (UB). We would also like to thank Ms Monika Fekete for providing the recipe for the ITO paste.Notes and references
- B. O'Regan and M. Grätzel, Nature, 1991, 353, 737 CrossRef CAS
.
- A. Hagfeldt, G. Boschloo, L. C. Sun, L. Kloo and H. Pettersson, Chem. Rev., 2010, 110, 6595 CrossRef CAS
.
- P. V. Kamat, K. Tvrdy, D. R. Baker and J. G. Radich, Chem. Rev., 2010, 110, 6664 CrossRef CAS
.
- T. Daeneke, T. H. Kwon, A. B. Holmes, N. W. Duffy, U. Bach and L. Spiccia, Nat. Chem., 2011, 3, 211 CrossRef CAS
.
- T. Miyasaka and Y. Kijitori, J. Electrochem. Soc., 2004, 151, A1767 CrossRef CAS
.
- H. Wang and Y. H. Hu, Energy Environ. Sci., 2012, 5, 8182 CAS
.
- E. M. J. Johansson, P. G. Karlsson, M. Hedlund, D. Ryan, H. Siegbahn and H. Rensmo, Chem. Mater., 2007, 19, 2071 CrossRef CAS
.
- G. Calogero, P. Calandra, A. Irrera, A. Sinopoli, I. Citro and G. Di Marco, Energy Environ. Sci., 2011, 4, 1838 CAS
.
- A. Yella, H. W. Lee, H. N. Tsao, C. Yi, A. K. Chandiran, M. K. Nazeeruddin, E. W. G. Diau, C. Y. Yeh, S. M. Zakeeruddin and M. Grätzel, Science, 2011, 334, 629 CrossRef CAS
.
- D. F. Zhou, Q. J. Yu, N. Cai, Y. Bai, Y. H. Wang and P. Wang, Energy Environ. Sci., 2011, 4, 2030 CAS
.
- D. B. Kuang, P. Walter, F. Nüesch, S. Kim, J. J. Ko, P. Comte, S. M. Zakeeruddin, M. K. Nazeeruddin and M. Grätzel, Langmuir, 2007, 23, 10906 CrossRef CAS
.
- P. Wang, Q. Dai, S. M. Zakeeruddin, M. Forsyth, D. R. MacFarlane and M. Grätzel, J. Am. Chem. Soc., 2004, 126, 13590 CrossRef CAS
.
- U. B. Cappel, E. A. Gibson, A. Hagfeldt and G. Boschloo, J. Phys. Chem. C, 2009, 113, 6275 CAS
.
- H. L. Lu, T. F. Shen, S. T. Huang, Y. L. Tung and T. C. Yang, Sol. Energy Mater. Sol. Cells, 2011, 95, 1624 CrossRef CAS
.
- Y. Liu, A. Hagfeldt, X. R. Xiao and S. E. Lindquist, Sol. Energy Mater. Sol. Cells, 1998, 55, 267 CrossRef CAS
.
- C. H. Law, S. C. Pathirana, X. Li, A. Y. Anderson, P. R. Barnes, A. Listorti, T. H. Ghaddar and B. C. O'Regan, Adv. Mater., 2010, 22, 4505 CrossRef CAS
.
- T. Daeneke, Y. Uemura, N. W. Duffy, A. J. Mozer, N. Koumura, U. Bach and L. Spiccia, Adv. Mater., 2012, 24, 1222 CrossRef CAS
.
- B. Macht, M. Turrion, A. Barkschat, P. Salvador, K. Ellmer and H. Tributsch, Sol. Energy Mater. Sol. Cells, 2002, 73, 163 CrossRef CAS
.
- J. Y. Lee, B. Bhattacharya, D. W. Kim and J. K. Park, J. Phys. Chem. C, 2008, 112, 12576 CAS
.
- J. J. Nelson, T. J. Amick and C. M. Elliott, J. Phys. Chem. C, 2008, 112, 18255 CAS
.
- Z. Zhang, S. M. Zakeeruddin, B. C. O'Regan, R. Humphry-Baker and M. Grätzel, J. Phys. Chem. B, 2005, 109, 21818 CrossRef CAS
.
- R. Kern, R. Sastrawan, J. Ferber, R. Stangl and J. Luther, Electrochim. Acta, 2002, 47, 4213 CrossRef CAS
.
- H. S. Kim, S. B. Ko, I. H. Jang and N. G. Park, Chem. Commun., 2011, 12637 RSC
.
- Y. R. Liu, J. R. Jennings, Y. Huang, Q. Wang, S. M. Zakeeruddin and M. Grätzel, J. Phys. Chem. C, 2011, 115, 18847 CAS
.
- T. Daeneke, A. Mozer, T. H. Kwon, N. Duffy, A. B. Holmes, U. Bach and L. Spiccia, Energy Environ. Sci., 2012, 5, 7090 CAS
.
Footnote |
| † Electronic supplementary information (ESI) available: CV measurement, contact angle measurement, photovoltaic properties of DSCs based on different PEGs in electrolytes. IPCE and IV curves of DSCs with different counter electrodes. See DOI: 10.1039/c2ee23317g |
| This journal is © The Royal Society of Chemistry 2013 |
