Nitrogen removal with energy recovery through N2O decomposition†
Yaniv D.
Scherson
*ae,
George F.
Wells
b,
Sung-Geun
Woo
d,
Jangho
Lee
d,
Joonhong
Park
d,
Brian J.
Cantwell
c and
Craig S.
Criddle
be
aDepartment of Mechanical Engineering, Stanford University, Stanford, California 94305-4020, USA. E-mail: yaniv@stanford.edu
bDepartment of Civil and Environmental Engineering, Stanford University, Stanford, California 94305-4020, USA
cDepartment of Aeronautics and Astronautics, Stanford University, Stanford, California 94305-4020, USA
dDepartment of Civil and Environmental Engineering, Yonsei University, Seoul, Korea
eNSF Engineering Research Center ReNUWIt, Department of Civil and Environmental Engineering, Stanford University, Stanford, California 94305-4020, USA
First published on 6th November 2012
Abstract
A new process for the removal of nitrogen from wastewater is introduced. The process involves three steps: (1) partial nitrification of NH4+ to NO2−; (2) partial anoxic reduction of NO2− to N2O; and (3) N2O conversion to N2 with energy recovery by either catalytic decomposition to N2 and O2 or use of N2O to oxidize biogas CH4. Steps 1 and 3 have been previously established at full-scale. Accordingly, bench-scale experiments focused on step 2. Two strategies were evaluated and found to be effective: in the first, Fe(II) was used to abiotically reduce NO2− to N2O; in the second, COD stored as polyhydroxybutyrate (PHB) was used as the electron donor for partial heterotrophic reduction of NO2− to N2O. For abiotic reduction with Fe(II), the efficiency of conversion of NO2− to N2O was over 90% with 98% nitrogen removal from water. For partial heterotrophic denitrification, different selection conditions were imposed on acetate- and nitrite-fed communities initially derived from waste activated sludge. No N2O was detected when acetate and nitrite were supplied continuously, but N2O was produced when acetate and nitrite were added as pulses. N2O conversion efficiency was dependent upon the method of addition of acetate and nitrite. When acetate and nitrite were added together (coupled feeding), the N2O conversion efficiency was 9–12%, but when acetate and nitrite additions were decoupled, the N2O conversion efficiency was 60–65%. Decoupled substrate addition selected for a microbial community that accumulated polyhydroxybutyrate (PHB) during an anaerobic period after acetate addition then consumed PHB and reduced NO2− during the subsequent anoxic period. The biological N removal efficiency from the water was 98% over more than 200 cycles. This indicates that decoupled operation can sustain significant long-term N2O production. Compared to conventional nitrogen removal, the three-step process, referred to here as Coupled Aerobic–anoxic Nitrous Decomposition Operation (CANDO), is expected to decrease oxygen requirements, decrease biomass production, increase organic matter available for recovery as biogas methane, and enable energy recovery from nitrogen, but pilot-scale studies are needed.
Broader contextThe release of reactive forms of nitrogen is a major environmental threat causing hypoxia and eutrophic zones in water bodies. Globally, rising energy costs and increasingly stringent discharge regulation are major drivers for efficient wastewater treatment processes that lower costs and increase recoverable energy from waste. While many processes recover energy from carbon waste as CH4, none recovers energy from waste nitrogen. This work introduces a new wastewater treatment process that removes and recovers energy from nitrogen waste by exploiting the thermodynamic properties of N2O for energy recovery. The proposed process, referred to here as Coupled Aerobic–anoxic Nitrous Decomposition Operation (CANDO), involves three steps: (1) partial aerobic nitrification of NH4+ to NO2−, (2) partial anoxic denitrification of NO2− to N2O, and (3) N2O conversion to N2 with energy recovery via catalytic decomposition of N2O or use of N2O as an oxidant in CH4 combustion. If successfully scaled-up, this process has the potential to lower aeration and biosolid production (the two major operational costs), increase CH4 recovery from “freed” organic matter, and introduces a new renewable energy source from CH4 combustion with N2O. |
Introduction
A major goal of biological wastewater treatment is removal of oxygen-depleting forms of carbon and nitrogen from water. These substances are routinely quantified in terms of the mass of oxygen required for complete oxidation. Organic compounds are collectively quantified as Chemical Oxygen Demand (COD); the mass of oxygen required for stoichiometric oxidation of the organics to CO2. Reduced, oxygen-depleting forms of nitrogen (ammonia, organic nitrogen, and nitrite) are likewise quantified as Nitrogenous Oxygen Demand (NOD); the mass of oxygen needed for their stoichiometric oxidation to nitrate. Theoretical Oxygen Demand (ThOD) is the sum of COD and NOD. Many processes efficiently remove ThOD, but these processes differ dramatically in production and consumption of energy and in production of biosolids. The use of aerobic processes to remove biodegradable COD (i.e., BOD), for example, requires energy-intensive O2 delivery and generates large quantities of biomass, but anaerobic processes remove COD as CH4 for energy production and generate comparatively little biomass.The situation with NOD is more complex. Conventionally, NOD is removed by nitrification, a two-step microbial process involving (1) oxidation of NH4+ to NO2− and (2) oxidation of NO2− to NO3−. Each step requires energy for O2 delivery, and the NO3− produced can still fertilize a sensitive water body or pose human health risks. Removal of NO3− is typically accomplished through heterotrophic denitrification, a four-step process that can be fully intracellular within a single type of microorganism or partially intracellular, with different organisms mediating different steps. The steps of complete denitrification are: (1) NO3− reduction to NO2−, (2) NO2− reduction to NO, (3) NO reduction to N2O, and (4) N2O reduction to N2. For heterotrophic denitrification, each step requires reducing power obtained from the oxidation of COD that could otherwise be recovered as CH4. If reduction to N2 is incomplete, N2O, a potent greenhouse gas (310 times more powerful than CO2) can be released to the atmosphere.1,2 Such concerns have motivated research to quantify N2O emissions from soil, seawater, and wastewater treatment systems, and to elucidate the underlying mechanisms.2–4
Over the past two decades, European researchers have vastly improved treatment options for nitrogen removal using ecological “short-circuits” that avoid NO3− production. Examples include SHARON,5–8 OLAND,7,9–11 and CANON7,12–17 with Anammox. In these processes, NH4+ is only partially oxidized to NO2−, decreasing O2 requirements, and NO2− is reduced to N2 in three steps, rather than four, conserving COD for energy recovery as CH4. Especially noteworthy was the discovery of anaerobic ammonium oxidation (Anammox) bacteria18 and their successful deployment in full-scale wastewater treatment facilities.12,19 Anammox bacteria obtain reducing equivalents for reduction of NO2− to N2 from the oxidation of NH4+ rather than COD, with hydrazine (N2H4) as a critical intermediate. By avoiding the use of COD as the source of reducing equivalents, more COD is available for recovery as CH4. Treatment of anaerobic digester centrate with Anammox has the potential to decrease energy consumption of a full-scale plant by >50% and increase CH4 production by up to 25%.13
Many processes recover energy from waste COD as methane, but none recovers energy from NOD. In this article, we introduce a new nitrogen removal strategy that exploits the thermodynamic properties of N2O for energy recovery. The proposed process, referred to here as Coupled Aerobic–anoxic Nitrous Decomposition Operation (CANDO),20,21 involves three steps: (1) partial aerobic nitrification of NH4+ to NO2−, (2) partial anoxic denitrification of NO2− to N2O, and (3) N2O conversion to N2 with energy recovery via catalytic decomposition of N2O or use of N2O as an oxidant of CH4.
N2O has a positive enthalpy of formation, releasing 82 kJ mole−1 when decomposed (eqn (1)). Thermal decomposition of N2O occurs at approximately 850 °C, but the presence of a transition metal oxide catalyst can enable self-sustaining decomposition and net energy production at decomposition temperatures as low as 300 °C.22–27 The energy released by decomposition of 1.0 mole of N2O is approximately equivalent to the energy released by combustion of 0.1 mole of CH4.
Eqn (1) . Decomposition of N2O.
| N2O → ½O2 + N2, ΔĤ°R = −82 kJ mol−1 | (1) |
N2O can also act as a powerful oxidant in combustion reactions. It is commonly used to supercharge the engines of high performance vehicles (i.e. “Nitrox”) and as an oxidant in hybrid rocket motors in the aerospace industry. When used to oxidize methane, N2O increases the heat of reaction by −329 kJ mol−1 as compared to O2 (eqn (2)).
Eqn (2) . Comparison of the heat of reactions of CH4 with N2O (top) and CH4 with O2 (bottom).
| CH4 + 4N2O → CO2 + 2H2O(l) + 4N2, ΔĤ°R = −1219 kJ mol−1 | (2A) |
| CH4 + 2O2 → CO2 + 2H2O(l), ΔĤ°R = −890 kJ mol−1 | (2B) |
Steps 1 and 3 in CANDO have been demonstrated at full-scale. Step 1 is achieved with the SHARON process: partial oxidation of NH4+ to NO2− (Step 1).6 In our bench-scale studies, an enrichment of ammonia oxidizing bacteria (AOB) converted 80% of the incoming ammonia (2 g N L−1) to NO2−, consistent with 80–85% conversion previously reported for a lab-scale SHARON process.5 Full-scale SHARON processes have reported over 95% nitrogen removal efficiency.28,29 The decomposition of N2O and the use of N2O for hydrocarbon combustion (Step 3) are also well-documented.23,30,31 In earlier studies, we demonstrated that the decomposition reaction of eqn (1) occurs at N2O flow rates comparable to those expected for a medium sized wastewater treatment facility (∼20 MGD).32,33 Accordingly, the focus of this study is step 2: partial reduction of NO2− to N2O. Two strategies were investigated and documented below.
The first strategy builds on geochemical studies of NO2− reactivity with Fe(II). In carbonate buffered systems at pH = 6–8, Fe(II) precipitates with Fe(III) and carbonate to form carbonate “green rust” (FeII4FeIII2(OH)12CO3). It also precipitates with carbonate alone to form siderite (FeCO3). Fe(II) in the form of green rust or siderite reduces NO2− mainly to N2O, as does Fe(II) absorbed to Fe (hydr)oxide precipitates.34–42
As shown in Fig. 1, reduction of NO2− to N2O by carbonate green rust and siderite is thermodynamically favorable over a broad pH range, for conditions that are similar to those of partially oxidized anaerobic digester centrate. The key reactions are:
| 4FeCO3 (siderite) + 2NO2− + 5H2O → 4γ-FeOOH + 2H+ + N2O + 4HCO3− |
| FeII4FeIII2(OH)12CO3 (carbonate green rust) + 2NO2− + H+→ 6γ-FeOOH + HCO3− + N2O + 3H2O |
![Redox potential diagram (Ehvs. pH) for reduction of NO2− to N2O coupled to the oxidation of Fe(ii) in siderite and carbonate green rust. Assumed conditions are similar to partially oxidized anaerobic digester centrate: [NO2−] = 35 mM, [N2O] = 22 mM, [HCO3−] = 40 mM. The sources of thermodynamic data were obtained from Rittmann and McCarty for aqueous solutes,43 see ref. 44 for siderite and ref. 45 for carbonate green rust.](/image/article/2013/EE/c2ee22487a/c2ee22487a-f1.gif) | ||
| Fig. 1 Redox potential diagram (Ehvs. pH) for reduction of NO2− to N2O coupled to the oxidation of Fe(II) in siderite and carbonate green rust. Assumed conditions are similar to partially oxidized anaerobic digester centrate: [NO2−] = 35 mM, [N2O] = 22 mM, [HCO3−] = 40 mM. The sources of thermodynamic data were obtained from Rittmann and McCarty for aqueous solutes,43 see ref. 44 for siderite and ref. 45 for carbonate green rust. | ||
The second strategy is based on a review of factors previously implicated in N2O production by denitrifying heterotrophs: (1) low COD/N,2,3,46–48 (2) high nitrite levels,2,3,47,49–56 (3) transient feeding regimes (i.e. feast and famine),3,47,48,51,52,54,57,58 (4) low pH (i.e. high concentration of free nitrous acid),59 and (5) low dissolved oxygen.2,3,53,55,58,60,61 In general, more extensive conversion to N2O was associated with: (1) limited availability of COD;2,3,46,47 (2) oxidation of endogenous COD in pulse fed systems;48,51,52,56 or (3) inhibition of N2O reduction at high NO2− levels.2,3,47,50,51,53–55 Influent nitrogen was converted to N2O with conversion efficiencies of >90%,56 77%,51 and 32–64%.48 The highest reported percent conversion (>90%56) occurred in batch studies in which the investigators supplied a single pulse of NO2−. Comparing results across studies is difficult because the conversion percentages were not replicated over many cycles, and the microorganisms used were obtained from parent reactors operated under different selection conditions (i.e. aerobic/anaerobic SBRs with denitrification from NO3− and steady state addition of carbon/nitrite feed). In the study reporting 32–64% conversion, adaptation occurred in some cultures, with a decrease in N2O production after 10 cycles, presumably with a corresponding increase in N2 production. One culture with a different operational history reportedly retained a high level of N2O production, but no data were provided. We know of no bioreactor studies documenting sustained N2O production at high levels in long-term operation.
To identify conditions favorable for sustained generation of N2O, experiments were carried out with acetate as the electron donor, nitrite as the electron acceptor, and activated sludge as the source of microorganisms. Acetate was added at 703 mg L−1 (750 mg L−1 as COD) and nitrite-N was added at 500 mg L−1 to give a COD![[thin space (1/6-em)]](https://www.rsc.org/images/entities/char_2009.gif) :
:![[thin space (1/6-em)]](https://www.rsc.org/images/entities/char_2009.gif) N ratio of 1.5. In a preliminary experiment, N2O production was negligible when acetate and nitrite were simultaneously fed to an enrichment initiated from activated sludge (data not shown). Two cyclical pulse feeding strategies were evaluated: in the first, addition of acetate and nitrite was “coupled”, i.e., both substrates were added simultaneously as a single pulse at the beginning of each cycle; in the second, acetate and nitrite were added as separated pulses.
N ratio of 1.5. In a preliminary experiment, N2O production was negligible when acetate and nitrite were simultaneously fed to an enrichment initiated from activated sludge (data not shown). Two cyclical pulse feeding strategies were evaluated: in the first, addition of acetate and nitrite was “coupled”, i.e., both substrates were added simultaneously as a single pulse at the beginning of each cycle; in the second, acetate and nitrite were added as separated pulses.
The following sections provide a laboratory evaluation of the abiotic (reaction of NO2− with Fe(II)) and biotic (alternating acetate/NO2− pulsed-feeding) strategies, an assessment of the theoretical potential of CANDO for energy recovery, and possible treatment trains for further evaluation in the lab and field.
Materials and methods
Fe(II) reactor for abiotic N2O production
Carbonate green rust was evaluated for reduction of NO2− to N2O in a one-liter well-mixed vessel. Green rust (0.4 M) was prepared by combining solutions of FeCl2 and FeCl3, titrated to pH 8 with Na2CO3 prior to mixing, as described previously.62 20 mL of sodium nitrite stock solution (1.4 M) was pulsed at the beginning of the test to give an initial NO2− concentration of 28 mM N, ∼400 mg L−1 N. Automatic addition of 0.1 M HCl and 0.1 M NaOH solutions maintained pH = 7. He carrier gas supplied at 250 mL min−1 was used to sweep gas phase products. The gas stream was automatically sampled every 5 minutes for analysis on a Varian 3400 Gas Chromatograph equipped with a 6-foot Porapak Q column (T = 80 °C), 6-foot 5 Å molecular sieve column, and thermal conductivity detector (T = 90 °C). A three-point external calibration curve was prepared with serial dilutions of a gas standard containing 500 ppm N2O and 500 ppm N2 (Scott Specialty Gases). NO2− was measured colorimetrically (Hach Company, TNT840 test vials).Bioreactor operation and strategies for N2O production
A two-liter continuous flow bioreactor was operated for heterotrophic denitrification under the following conditions: HRT = 12 days, mixing speed of 100 rpm, T = 22 °C, and pH = 6.5. The reactor was initially seeded with 100 milliliters of activated sludge from the Palo Alto Regional Water Quality Control Plant in Palo Alto, CA and operated as a continuously fed reactor for 4 months, achieving steady-state, with acetate as the electron donor (750 mg COD L−1) and nitrite as the electron acceptor (500 mg N L−1). The medium contained 0.1 g L−1 MgSO4, 0.1 g L−1 KH2PO4, 0.3 g L−1 CaCl2·2H2O, and 1.0 g L−1 NaHCO3. Each liter of mineral medium contained 1 mL of Fe stock solution and 1 mL of trace element solution. The Fe stock solution contained 0.05 M FeSO4 and 0.026 M EDTA. The trace element solution contained 100 mg L−1 Na2MoO4·2H2O, 200 mg L−1 MnCl2·4H2O, 100 mg L−1 ZnSO4·7H2O, 2 mg L−1 CoCl2·6H2O, and 20 mg L−1 CuSO4·5H2O.No N2O was detected in gas emissions from a well-mixed steady state reactor operated with a continuous feed of acetate and nitrite. Accordingly, two transient feed strategies were investigated. Mineral medium was fed continuously, but acetate and nitrite were added as pulses. In the first strategy, 20 mL of stock sodium acetate solution (1.1 M) and 40 mL of stock sodium nitrite solution (1.80 M) were added as a single daily pulse, resulting in an initial acetate concentration of 11 mM (∼700 mg COD L−1) and an initial NO2− concentration of 36 mM (∼500 mg L−1-N); in the second strategy, acetate pulses and nitrite pulses were separated in time to create alternating anaerobic and anoxic (nitrite-reducing) periods. Anaerobic periods (one day in duration) were initiated by addition of a 20 mL pulse of sodium acetate stock (1.1 M), resulting in an initial acetate concentration of 11 mM. Anoxic periods (also one day in duration) were initiated by addition of a 20 mL pulse of sodium nitrite (1.80 M), resulting in an initial concentration of NO2−-N of 18 mM (∼250 mg L−1). To distinguish nitrite removal due to dilution and washout from nitrite consumption due to microbial activity, 20 mL of bromide stock (1 M) were added as a conservative tracer, along with the nitrite, giving an initial Br− concentration of 10 mM.
Bioreactor monitoring
Helium carrier gas supplied at 250 mL min−1 was used to sweep dissolved N2O and N2 from the liquid phase of the bioreactor. Dissolved N2O did not exceed 1% of saturation (∼22 mM). The gas stream was automatically sampled every 5 minutes for analysis on a Varian 3400 Gas Chromatograph equipped with a 6-foot Porapak Q column (T = 80 °C), 6-foot 5 Å molecular sieve column, and thermal conductivity detector (T = 90 °C). For calibration, a three-point external calibration curve was prepared by serial dilutions of a gas standard containing 500 ppm N2O and 500 ppm N2 (Scott Specialty Gases).NO2− was measured colorimetrically (Hach Company, TNT840 test vials). Acetate was assayed using a Dionex DX-500 ion chromatograph using a heptafluorobutyric acid eluant and equipped with a GP50 gradient pump, CD25 conductivity detector, AS40 Automated Sampler, and As6 ion-exchange column.
Total and volatile suspended solids63 were 1820 mg L−1 and 780 mg L−1, and remained stable. Percentage of polyhydroxybutyrate (PHB) in the dry cell mass was determined by Nile Red fluorescence (BD Biosciences, BD LSR II flow cytometer equipped with a 532 nm laser) and calibrated by gas chromatography (Agilent 6890N gas chromatograph equipped with an HP-5 column and FID detector), as described previously.64
Methods used for imaging of PHB granules, quantitative-PCR (qPCR) calibration, qPCR of 16S rDNA and phaC, and pyrosequencing of 16S rDNA and microbial community analysis are described in the ESI.†
Results
Abiotic production of N2O
As shown in Fig. 2, the Fe(II) in carbonate green rust rapidly reduced nitrite to a mostly N2O end product. Over 90% of the NO2− was reduced to N2O within 2.5 hours, with 98% of the reduced nitrogen accounted for as N2O and N2. No NO3− or NH4+ were detected.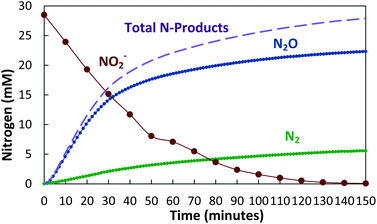 | ||
| Fig. 2 Reduction of nitrite by carbonate green rust (FeII4FeIII2(OH)12CO3) with over 90% conversion of NO2− to N2O. | ||
Microbial production of N2O
Both the coupled and the decoupled strategies were evaluated for over 100 cycles. The fraction of N converted to N2O was stable with 9–12% conversion for the coupled strategy and 60–65% conversion for the decoupled strategy. The two strategies also resulted in different patterns of denitrification and different community structures.Fig. 3 shows the denitrification pattern of the coupled strategy. Initially, acetate and nitrite were present at high levels. N2O production exceeded N2O reduction, and N2O levels increased rapidly. High free nitrous acid (HNO2) levels may have inhibited N2O reductase, previously reported at levels >0.004 mg HNO2-N L−1.47 After ∼1 hour, however, N2O levels peaked then decreased as the N2O reduction rates exceeded N2O production rates. During the second half of the cycle, the fraction of N2O product decreased from ∼0.6 to ∼0.4. After 12 hours, acetate levels decreased to zero, and nitrite removal rates approximated the washout rate of the bromide tracer, indicating little nitrite conversion to N2O production. However, the N2O to N2 fraction increased in the absence of acetate, suggesting an endogenous source of electrons.
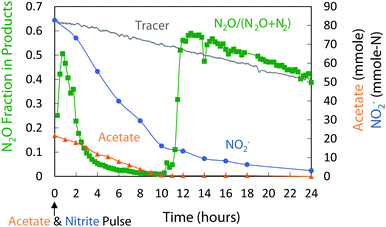 | ||
| Fig. 3 Coupled acetate–nitrite addition (cycle 107): changes in acetate, NO2−, and N2O production. Of the NO2− consumed, 12% was reduced to N2O, the rest to N2. | ||
The decoupled strategy explored the possibility that a storage polymer could serve as the source of reducing equivalents for NO2− reduction to N2O. Separate pulses of acetate and nitrite were delivered daily (Fig. 4) to create alternating anaerobic and anoxic (partial denitrifying) periods (Fig. 4 and 5). These cycles (>200) resulted in a repeating pattern of acetate consumption and nitrite production, with approximately 60–65% of the NO2− reduced to N2O. Acetate pulsed at the beginning of the anaerobic phase was incorporated into biomass as PHB (Fig. 5 and 6). NO2− was then added. Reduction of NO2− to N2O coincided with PHB consumption. The nitrite mass reduced was estimated from the area between the bromide tracer and nitrite curves. Sixty two percent of the NO2− was converted to N2O, with 98% of the reduced nitrogen accounted for as N2O and N2 (mass balance for cycle 61: 12.3 mmol NO2−-N consumed, 7.5 mmol N2O-N produced, 4.5 mmol N2-N produced). The average specific rate of N2O production was 200 μmol N2O per g VSS per h.
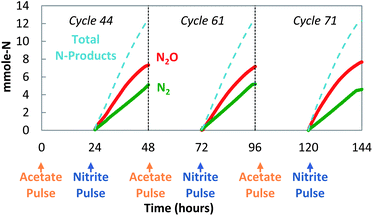 | ||
| Fig. 4 Decoupled acetate/nitrite addition (cycles 44, 61, and 71): sustained production of N2O. | ||
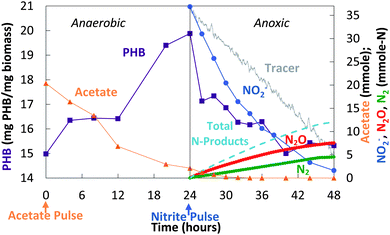 | ||
| Fig. 5 Decoupled acetate/nitrite addition (cycle 61): changes in acetate, NO2−, N2O, N2, and PHB. | ||
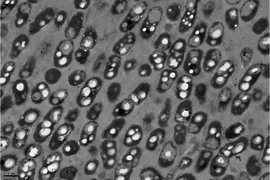 | ||
| Fig. 6 Decoupled acetate/nitrite addition (cycle 61): PHB inclusion granules at the end of the anaerobic period. | ||
The reactor has since been converted to an SBR operation treating real anaerobic digester filtrate from the Sunnyvale Water Pollution Control Plant. Acetate is used as the electron donor and nitrite, from the partially oxidized filtrate, as the electron acceptor. Preliminary results reveal an 82–85% NO2− to N2O conversion fraction over a few cycles.
Molecular microbial ecology analysis
In both the coupled and decoupled feed strategies, bacteria were three orders of magnitude more abundant than Archaea as revealed by qPCR of 16S rDNA (Table 1). But genetic analyses revealed important differences. The phaC/16S rDNA ratio for the decoupled strategy was approximately 20 times greater than that for the coupled strategy. TEM imaging (Fig. 6) and GC measurements confirmed formation of PHB inclusion granules.| Target gene | Coupled (cycle 107) | Decoupled (cycle 61) |
|---|---|---|
| a Indicates one standard deviation. | ||
| 16S rDNA Bacteria (gene copies per L) | 4.9 × 10¹¹ (±1.4 × 10¹⁰)a | 2.7 × 10¹¹ (±1.9 × 10¹⁰) |
| 16S rDNA Archaea (gene copies per L) | 3.1 × 10⁸ (±1.1 × 10⁷) | 3.1 × 10⁸ (±2.4 × 10⁷) |
| phaC (gene copies per L) | 1.1 × 10⁹ (±4.3 × 10⁷) | 1.3 × 10¹⁰ (±2.6 × 10⁷) |
| phaC/16S rDNA Bacteria (%) | 0.22 (±0.02) | 4.99 (±0.33) |
Bacterial genus-level composition was evaluated by 16S rDNA amplicon pyrosequencing (Fig. 7). Decoupled feeding of acetate/nitrite increased richness (from 53 genera to 66 genera) and diversity (Shannon index from 2.68 to 3.42) compared to coupled feeding. With coupled feeding, Pseudomonas and Chryseobacterium were more abundant, and patterns of denitrification were consistent with patterns reported for some Pseudomonas, with transcription and gene expression controlled by the level of denitrification intermediates.49,57,65,66 With decoupled strategy richness and diversity decreased, unclassified Xanthomonadaceae, Comamonas, and Paracoccus increased in abundance and phaC abundance increased. Complete denitrifiers (N2-producing) such as P. stutzeri66 were suppressed while incomplete denitrifiers (N2O-producing) such as Pseudoxanthomonas sp.67 and/or PHB-accumulating bacteria such as Paracoccus sp.68 and Diaphorobacter nitroreducens69 were stimulated.
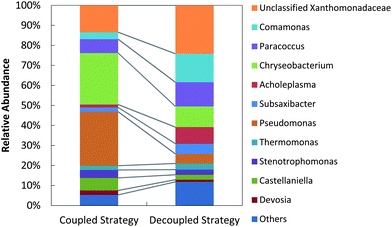 | ||
| Fig. 7 Genus-level bacterial community structures for the coupled strategy (filtered sequences: 10881) and the decoupled strategy (filtered sequences: 9504). The category “Others” indicates populations with relative abundance <1%. | ||
Discussion
As noted previously, both the first step in CANDO – conversion of ammonium to nitrite – and the final step – the use of nitrous oxide as an oxidant in combustion – have been demonstrated at full-scale. This work establishes that the intermediate step – reduction of NO2− to N2O – may be accomplished abiotically with Fe(II) or biotically with PHB storage granules as the source of electrons.In the abiotic strategy, carbonate green rust efficiently and rapidly reduced NO2− to N2O. The efficiency of nitrogen removal from the water was 98%, with >90% conversion of NO2− to N2O. Deeper understanding of the N2O production mechanism is needed. Oxidation of one Fe(II) atom yields just one electron, but reduction of NO2− to N2O requires transfer of two. It is therefore likely that N2O production requires near simultaneous transfer of two electrons from two Fe(II) atoms to NO2− adsorbed to the Fe(II)/Fe(III) solid. It is also likely that N2 is produced from a second 2-electron reduction of the adsorbed N2O. For this reaction to be sustained, the Fe(III) formed by reduction of NO2− will need to be reduced back to Fe(II). Such a regenerative cycle may be possible with heterotrophic Fe(III)-reducing bacteria, but additional research is needed to determine if such a cycle can be established and maintained. Previously researchers have demonstrated microbial oxidation of organic matter coupled to reduction of Fe(III) to produce carbonate green rust70 and siderite71 in systems containing high alkalinity (typical of anaerobic digester centrate).
In the biotic strategy, a decoupled feeding regime selected for organisms that store PHB then evidently use it as the source of reducing equivalents for nitrite reduction. The efficiency of nitrogen removal from the water was 98%, with 62% conversion of NO2− to N2O.
If this process can be scaled up and its efficiency improved, or another N2O-producing strategy developed, CANDO would be an attractive option for nitrogen removal. Fig. 8 compares conventional nitrification–denitrification to CANDO (partial nitrification/partial denitrification) for removal of 1 mole of NH4+ assuming that 111 grams of biodegradable COD (BODL) is potentially available for reduction of nitrogen oxides to N2 and for reduction of CO2 to methane (based on a BODL/N ratio of 7.9, typical of U.S. medium strength wastewater72). Oxygen requirements and energy recovery were calculated assuming the use of COD for stoichiometric production of N2O (100% conversion efficiency) and anaerobic conversion of any remaining COD to CH4. These calculations indicated that CANDO could theoretically decrease oxygen requirements by 20%, decrease biomass production by 40%, and increase energy production by 60%.
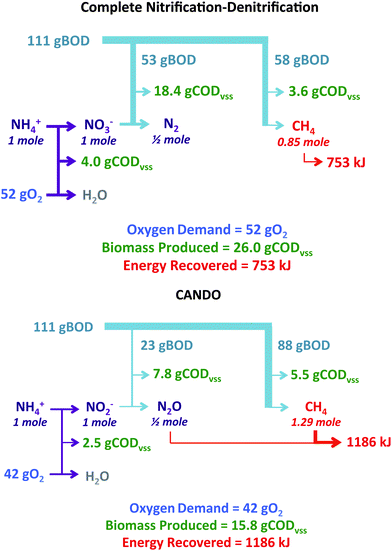 | ||
| Fig. 8 Comparison of complete nitrification–denitrification to CANDO with respect to oxygen demand, biomass production, and energy recovery. | ||
Table 2 compares oxygen requirements, biomass production, and energy recovery for three short-circuit nitrogen removal processes and complete nitrification–denitrification. In full-scale installations, nitritation and anaerobic digestion are mostly limited to treatment of concentrated side streams; however, recent advances are enabling application of these processes to dilute main streams.73–78 The analysis of Table 2 provides an upper bound for wastewater treatment efficiency by assuming nitritation and anaerobic digestion of both concentrated side and dilute main streams. Theoretical maximum process efficiency was determined by the demand in oxygen and organic reducing power required to completely treat the average U.S. per capita nitrogen load of 13.3 g-N/p/d with an average U.S. per capita BODL load of 142 g-O2/p/d.72 The BOD that remains after nitrogen removal is recovered as biogas CH4 and converted to energy with 100% conversion efficiency. From this analysis, the CANON process with Anammox bacteria has the highest theoretical energy recovery, the lowest O2 requirement, and the lowest biomass production. This is followed by CANDO. It should be noted, however, that CANDO mitigates the release of N2O to the atmosphere and provides an additional option for nitrogen removal that may be attractive in terms of footprint, robustness, and ease of retrofit. Pilot-scale testing is needed to determine whether the expected short SRT values for CANDO are achieved under field conditions. Future work will also seek to optimize the NO2− to N2O conversion fraction.
| Process | SRT denit. | f s o denit. | Oxygen (g/p/d) | Biomass (g COD/p/d) | Energy (MJ/p/d) |
|---|---|---|---|---|---|
| a Assumptions: T = 25 °C, NH3 is the N-source for cell synthesis. For partial nitrification, SRT = 6 days and fso = 0.14. For complete nitrification, SRT = 10 and fso = 0.11. fso of denitrification for CANON corresponds to Anammox. fso is defined as the maximum biomass yield expressed in dimensionless units (e.g. oxygen demand of biomass produced divided by the oxygen demand of the electron donor consumed) and calculated by the free energy protocol of Rittmann and McCarty.43fs is the observed yield expressed in dimensionless units and adjusted for decay: fs = fso{(1 + 0.2bSRT)/(1 + bSRT)}. Analysis assumes energy recovery from soluble and particulate BOD with complete conversion of organic nitrogen and free ammonia. b Recovered energy is derived from COD (as CH4) and NOD (as N2O). | |||||
| Complete nit.–denit. | 5 | 0.58 | 48 | 37 | 1.06 |
| SHARON | 5 | 0.58 | 37 | 27 | 1.36 |
| CANON | 607 | 0.14 | 21 | 13 | 1.78 |
| CANDO | 5 | 0.58 | 38 | 22 | 1.56b |
Acknowledgements
Support for this research was provided in part by the Stanford Woods Institute for the Environment through an Environmental Ventures Project grant and by the ReNUWIt Engineering Research Center (Award number EEC-1028968). The molecular ecology work was supported by the World Class University Program of Korea (No. R33-10076) funded by the Ministry of Education, Science and Technology (MEST), Republic of Korea. We thank Eric Sundstrom, Katherine Rostkowski, and Veronica Brand for support with measurements, and Mr Hall Bellows for support and great assistance with automated gas chromatography analyses.References
- E. Scheehle, D. Godwin, and D. Ottinger, Global Anthropogenic Non-CO2 Greenhouse Gas Emissions: 1990–2020, Washington, DC, 2006 Search PubMed.
- J. H. Ahn, S. Kim, H. Park, B. Rahm, K. Pagilla and K. Chandran, Environ. Sci. Technol., 2010, 44, 4505–4511 CrossRef CAS.
- M. J. Kampschreur, H. Temmink, R. Kleerebezem, M. S. M. Jetten and M. C. M. van Loosdrecht, Water Res., 2009, 43, 4093–4103 CrossRef CAS.
- P. K. Barton and J. W. Atwater, J. Environ. Eng., 2002, 128, 137–150 CrossRef.
- C. Hellinga, A. Schellen, J. Mulder, M. van Loosdrecht and J. Heijnen, Water Sci. Technol., 1998, 37, 135–142 CrossRef CAS.
- J. W. Mulder, M. C. M. van Loosdrecht, C. Hellinga and R. van Kempen, Water Sci. Technol., 2001, 44, 127–134 Search PubMed.
- W. Verstraete and S. Philips, Environ. Pollut., 1998, 102, 717–726 CrossRef CAS.
- U. van Dongen, M. S. M. Jetten and M. C. M. van Loosdrecht, Water Sci. Technol., 2001, 44, 153–160 CAS.
- L. Kuai and W. Verstraete, Appl. Environ. Microbiol., 1998, 64, 4500–4506 CAS.
- K. Windey, I. De Bo and W. Verstraete, Water Res., 2005, 39, 4512–4520 CrossRef CAS.
- S. E. Vlaeminck, J. Geets, H. Vervaeren, N. Boon and W. Verstraete, Appl. Microbiol. Biotechnol., 2007, 74, 1376–1384 CrossRef CAS.
- W. R. L. van der Star, W. R. Abma, D. Blommers, J.-W. Mulder, T. Tokutomi, M. Strous, C. Picioreanu and M. C. M. van Loosdrecht, Water Res., 2007, 41, 4149–4163 CrossRef CAS.
- H. Siegrist, D. Salzgeber, J. Eugster and A. Joss, Water Sci. Technol., 2008, 57, 383–388 CrossRef CAS.
- S. Vlaeminck, L. Cloetens, M. Carballa, N. Boon and W. Verstraete, Water Sci. Technol., 2009, 59, 610–617 CAS.
- B. Kartal, J. G. Kuenen and M. C. M. van Loosdrecht, Science, 2010, 328, 702–703 CrossRef CAS.
- K. Third, A. Olav Sliekers, J. Kuenen and M. Jetten, Syst. Appl. Microbiol., 2001, 24, 588–596 CrossRef CAS.
- M. S. M. Jetten, M. Schmid, I. Schmidt, M. Wubben, U. V. Dongen, W. Abma, O. Sliekers, N. P. Revsbech, H. J. E. Beaumont, E. Volcke, H. J. Laanbroek, J. L. Campos-Gomez, J. Cole, M. van Loosdrecht, J. W. Mulder, J. Fuerst, D. Richardson, K. van de Pas, R. Mendez-Pampin, K. Third, I. Cirpus, R. van Spanning, A. Bollmann, L. P. Nielsen, H. O. D. Camp, C. Schultz, J. Gundersen, P. Vanrolleghem, M. Strous, M. Wagner and J. G. Kuenen, Rev. Environ. Sci. Biotechnol., 2002, 1, 51–63 CrossRef CAS.
- A. A. van de Graaf, A. Mulder, P. de Bruijn, M. S. Jetten, L. A. Robertson and J. G. Kuenen, Appl. Environ. Microbiol., 1995, 61, 1246–1251 CAS.
- W. R. Abma, W. Driessen, R. Haarhuis and M. C. M. van Loosdrecht, Water Sci. Technol., 2010, 61, 1715–1722 CrossRef CAS.
- B. J. Cantwell, C. S. Criddle, Y. D. Scherson, G. F. Wells and K. Lohner, Patent US 2010/0272626 A1, 2010.
- B. J. Cantwell, C. S. Criddle, Y. D. Scherson, and G. F. Wells, Patent US 2011/0207061 A1, 2011.
- K. Yuzaki, T. Yarimizu, K. Aoyagi, S.-i. Ito and K. Kunimori, Catal. Today, 1998, 45, 129–134 CrossRef CAS.
- F. Kapteijn, J. Rodriguez-Mirasol and J. A. Moulijn, Appl. Catal., B, 1996, 9, 25–64 CAS.
- Y. Li and J. N. Armor, Appl. Catal., B, 1992, 1, L21–L29 CrossRef CAS.
- S. Imamura, T. Kitao, H. Kanai, S. Shono, K. Utani and H. Jinai, React. Kinet. Catal. Lett., 1997, 61, 201–207 CrossRef CAS.
- J. Haber, T. Machej, J. Janas and M. Nattich, Catal. Today, 2004, 90, 15–19 CrossRef CAS.
- G. Centi, A. Galli, B. Montanari, S. Perathoner and A. Vaccari, Catal. Today, 1997, 35, 113–120 CrossRef CAS.
- A. Warakomski, R. van Kempen and P. Kos, in WEF, IWA, EPA, and the Chesapeake WEA Nutrient Removal Specialty Conference, Baltimore, MD, 2007 Search PubMed.
- J. W. Mulder, J. O. J. Duin, J. Goverde, W. G. Poiesz, H. M. van Veldhuizen, R. van Kempen and P. Roeleveld, in WEFTEC, Water Environment Federation, 2006, pp. 5256–5270 Search PubMed.
- A. Karabeyoglu, J. Dyer, J. Stevens and B. Cantwell, in 44th AIAA/ASME/SAE/ASEE Joint Propulsion Conference & Exhibit, Hartford, CT, 2008, pp. 1–29 Search PubMed.
- U. Pfahl, M. Ross, J. Shepherd, K. Pasamehmetoglu and C. Unal, Combust. Flame, 2000, 123, 140–158 CrossRef CAS.
- Y. D. Scherson, K. A. Lohner, B. Cantwell and T. Kenny, in 46th AIAA/ASME/SAE/ASEE Joint Propulsion Conference & Exhibit, American Institute of Aeronautics and Astronautics, Nashville, TN, 2010, pp. 1–9 Search PubMed.
- Y. Scherson, K. Lohner, B. Lariviere, B. Cantwell and T. Kenny, in 45th AIAA/ASME/SAE/ASEE Joint Propulsion Conference & Exhibit, American Institute of Aeronautics and Astronautics, Denver, CO, 2009, pp. 1–9 Search PubMed.
- J. T. Moraghan and R. J. Buresh, Soil Sci. Soc. Am. J., 1977, 41, 47–50 CrossRef CAS.
- O. Van Cleemput and L. Baert, Environmental Biogeochemistry and Geomicrobiology, 1978, 591–600 CAS.
- H. C. B. Hansen, O. K. Borggaard and J. Sorensen, Geochim. Cosmochim. Acta, 1994, 58, 2599–2608 CrossRef CAS.
- J. A. N. Sorensen and L. Thorling, Geochim. Cosmochim. Acta, 1991, 55, 1289–1294 CrossRef.
- H. C. B. Hansen, C. B. Koch, M. Erbs, S. Guldberg and J. Dickow, Environ. Chem., 2000, 40, 321–323 CAS.
- A. J. Coby and F. W. Picardal, Appl. Environ. Microbiol., 2005, 71, 5267–5274 CrossRef CAS.
- S. Rakshit, C. J. Matocha and M. S. Coyne, Soil Sci. Soc. Am. J., 2008, 72, 1070–1077 CrossRef CAS.
- P. Bénézeth, J. L. Dandurand and J. C. Harrichoury, Chem. Geol., 2009, 265, 3–12 CrossRef.
- J.-M. R. Genin, G. Bourrie, F. Trolard, M. Abdelmoula, A. Jaffrezic, P. Refait, V. Maitre, B. Humbert and A. Herbillon, Environ. Sci. Technol., 1998, 32, 1058–1068 CrossRef CAS.
- B. E. Rittmann and P. L. McCarty, Environmental Biotechnology: Principles & Applications, McGraw-Hill, New York, 2001 Search PubMed.
- P. Bénézeth, J. L. Dandurand and J. C. Harrichoury, Chem. Geol., 2009, 265, 3–12 CrossRef.
- J.-M. R. Genin, G. Bourrie, F. Trolard, M. Abdelmoula, A. Jaffrezic, P. Refait, V. Maitre, B. Humbert and A. Herbillon, Environ. Sci. Technol., 1998, 32, 1058–1068 CrossRef CAS.
- Y. C. Chung and M. S. Chung, Water Sci. Technol., 2000, 42, 23–27 CAS.
- H. Itokawa, K. Hanaki and T. Matsuo, Water Res., 2001, 35, 657–664 CrossRef CAS.
- S. Schalk-Otte, R. J. Seviour, J. G. Kuenen and M. S. M. Jetten, Water Res., 2000, 34, 2080–2088 CrossRef CAS.
- M. R. Betlach and J. M. Tiedje, Appl. Environ. Microbiol., 1981, 42, 1074–1084 CAS.
- I. Kalkowski and R. Conrad, FEMS Microbiol. Lett., 1991, 82, 107–111 CrossRef CAS.
- R. Lemaire, R. Meyer, A. Taske, G. R. Crocetti, J. Keller and Z. Yuan, J. Biotechnol., 2006, 122, 62–72 CrossRef CAS.
- R. L. Meyer, R. J. Zeng, V. Giugliano and L. L. Blackall, FEMS Microbiol. Ecol., 2005, 52, 329–338 CrossRef CAS.
- R. V. Schulthess and W. Gujer, Water Res., 1996, 30, 521–530 CrossRef.
- R. V. Schulthess, M. Kuhni and W. Gujer, Water Res., 1995, 29, 215–226 CrossRef CAS.
- R. V. Schulthess, D. Wild and W. Gujer, Water Sci. Technol., 1994, 30, 123–132 CAS.
- R. J. Zeng, Z. Yuan and J. Keller, Biotechnol. Bioeng., 2003, 81, 397–404 CrossRef CAS.
- M. E. Gentile, J. L. Nyman and C. S. Criddle, ISME J., 2007, 1, 714–728 CrossRef CAS.
- W. A. J. van Benthum, J. M. Garrido, J. P. M. Mathijssen, J. Sunde, M. C. M. van Loosdrecht and J. J. Heijnen, J. Environ. Eng., 1998, 124, 239–248 CrossRef CAS.
- Y. A. N. Zhou, M. Pijuan, R. J. Zeng and Z. Yuan, Environ. Sci. Technol., 2008, 42, 8260–8265 CrossRef CAS.
- T. Caelle, J. Garnier, G. Billen and M. Gousailles, Water Res., 2006, 40, 2972–2980 CrossRef.
- S. Otte, N. G. Grobben, L. A. Robertson, M. S. M. Jetten and J. G. Kuenen, Appl. Environ. Microbiol., 1996, 62, 2421–2426 CAS.
- A. G. Williams and M. M. Scherer, Environ. Sci. Technol., 2001, 35, 3488–3494 CrossRef CAS.
- Standard Methods for the Examination of Water and Wastewater, American Public Health Association, American Water Works Association, Water Environment Federation, Washington, DC, 20th edn , 2000 Search PubMed.
- A. J. Pieja, E. R. Sundstrom and C. S. Criddle, Appl. Environ. Microbiol., 2011, 77, 6012–6019 CrossRef CAS.
- I. C. Anderson and J. S. Levine, Appl. Environ. Microbiol., 1986, 51, 938–945 CAS.
- C. A. Carlson and J. L. Ingraham, Appl. Environ. Microbiol., 1983, 45, 1247 CAS.
- M. Y. Chen, S. S. Tsay, K. Y. Chen, Y. C. Shi, Y. T. Lin and G. H. Lin, Int. J. Syst. Evol. Microbiol., 2002, 52, 2155–2161 CrossRef CAS.
- B. H. A. Rehm, Biochem. J., 2003, 376, 15–33 CrossRef CAS.
- A. Hiraishi and S. T. Khan, Appl. Microbiol. Biotechnol., 2003, 61, 103–109 CAS.
- G. Ona-Nguema, M. Abdelmoula, F. Jorand, O. Benali, A. Géhin, J.-C. Block and J.-M. R. Génin, Environ. Sci. Technol., 2002, 36, 16–20 CrossRef CAS.
- J. K. Fredrickson, J. M. Zachara, D. W. Kennedy, H. Dong, T. C. Onstott, N. W. Hinman and S.-m. Li, Geochim. Cosmochim. Acta, 1998, 62, 3239–3257 CrossRef CAS.
- G. Tchobanoglous, F. L. Burton and H. D. Stensel, Wastewater Engineering: Treatment and Reuse, McGraw-Hill, New York, 4th edn, 2004 Search PubMed.
- C. Shin, E. Lee, P. L. Mccarty and J. Bae, Bioresour. Technol., 2011, 102, 9860–9865 CrossRef CAS.
- J. Kim, K. Kim, H. Ye, E. Lee, C. Shin, P. L. McCarty and J. Bae, Environ. Sci. Technol., 2011, 45, 576–581 CrossRef CAS.
- Q. Yang, Y. Peng, X. Liu, W. Zeng, T. Mino and H. Satoh, Environ. Sci. Technol., 2007, 41, 8159–8164 CrossRef CAS.
- Y. Z. Peng, Y. Chen, C. Y. Peng, M. Liu, S. Y. Wang, X. Q. Song and Y. W. Cui, Water Sci. Technol., 1998, 50, 35–44 Search PubMed.
- H. D. Clippeleir, X. Yan, W. Verstraete and S. E. Vlaeminck, Appl. Microbiol. Biotechnol., 2011, 90, 1537–1545 CrossRef CAS.
- R. Blackburne, Z. Yuan and Ã. Keller, Water Res., 2008, 42, 2166–2176 CrossRef CAS.
Footnote |
| † Electronic supplementary information (ESI) available. See DOI: 10.1039/c2ee22487a |
| This journal is © The Royal Society of Chemistry 2013 |
