 Open Access Article
Creative Commons Attribution 3.0 Unported Licence
Aqueous phase reforming in a microchannel reactor: the effect of mass transfer on hydrogen selectivity
Maria Fernanda Neira D'Angelo,
Vitaly Ordomsky,
John van der Schaaf,
Jaap C. Schouten and
T. Alexander Nijhuis*
Eindhoven University of Technology, Department of Chemical Engineering and Chemistry, PO Box 513, 5600 MB, Eindhoven, The Netherlands. E-mail: T.A.Nijhuis@tue.nl; Tel: +31-40-2473671
First published on 9th August 2013
Abstract
Aqueous phase reforming of sorbitol was carried out in a 1.7 m long, 320 μm ID microchannel reactor with a 5 μm Pt-based washcoated catalyst layer, combined with nitrogen stripping. The performance of this microchannel reactor is correlated to the mass transfer properties, reaction kinetics, hydrogen selectivity and product distribution. Mass transfer does not affect the rate of sorbitol consumption, which is limited by the kinetics of the reforming reaction. Mass transfer significantly affects the hydrogen selectivity and the product distribution. The rapid consumption of hydrogen in side reactions at the catalyst surface is prevented by a fast mass transfer of hydrogen from the catalyst site to the gas phase in the microchannel reactor. This results in a decrease of the concentration of hydrogen at the catalyst surface, which was found to enhance the desired reforming reaction rate at the expense of the undesired hydrogen consuming reactions. Compared to a fixed bed reactor, the selectivity to hydrogen in the microchannel reactor was increased by a factor of 2. The yield of side products (mainly C3 and heavier hydrodeoxygenated species) was suppressed while the yield of hydrogen was increased from 1.4 to 4 moles per mole of sorbitol fed.
1 Introduction
The decentralized conversion of biomass to hydrogen is an attractive alternative to feed highly efficient polymer electrolyte membrane (PEM) fuel cells for power generation.1 Hydrogen can be obtained from an aqueous solution of a (bio)carbohydrate over a Pt-based catalyst under mild conditions (ca. 200 °C, 30 bar) via aqueous phase reforming (APR):2–4| CnH2mOn + nH2O ⇌ nCO2 + (m + n)H2 | (1) |
Various examples in the literature highlight the relevance of the interface mass transfer rate, and thus the reactor design, on the product selectivity.19,20 One example is a microreactor in which gas and liquid are forced to flow through channels with diameters of 10−4–10−3 m. At these scales, the hydrodynamics differ from those in conventional systems. Of possible flow regimes, the Taylor flow regime is one of the most stable.21–23 In the Taylor flow regime, gas bubbles and liquid slugs flow through the channel as a plug flow in an alternating sequence. The gas bubbles are longer than the channel diameter and a thin liquid film separates the gas bubbles from the channel walls, where the catalyst is deposited. This system benefits from high diffusion rates, short diffusion paths and large interfacial surface areas, resulting in excellent mass and heat transfer rates.24,25 Provided there is a good affinity between the liquid and the washcoated walls of the channel, this system offers an ideal wettability and a continuous renewal of reactants on the catalyst surface.26 Despite these advantages, the application of microreactor systems for heterogeneously catalyzed reactions is still under development since some issues like catalyst loading, catalyst stability and scaling up need to be solved to make these processes industrially attractive.
We have recently reported that APR of ethylene glycol can be successfully conducted in a catalytically washcoated microchannel reactor that operates under the Taylor flow regime with continuous phase-transfer hydrogen separation.27 The focus of that study, as initial proof of concept, was the preparation of the catalyst as well as the evaluation of its activity and stability during APR. In that study, a visible increase of the hydrogen selectivity compared to a conventional fixed bed reactor was detected. This was attributed to the high mass transfer rates and to the hydrodynamic characteristics of the microchannel reactor. The use of a microchannel reactor is expected to be even more beneficial during APR of larger carbohydrates like sorbitol with stronger proclivity for undesired hydrogen-consuming reactions than ethylene glycol.
In this study, we investigate the benefits of using a microchannel reactor for the production of hydrogen via APR of sorbitol.
| C6H14O6 + 6H2O ⇌ 6CO2 + 13H2 | (2) |
2 Experimental
2.1 Catalyst preparation
A 5 μm boehmite layer was deposited on the walls of a 1 m long, 320 μm ID fused silica microchannel (Varian) by following a static washcoating methodology, fully described in a previous work.27 Pt was loaded on the support by impregnation using a solution of Pt(C5H7O2)2 in Cl2CH2 with the desired concentration to obtain 0.7 mg Pt per 1.7 m or 2 wt% Pt/AlO(OH). Activation of this layer was done by calcination at 350 °C for 6 h and reduction at 220 °C with hydrogen for 2 h prior to the reaction.The catalytic activity of the washcoated microchannel was compared to that of a reference bulk catalyst in a fixed bed reactor. For the preparation of this catalyst, the AlO(OH) precursor was calcined, impregnated and activated in the same fashion as the washcoated layer. The resulting powder was pressed and sieved to obtain particle size between 422 and 600 μm.
2.2 Experimental setup
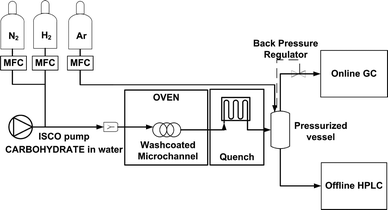
The experimental setup in Fig. 1 was used to conduct the conversion of sorbitol to hydrogen by APR. The washcoated microchannel is located in an oven with circulating hot air that provides constant heating to the reactor to maintain isothermal operation at 220 °C. The adiabatic temperature decrease at 100% conversion is less than 8 K (calculated as ΔT = 6 × 10⁵ J mol−1 sorbitol × 10−3 mol sorbitol/mol water/76 J mol−1 water K), which can be easily overcome due to the excellent heat transfer characteristics of the microchannel reactor. Prior to operation, the washcoated microchannel reactor was pressurized, pre-heated and pre-wetted. A syringe pump (Teledyne ISCO 500D) was used to feed the liquid solution of 1 wt% sorbitol (Sigma) in water. During the reaction, the microchannel reactor was operated under the Taylor flow regime by co-feeding the liquid reactant and nitrogen. Both phases were pre-mixed before the reactor inlet in a Y-mixer (VICI Valco). The reaction products were quenched downstream and collected in a pressurized stainless steel vessel where the gas phase was separated from the liquid phase. The pressure of the system (i.e. 35 bar) was controlled by a back pressure regulator connected to the gas line that exited the steel vessel. To ensure proper control of the pressure, an argon flow was fed to this vessel, also serving as an external standard to quantify the gas composition.The identification and quantification of the liquid phase reaction products were done by a combination of HPLC (column: Metacarb 67H, detector: RI), GC (column: Cp-sil5, detector: FID) and GC-MS (column: DB-200, detector: MS) analysis. The composition of the gas phase was monitored on-line with GC (columns: Poraplot/Molsieve 5A, detectors: TCD/FID).
The composition of gas and liquid was used to determine the conversion of sorbitol and the selectivity towards the main products when varying the liquid flow rate (0.75–9 ml h−1) and the gas to liquid ratio at the microchannel inlet (RGL = 0–2 mgas3/mliquid3). These results were compared to those obtained in analogous experiments conducted in a stainless steel tubular reactor (10 cm long, 2.5 mm ID) with a porous bed of 110 mg of bulk catalyst (2 wt% Pt/AlO(OH)). The porosity of the bed was ca. 0.3. This reactor was exchanged by the washcoated microchannel in the same experimental setup depicted in Fig. 1. In these experiments, the fixed bed reactor was placed vertically and operated downflow. After pre-wetting of the catalyst with the liquid reactant, a nitrogen flow was fed co-currently in the same fashion as previously done with the washcoated microchannel reactor. The liquid and gas flow rates were adjusted according to the amount of Pt in the reactor to maintain a comparable WHSV and equal RGL as those in the microchannel. If not indicated otherwise, the gas stream fed is pure nitrogen. An extended series of experiments were conducted in the fixed bed reactor to investigate the effect of the hydrogen partial pressure on the reaction rate and the hydrogen selectivity. In these experiments, various mixtures of nitrogen and hydrogen were pre-mixed with the liquid stream with a constant gas to liquid ratio of RGL = 2mgas3/mliquid3.
2.3 Conversion, selectivity and yield
The following expressions were used to calculate the conversion of sorbitol (XSB), the selectivity to hydrogen on the basis of the sorbitol converted (SH2), the selectivity to hydrogen on the basis of the gas phase products (SH2,gas), and the yield of carbon products (YCi):| XSB = (FSB,in − FSB,out)/FSB,in × 100% |
| SH2 = FH2/(13 × FSB,in × XSB/100) × 100% |
| SH2,gas = FH2/(13/6 × FC,gas) × 100% |
| YCi = FCi /(FC,prods) × 100% |
3 Results and discussion
3.1 Conversion of sorbitol
Fig. 2 shows the conversion of sorbitol in the washcoated microchannel and the fixed bed reactor as a function of the residence time (calculated on the basis of the total Pt loading). Both reactor types present a similar rate of consumption of sorbitol. The two reactors were operated in the same fashion. They were equally pre-heated, pre-wetted and they were maintained under analogous reactor conditions. Notice that in both cases, nitrogen was pre-mixed with the liquid reactant in a gas to liquid ratio of RGL = 2mgas3/mliquid3. The differences in terms of hydrodynamics of the two reactor types seem not to influence the conversion of sorbitol. Intra-particle mass transfer does not play a role in the overall rate of sorbitol consumption and liquid–solid external mass transfer is orders of magnitude faster than the reforming reaction rate (Table 1). Therefore, the bulk catalyst used in the fixed bed reactor and the catalyst washcoat deposited on the microchannel walls are comparable in terms of activity. The characterization of these catalysts by TEM analysis confirms the same result: both presented a similar Pt particle size (i.e. 1.5 nm), which is generally a good indicator of a comparable catalytic activity.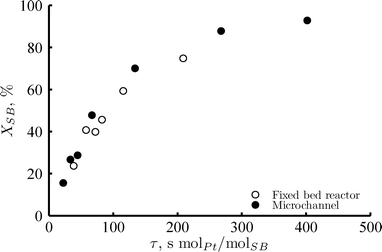 | ||
| Fig. 2 Sorbitol conversion versus residence time for the fixed bed reactor (open circles), with 2 mg Pt loading; and the microchannel reactor (full circles), with 0.7 mg Pt loading. Reaction conditions: 220 °C, 35 bar, 1 wt% of sorbitol in water, RGL = 2mgas3/mliquid3 at the reactor inlet, liquid flows were adjusted in each case to achieve analogous WHSV. | ||
| Steps | Parameters | Fixed bed reactor | Microchannel | |
|---|---|---|---|---|
| a Liquid–solid mass transfer coefficient estimated from correlations of Wakao et al.31 for the fixed bed reactor and Kreutzer et al.24 for the microchannel.b Thiele modulus calculated assuming the first order reaction as ϕ = L(k/De)0.5, where L = particle diameter/6 for the bulk catalyst, L = coating thickness for the washcoated microchannel, and De is the effective diffusivity coefficient.c Reaction rate constant estimated from experimental data.d Reaction rate constant approximated using the kinetic model of Brahme and Doralswamy.32,33e Solid–gas mass transfer coefficient estimated from correlations of Kreutzer et al.24 for the microchannel. | ||||
| Mass transfer of sorbitol, FMT1 | ||||
| External L–S | (kLSaLS)SB![[thin space (1/6-em)]](https://www.rsc.org/images/entities/char_2009.gif) a a |
10−1 | 100 | s−1 |
| Intra-particle | ϕR![[thin space (1/6-em)]](https://www.rsc.org/images/entities/char_2009.gif) b b |
10−3 | 10−5 | — |
| Surface reactions, FkR and FkH | ||||
| Reforming | kR![[thin space (1/6-em)]](https://www.rsc.org/images/entities/char_2009.gif) c c |
10−8 | 10−8 | s−1 |
| Hydrogenation | kH![[thin space (1/6-em)]](https://www.rsc.org/images/entities/char_2009.gif) d d |
10−3 | 10−3 | s−1 |
| Mass transfer of hydrogen, FMT2 | ||||
| Intra-particle | ϕH![[thin space (1/6-em)]](https://www.rsc.org/images/entities/char_2009.gif) b b |
100 | 10−2 | — |
| External S–L | (kSLaSL)H2a | 10−2 | 10−1 | s−1 |
| External S–G | (kSGaSG)H2e | — | 10−2 | s−1 |
3.2 Selectivity to hydrogen
The selectivity towards hydrogen as a function of conversion and the reactor type is shown in Fig. 3. In the case of the fixed bed reactor the selectivity is relatively low (ca. 20%) in the range of sorbitol conversion studied. Notice that these selectivity values were calculated on the basis of the total sorbitol converted (SH2). The hydrogen selectivity based on the carbon in the gas phase (SH2,gas) ranges from 63 to 78% in the case of the fixed bed reactor, very close to the values found in the literature.29 In this study, we have considered that it is more appropriate to use the first definition of hydrogen selectivity since a significant amount of the side products of this reaction are in the liquid phase within the range of space velocities studied. These products are mostly formed by dehydration and hydrogenation of sorbitol and the intermediate compounds, thus representing consumption of both sorbitol and hydrogen (i.e. increase of conversion and decrease of hydrogen selectivity). As the sorbitol conversion increases, the hydrogen consuming reactions contribute to a larger extent. Therefore, there is a decreasing trend in the hydrogen selectivity as the conversion increases. For ca. 20% < XSB > 70% the selectivity to hydrogen is nearly constant. This tendency can be explained by the formation of hydrogen from intermediates (i.e. glycerol), which confirms that the generation of hydrogen proceeds through several consecutive steps.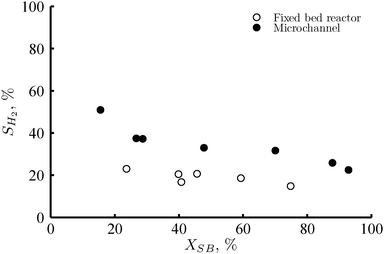 | ||
| Fig. 3 Selectivity to hydrogen versus sorbitol conversion for the fixed bed reactor (open circles), with 2 mg Pt loading; and the microchannel reactor (full circles), with 0.7 mg Pt loading. Reaction conditions: 220 °C, 35 bar, 1 wt% of sorbitol in water, RGL = 2mgas3/mliquid3 at the reactor inlet, liquid flows were adjusted in each case to achieve analogous WHSV. | ||
Fig. 3 shows a clear superiority of the microchannel over the fixed bed reactor in terms of hydrogen selectivity. The selectivity is nearly double in the whole conversion range. In the microchannel, it is possible to reach a larger sorbitol conversion with a greater hydrogen selectivity. As a result, the maximum production of hydrogen per sorbitol feed in the microchannel significantly exceeds that of the fixed bed reactor (i.e. 4.0 vs. 1.4 moles of hydrogen per mole of sorbitol feed, respectively).
As schematically depicted in Fig. 4, once hydrogen is formed over the catalyst surface due to the reforming reaction, two competitive follow-up routes are possible: (1) hydrogen consumption in side reactions; and (2) the removal of hydrogen from the catalyst surface via mass transfer to the gas phase, where it cannot further react. The selectivity to hydrogen is given by the relative amount of hydrogen that is transferred to the gas phase (FMT2) with respect to the total amount of hydrogen produced (FMT2 + FkH), or in other words, by the ratio FMT2/(FMT2 + FkH). Therefore, the increase in hydrogen selectivity in the case of the microchannel can be explained on the basis of the excellent mass transfer compared to the fixed bed reactor. The large interfacial mass transfer rate in the microchannel reactor is the result of an increased mass transfer coefficient and a large interfacial surface area.
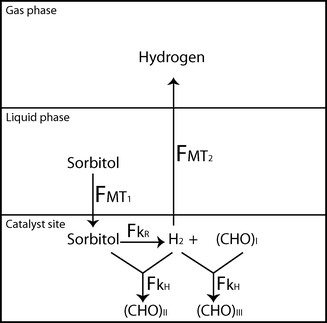 | ||
| Fig. 4 Schematic representation of the mass transfer and reaction steps towards the formation of hydrogen from sorbitol. FMT1 is the mass transfer rate of sorbitol from the liquid to the catalyst site, FkR is the reforming reaction rate, FkH is the hydrogenation reaction rate, and FMT2 is the mass transfer rate of hydrogen from the catalyst site to the gas phase. (CHO)I, (CHO)II and (CHO)III are intermediate polyhydroxy species. | ||
In principle, the increase in hydrogen selectivity in the microchannel reactor may be ascribed to additional factors derived from the distinct hydrodynamics of this reactor compared to the conventional fixed bed reactor. For example, fixed bed reactors typically present problems of catalyst wettability,30 probably not present in the microchannel reactor.26 However, an insufficient wettability of the catalyst is not expected in any of the two reactors. Given the hydrophilic nature of the catalyst support and the liquid medium, it is expected that the catalyst pores are rapidly filled with liquid by capillary forces during the pre-wetting procedure. Besides, any difference in catalyst wettability would have been reflected in the trend of sorbitol conversion of the two reactor types (Fig. 2). Therefore, the enhanced mass transfer of hydrogen will be the most important difference between the two reactors and we will discuss the results accordingly. As not only the mass transfer of hydrogen is enhanced but also that of the liquid components, the rapid surface renewal of the liquid film in the washcoated microchannel reactor in the Taylor flow regime will also influence the hydrogen selectivity. The concentration of water-soluble oxygenates on the catalyst surface determines the rate of hydrogen-consuming side reactions, previously referred as FkH.
3.3 Mass transfer limitations
Table 1 shows the reaction rate constants and the mass transfer coefficients that quantify the speed of each step during the transformation of sorbitol to hydrogen (Fig. 4). These are the mass transfer of sorbitol from the liquid to the catalyst active site (FMT1), the surface reforming reaction that produces hydrogen (FkR), the reactions that consume hydrogen (FkH), and the mass transfer of hydrogen from the catalyst active site to the gas phase (FMT2). While the slow kinetics of the reforming reaction are the limiting factor for the sorbitol conversion rate (FMT1 ≫ FkR), the high rate of hydrogen consumption is highly competitive with the rate of mass transfer of hydrogen from the catalyst active site to the gas phase (FMT2 ≈ FkH). Therefore, the excellent mass transfer properties of the microchannel do not have a significant effect on the conversion rate (Fig. 2) but strongly influence the selectivity of the reaction (Fig. 3). By improving the mass transfer rate, the hydrogen-consuming reactions are depressed and the selectivity towards hydrogen is increased.According to the values in Table 1, the mass transfer rate of hydrogen is improved in the microchannel reactor compared to the fixed bed reactor due to an increase of both intra-particle mass transfer rate (diffusion of hydrogen through the catalyst particle) and external mass transfer rate (from the catalyst surface to the gas phase). The intra-particle mass transfer limitations of hydrogen were quantified in this study by estimating the Thiele modulus (ϕH), although this term is typically used when the diffusion of the reactant and the chemical reaction occur as two steps in series. In this case, the intra-particle diffusion and the hydrogenation reaction are two parallel steps, but still the Thiele modulus can be used as an indicator of the ratio between the rate of hydrogenation and the rate of hydrogen diffusion through the pores. A value of ϕH > 0.3 indicates that the intra-particle mass transfer of hydrogen is slower than the hydrogenation reaction,30 thus predicting a more severe effect of hydrogenation (i.e. lower hydrogen selectivity and higher yield of hydrogenated products). The intra-particle hydrogen diffusion limitation is prevented by the thin catalytic layer in the microchannel reactor, whereas the larger catalyst particle size in the fixed bed reactor results in a Thiele modulus ϕH ≫ 0.3. Smaller particle sizes in the fixed bed reactor would increase the internal diffusion rate but would represent an increase in pressure drop, which might become significant in larger units where longer tubes and larger liquid flow rates are used. The external mass transfer rate of hydrogen from solid to gas is also intensified in the microchannel reactor under the Taylor flow regime. This is due to the large and uniformly distributed contact area between the catalytic layer on the microchannel walls and the gas bubbles (Fig. 5), and due to the large mass transfer coefficient of hydrogen from the catalyst surface to the gas bubbles through the thin liquid film formed between these two phases.21,24 The high external mass transfer rate of hydrogen has however a milder effect on the hydrogen selectivity, since it is higher than the hydrogenation rate for both reactors.
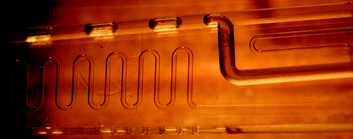 | ||
| Fig. 5 Formation of the Taylor flow regime in a glass micro-mixer prior to the washcoated microchannel reactor. | ||
3.4 Effect of hydrogen partial pressure
The effect of the hydrogen partial pressure on the reforming rate and on the selectivity of APR was examined by co-feeding mixtures of hydrogen and nitrogen at the inlet of the fixed bed reactor. The mass transfer coefficients were constant and only the hydrogen partial pressure was varied. Fig. 6 shows that the hydrogen partial pressure has an inhibiting effect on the kinetics of the reforming reaction. The negative reaction order of hydrogen concentration on the reforming kinetics, which can be attributed to a decrease in the availability of the catalyst active sites, might also explain the saturating tendency observed in Fig. 2 as the conversion increases. As the hydrogen partial pressure increases with increasing residence time, the reforming rate decreases.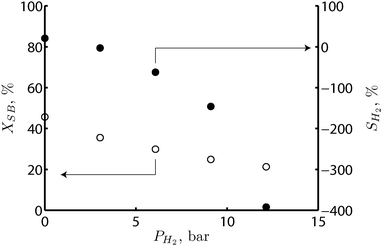 | ||
| Fig. 6 Effect of hydrogen partial pressure on the sorbitol conversion (open circles) and on the selectivity to hydrogen (full circles) in the fixed bed reactor. Reaction conditions: 220 °C, 35 bar, 1 wt% of sorbitol in water, liquid flow rate of 7 ml h−1, RGL = 2mgas3/mliquid3 at the reactor inlet, with increasing hydrogen concentration in the inlet gas feed from 0 to 100%. | ||
The higher selectivity to hydrogen observed in the microchannel reactor compared to the fixed bed reactor resulted in higher concentrations of hydrogen in the gas phase (Fig. 7). A stronger inhibiting effect of the hydrogen concentration on the reaction kinetics would be expected in the case of the microchannel reactor. Nevertheless, no significant difference was observed in the sorbitol conversion achieved by the two reactors (Fig. 2). This suggests that the higher mass transfer coefficient in the microchannel reactor leads to a reduction of the hydrogen concentration over the catalyst surface, thus minimizing the inhibiting effect of hydrogen on the reforming rate.
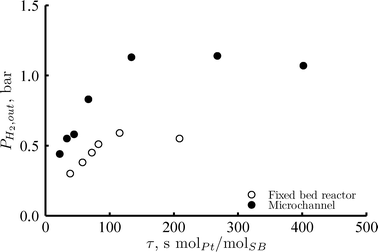 | ||
| Fig. 7 Hydrogen partial pressure at the outlet of the reactor versus residence time for the fixed bed reactor (open circles), with 2 mg Pt loading; and the microchannel reactor (full circles), with 0.7 mg Pt loading. Reaction conditions: 220 °C, 35 bar, 1 wt% of sorbitol in water, RGL = 2mgas3/mliquid3 at the reactor inlet (no hydrogen added), liquid flows were adjusted in each case to achieve analogous WHSV. | ||
According to Fig. 6, the hydrogen partial pressure also presents a negative effect on the selectivity towards hydrogen. The negative values of SH2 observed at hydrogen pressures above 4 bar are explained by a net mass transfer of hydrogen from the gas phase to the catalyst surface where it is consumed in side reactions. The total amount of hydrogen consumed is greater than the amount of hydrogen produced.
3.5 Effect of nitrogen addition
According to our analysis, the selectivity towards hydrogen depends on the mass transfer rate of hydrogen from the catalyst surface to the gas phase. This was enhanced by a combination of two factors: increase of the mass transfer coefficient (microchannel operating under the Taylor flow regime vs. fixed bed reactor); and increase of the driving force for the mass transfer by a decrease of the hydrogen concentration in the gas phase (addition of nitrogen). The combined effect of these factors is observed in Fig. 8, where the conversion and the selectivity to hydrogen have been compared for two different gas to liquid ratios at the inlet. If only liquid is fed to the microchannel reactor and the conversion to gaseous products is limited, the development of the desired Taylor flow regime in the microchannel is not successful. The gas produced is highly concentrated in hydrogen, thus limiting the possibility of hydrogen removal from the catalyst surface via mass transfer to the gas phase. In this case, the performance of the microchannel reactor is analogous to that of the fixed bed reactor. The effect of adding nitrogen as a stripping agent is beneficial for both reactors. The conversion is increased due to a kinetic effect of reducing hydrogen partial pressure. The selectivity also rises due to an increase of the driving force for the mass transfer. The increase in selectivity is larger in the case of the microchannel reactor due to an increase in the mass transfer coefficient.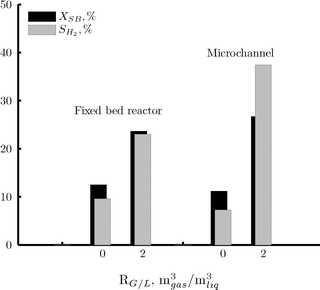 | ||
| Fig. 8 Effect of the gas to liquid ratio at the reactor inlet (RGL) on the sorbitol conversion (black area) and on the selectivity to hydrogen (gray area) for the fixed bed reactor and the microchannel reactor. Reaction conditions: 220 °C, 35 bar, 1 wt% of sorbitol in water, liquid flow rate of 15 ml h−1 (fixed bed reactor) and 6 ml h−1 (microchannel reactor), no hydrogen added. | ||
3.6 Reaction mechanism
So far we have simplified the surface chemistry to two types of reactions: one that produces hydrogen (i.e. the reforming reactions) and another that consumes hydrogen. Earlier investigations on APR10,28 reveal a more complicated chemistry comprising many chemical reactions and intermediates (Fig. 9). The general belief is that hydrogen is produced by initial dehydrogenation of the substrate, followed by decarboxylation or decarbonylation and water gas shift on the metal sites (i.e. the reforming pathway).11 This pathway leads to the production of hydrogen, CO2 and a series of smaller carbohydrates that are sensitive to further reforming reactions. In a hydrogen rich medium, direct hydrogenolysis of the internal C–C bonds of sorbitol may also occur34 on the metal sites. Due to the large yields of glycerol, we believe that direct hydrogenolysis of the intermediate C–C bond is one of the preferential routes. In addition to C–C cleavage reactions, sorbitol and the smaller carbohydrates undergo dehydration of the C–O bonds, catalyzed by the acid support (i.e. AlO(OH)) or the liquid medium, followed by hydrogenation of the dehydrated intermediates on the metal sites.11,35 Successive dehydration/hydrogenation of the intermediates leads to a wide variety of water soluble hydrodeoxygenated species bearing from 1 to 6 carbon atoms with a reduced OH/C ratio. The bi-functionality of the catalyst also favors rearrangement reactions of the substrate and the intermediate products towards the production of organic acids, aldehydes, ketones and ring compounds like furan derivatives.29 Further dehydration and hydrogenation of these species results in the formation of C1 to C6 alkanes.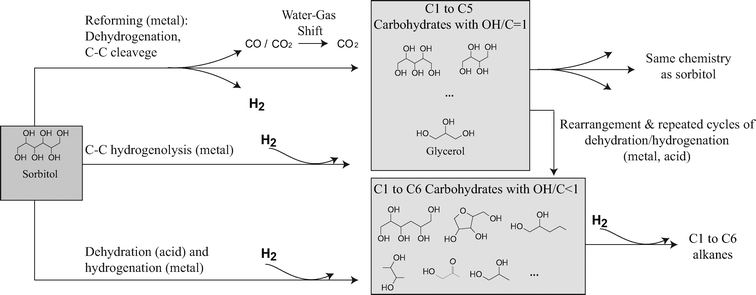 | ||
| Fig. 9 Reaction pathway for the aqueous phase reforming of sorbitol. | ||
3.7 Product distribution
Fig. 10 shows the distribution of carbon within the gas and the liquid phase products at 25% of sorbitol conversion for the two reactor types. In both cases, the largest fraction in the gas phase is CO2, which is the product of the reforming pathway. No CO was detected in any of the experiments conducted. This may be due to the low reaction temperature and the high concentration of water that shift the water-gas-shift reaction towards the formation of CO2. It may also indicate that CO2 is mainly produced by decarboxylation, rather than decarbonylation and water-gas-shift. According to the results of the present study, it is not possible to elucidate the preferential route for CO2 production. Further research should be conducted to unravel this question, which is outside the scope of this paper. Minor amounts of C1–C3 alkanes were found, while only traces of C4–C6 alkanes were detected (i.e. yields lower than 0.05%). In the liquid phase, the C3 fraction is noticeably larger than the rest, followed by C6, C5 and C4 species. In these fractions, a significant amount of hydrodeoxygenated species (e.g. 1,2-propanediol, butanediols, furan derivatives, isosorbide) are found. These results suggest a significant rate of hydrogenolysis of the intermediate C–C bond of sorbitol towards C3 products, as well as a significant rate of the dehydration–hydrogenation reactions due to a highly acidic (catalyst support/liquid phase) and hydrogen rich environment. The conversion of these species to alkanes is expected to occur at larger residence times.29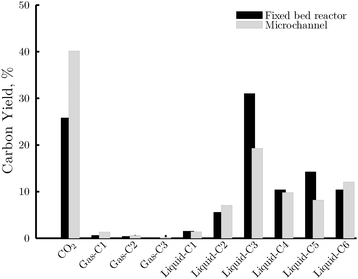 | ||
| Fig. 10 Yield of carbon containing products in the fixed bed reactor (black area) and the microchannel reactor (gray area) at 25% conversion. Gas-C1: CH4; gas-C2: C2H6; gas-C3: C3H8; liquid-C1: methanol; liquid-C2: ethanol, ethyleneglycol, glycolaldehyde and acetic acid; liquid-C3: see Fig. 11; liquid-C4: 1,2-butanediol; 2,3-butanediol, butyric acids, 3-hydroxydihydro-2-furanone and butyrolactone; liquid-C5: 1,2-pentanediol, pentanoic acid, 5-hydroxymethyldihydrofuran-2-one, 2-methyltetrahydrofuran, xylofuranose; and liquid-C6: 2-hexanol, isosorbide and sorbitan. Unbalance below 5%. | ||
Fig. 10 also highlights a different chemistry in each reactor type. The yield of CO2 is distinctively higher in the case of the microchannel reactor than in the fixed bed reactor, suggesting that the reforming pathway is facilitated in the former compared to the latter. This difference is attributed to the increased mass transfer rate of the hydrogen from the catalyst active site to the inert gas phase in the microchannel reactor, which aids the rapid turnover of the catalyst sites and therefore favors the rate of C–C cleavage reactions. On the other hand, the yield of heavier liquid products, in particular C3 species, is remarkably higher in the case of the fixed bed reactor. A breakdown of the yield of the main components of the C3 fraction is given in Fig. 11. Formation of glycerol, the major side product in this fraction, is clearly more pronounced in the fixed bed reactor. This can be explained by a more rapid hydrogenolysis of the sorbitol due to a higher concentration of hydrogen at the surface of the bulk catalyst in the fixed bed reactor.
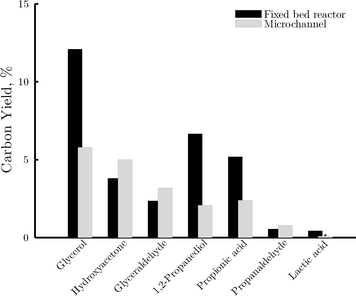 | ||
| Fig. 11 Breakdown of yield of carbon containing products in the C3 fraction in the fixed bed reactor (black area) and the microchannel reactor (gray area) at 25% conversion. | ||
Further conversion of glycerol can explain the production of the remaining components of the C3 fraction. Earlier studies on glycerol conversion propose the formation of glyceraldehyde via dehydrogenation of glycerol on the active metal and the production of hydroxyacetone via dehydration on the acid sites.36 The relative amounts of glyceraldehyde and hydroxyacetone are nearly the same in both reactor types, suggesting an analogous balance between dehydrogenation and dehydration reactions (i.e. comparable balance metal/acid sites) in both cases. This is in line with the initial statement of the two catalytic systems being comparable in terms of their reactivity. These two intermediates may undergo a sequence of hydrogenation reactions towards 1,2-propanediol. Compared to the microchannel reactor, in the fixed bed reactor the yield of 1,2-propanediol relative to the total yield of C3 products is significantly higher, whereas that of the intermediates (i.e. glyceraldehyde and hydroxyacetone) is lower. This indicates that the selectivity for hydrogenation reactions is remarkably higher in the fixed bed reactor. An important amount of propionic acid is also detected in both reactors. This suggests a significant contribution of the rearrangement reactions to the overall reaction network. This acid may be produced by the reaction between glyceraldehyde and water, with a subsequent sequence of dehydration and hydrogenation reactions. The yield of this product with respect to the total yield of C3 products is slightly larger in the case of the fixed bed reactor.
We have previously presented that the addition of hydrogen at the inlet of the reactor represented a decrease in the reaction rate and the hydrogen selectivity. This was attributed to the preferential hydrogenation of the substrate and its intermediates rather than the desired reforming pathway with increasing hydrogen partial pressures. The yield of the most significant carbon containing products obtained at different hydrogen partial pressures is given in Fig. 12. A higher hydrogen concentration is detrimental for the conversion to CO2. Instead, the addition of hydrogen enhances the conversion to glycerol and 1,2-propanediol via hydrogenolysis of C–C and C–O bonds. There is a consistency between the products that are enhanced when increasing the hydrogen partial pressure and those that were favored in the fixed bed reactor compared to the microchannel reactor. This suggests that the main difference between these reactors is the concentration of hydrogen at the catalyst surface, and therefore its availability to participate in hydrogenolysis reactions. This is in line with the previous argument of the microchannel reactor offering a more rapid removal of hydrogen from the catalyst surface and thus favoring the hydrogen producing reactions while preventing hydrogen consuming reactions.
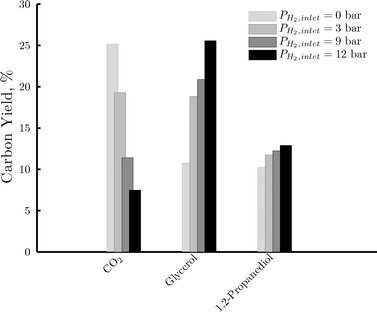 | ||
| Fig. 12 Effect of hydrogen partial pressure on the yield of CO2, glycerol and 1,2-propanediol in the fixed bed reactor. Reaction conditions: 220 °C, 35 bar, 1 wt% of sorbitol in water, liquid flow rate of 7 ml h−1, RGL = 2mgas3/mliquid3 at the inlet, with increasing hydrogen concentration in the inlet gas feed from 0 (light gray area) to 100% (black area). | ||
3.8 Practical considerations
Whereas the technology of fixed bed reactors is well established, for a practical implementation of the microreactor concept, several considerations should be taken into account. Since the catalyst is immobilized on the microchannel walls, the recovery and regeneration of the catalyst is difficult. Therefore, the catalyst stability is an important requirement. In this study, a washcoated microchannel was tested for 3 weeks of time on stream. This test included numerous runs under various reaction conditions, as well as several intermediate checks under the same reaction conditions to identify any loss of activity. During this time, the catalytic activity remained constant. Further discussion on the stability of this catalytic system under APR conditions is given in our previous work.27 The use of nitrogen as a stripping agent introduces some concerns regarding the production costs, which can be mitigated by recirculation of this gas after the hydrogen content is consumed, for example, in a PEM fuel cell. Combustion of the alkane fraction of the gaseous products can be conducted on the outer side of the microchannels to supply the heat of the reaction. Due to the large surface to volume ratio, microchannel reactors are also very efficient heat exchangers.37 In a final hydrogen generation unit, the desired production scale can be achieved by parallelization of identical microchannels in a stack configuration with intermediate heating. Nevertheless, numbering up of multiphase microchannel reactors is a field still under development. Promising results have been recently published by our group with gas–liquid applications that can meet a small/medium production scale.38 Scaling up of catalytic washcoated microchannel reactors for this application is a work in progress.4 Conclusions
The Pt-based washcoated microchannel reactor for aqueous phase reforming of sorbitol, combined with nitrogen stripping, has excellent mass transfer from the catalyst active site to the inert gas phase, which aided the rapid removal of hydrogen from the catalyst surface and limited its availability to participate in undesired hydrogenation reactions. Compared to a fixed bed reactor, the selectivity to hydrogen obtained in the microchannel reactor was increased by a factor of 2 regardless of the sorbitol conversion. The yield of hydrogen was increased from 1.4 to 4 moles per mole of sorbitol fed. The mass transfer properties of the microchannel reactor did not affect the rate of sorbitol consumption, which is limited by the kinetics of the reforming reaction. Hydrogen inhibits the reforming reaction and favors side – hydrogen consuming – reactions. A decrease of the hydrogen partial pressure is beneficial in both the microchannel reactor and the fixed bed reactor. These benefits are more significant for the microchannel reactor, since it combines the effect of a reduced hydrogen partial pressure in the gas phase with a high mass transfer coefficient, resulting in a greater reduction of the hydrogen concentration at the catalyst. This has significant implications for the product distribution. The analysis of the products reveals an important contribution of the hydrogenolysis of the C–C and C–O bonds of sorbitol and its intermediates as an important source of hydrogen selectivity loss. The most significant products of the hydrogen consuming reactions are water-soluble C3 species like glycerol and 1,2-propanediol, followed by heavier hydrodeoxygenated compounds in the C6, C5 and C4 fractions. The formation of these species rises when the hydrogen partial pressure increases. Since the hydrogen concentration at the catalyst surface is lower in the microchannel reactor, the yield of the hydrogenated products is severely depressed while the products of the reforming route (i.e. CO2) are remarkably increased.Acknowledgements
This research has been performed within the framework of the CatchBio program. The authors gratefully acknowledge the support of the Smart Mix Program of the Netherlands Ministry of Economic Affairs and the Netherlands Ministry of Education, Culture and Science. Yagmur Karakus is acknowledged for her contribution to this work.References
- Y. Wang, K. S. Chen, J. Mishler, S. C. Cho and X. C. Adroher, Appl. Energy, 2011, 88, 981–1007 CrossRef CAS PubMed.
- R. D. Cortright, R. R. Davda and J. A. Dumesic, Nature, 2002, 418, 964–967 CrossRef CAS PubMed.
- J. W. Shabaker, R. R. Davda, G. W. Huber, R. D. Cortright and J. A. Dumesic, J. Catal., 2003, 215, 344–352 CrossRef CAS.
- G. W. Huber and J. A. Dumesic, Catal. Today, 2006, 111, 119–132 CrossRef CAS PubMed.
- N. C. Juben, W. H. George and A. D. James, Angew. Chem., Int. Ed., 2007, 46, 7164–7183 CrossRef PubMed.
- D. O. Özgür and B. Z. Uysal, Biomass Bioenergy, 2011, 35, 822–826 CrossRef PubMed.
- S. Kandoi, J. Greeley, D. Simonetti, J. Shabaker, J. A. Dumesic and M. Mavrikakis, J. Phys. Chem. C, 2011, 115, 961–971 CAS.
- R. R. Davda, J. W. Shabaker, G. W. Huber, R. D. Cortright and J. A. Dumesic, Appl. Catal., B, 2005, 56, 171–186 CrossRef CAS PubMed.
- G. W. Huber, J. W. Shabaker, S. T. Evans and J. A. Dumesic, Appl. Catal., B, 2006, 62, 226–235 CrossRef CAS PubMed.
- G. W. Huber, R. D. Cortright and J. a. Dumesic, Angew. Chem., Int. Ed., 2004, 43, 1549–1551 CrossRef CAS PubMed.
- L. Vilcocq, A. Cabiac, C. Especel, S. Lacombe and D. Duprez, Catal. Today, 2012, 189, 117–122 CrossRef CAS PubMed.
- D. J. M. de Vlieger, B. L. Mojet, L. Lefferts and K. Seshan, J. Catal., 2012, 292, 239–245 CrossRef CAS PubMed.
- G. Wen, Y. Xu, Z. Xu and Z. Tian, Catal. Commun., 2010, 11, 522–526 CrossRef CAS PubMed.
- A. Yousuf, Waste Manage., 2012, 32, 2061–2067 CrossRef CAS PubMed.
- S. Murat Sen, C. A. Henao, D. J. Braden, J. A. Dumesic and C. T. Maravelias, Chem. Eng. Sci., 2012, 67, 57–67 CrossRef CAS PubMed.
- S. G. Wettstein, D. M. Alonso, E. I. Gürbüz and J. a. Dumesic, Curr. Opin. Chem. Eng., 2012, 1, 218–224 CrossRef CAS PubMed.
- J. W. Han and H. Lee, Catal. Commun., 2012, 19, 115–118 CrossRef CAS PubMed.
- R. R. Davda and J. a. Dumesic, Chem. Commun., 2004, 36–37 RSC.
- J. H. Yang, H.-J. Kim, D. H. Chun, H.-T. Lee, J.-C. Hong, H. Jung and J.-I. Yang, Fuel Process. Technol., 2010, 91, 285–289 CrossRef CAS PubMed.
- A. N. Tsoligkas, M. Simmons, J. Wood and C. Frost, Catal. Today, 2007, 128, 36–46 CrossRef CAS PubMed.
- M. T. Kreutzer, F. Kapteijn, J. A. Moulijn and J. J. Heiszwolf, Chem. Eng. Sci., 2005, 60, 5895–5916 CrossRef CAS PubMed.
- P. Angeli and A. Gavriilidis, Proc. Inst. Mech. Eng., Part C, 2008, 222, 737–751 CrossRef CAS.
- M. J. F. Warnier, M. H. J. M. Croon, E. V. Rebrov and J. C. Schouten, Microfluid. Nanofluid., 2009, 8, 33–45 CrossRef.
- M. T. Kreutzer, P. Du, J. J. Heiszwolf, F. Kapteijn and J. A. Moulijn, Chem. Eng. Sci., 2001, 56, 6015–6023 CrossRef CAS.
- E. V. Rebrov, A. Berenguer-Murcia, A. E. H. Wheatley, B. F. G. Johnson and J. C. Schouten, Chim. Oggi, 2009, 27, 4–7 CAS.
- N. Shao, W. Salman, A. Gavriilidis and P. Angeli, Int. J. Heat Fluid Flow, 2008, 29, 1603–1611 CrossRef CAS PubMed.
- M. F. N. D'Angelo, V. Ordomsky, V. Paunovic, J. van der Schaaf, J. C. Schouten and T. A. Nijhuis, ChemSusChem, 2013 DOI:10.1002/cssc.201200974.
- T. Jiang, T. Wang, L. Ma, Y. Li, Q. Zhang and X. Zhang, Appl. Energy, 2012, 90, 51–57 CrossRef CAS PubMed.
- A. V. Kirilin, A. V. Tokarev, L. M. Kustov, T. Salmi, J.-P. Mikkola and D. Y. Murzin, Appl. Catal., A, 2012, 435–436, 172–180 CrossRef CAS PubMed.
- V. V. Renade, R. V. Chaudgari and P. R. Gunjal, Trickle Bed Reactors, Elsevier, 2011, p. 285 Search PubMed.
- N. Wakao, S. Kaguei and T. Funazkri, Chem. Eng. Sci., 1979, 34, 325–336 CrossRef CAS.
- E. Crezee, Appl. Catal., A, 2003, 251, 1–17 CrossRef CAS.
- P. H. Brahme and K. Doralswamy, Ind. Eng. Chem. Process Des. Dev., 1976, 15, 130 CAS.
- M. Banu, P. Venuvanalingam, R. Shanmugam, B. Viswanathan and S. Sivasanker, Top. Catal., 2012, 55, 897–907 CrossRef CAS.
- R. Weingarten, G. A. Tompsett, W. C. Conner Jr and G. W. Huber, J. Catal., 2011, 279, 174–182 CrossRef CAS PubMed.
- D. L. King, L. Zhang, G. Xia, A. M. Karim, D. J. Heldebrant, X. Wang, T. Peterson and Y. Wang, Appl. Catal., B, 2010, 99, 206–213 CrossRef CAS PubMed.
- E. V. Rebrov, J. C. Schouten and M. H. J. M. de Croon, Chem. Eng. Sci., 2011, 66, 1374–1393 CrossRef CAS PubMed.
- M. Al-Rawashdeh, J. Zalucky, C. Müller, T. A. Nijhuis, V. Hessel and J. C. Schouten, Ind. Eng. Chem. Res., 2013 DOI:10.1021/ie4009277.
| This journal is © The Royal Society of Chemistry 2013 |

