Electrocatalytic effect of ZnO nanoparticles on reduction of nitroaromatic compounds
Her Shuang
Toh
,
Adriano
Ambrosi
and
Martin
Pumera
*
Division of Chemistry & Biological Chemistry, School of Physical & Mathematical Sciences, Nanyang Technological University, Singapore 637371, Singapore. E-mail: pumera@ntu.edu.sg
First published on 20th August 2012
Abstract
Nitroaromatic compounds have garnered a lot of attention due to their wide applications in military and industrial fields. Electrochemical techniques can be applied for sensing these compounds due to their electrochemical activity. Electrocatalytic reduction of nitroaromatic explosives was shown previously on silver nanoparticles and graphene based surfaces. Here, we demonstrate electrocatalytic reduction of explosives on zinc oxide nanoparticles. Nitroaromatic explosives were tested using glassy carbon electrodes modified with zinc or zinc oxide nanoparticles to study the catalytic effects on the electrochemical reduction of the nitroaromatic compounds with the aim of improving the sensitivity of their detection. A zinc oxide nanoparticle modified electrode has shown favourable improvement in peak height and hence greater sensitivity compared to bare glassy carbon electrodes and zinc nanoparticle modified electrodes.
1 Introduction
In recent years, nitroaromatic compounds have gathered a lot of attention, especially in terms of national security and defense applications.1–7 Nitroaromatic compounds make up a significant proportion of explosives used by military as well as militants.8,9 Their wide application in the military and defense industries can contaminate and pollute the environment as their disposal can lead to severe contamination of ground water.10–13 They pose a serious threat to human health.14–16 They, in fact, possess toxic properties acting as mutagens or carcinogens. Therefore, it is crucial to develop methods and devices able to sensitively and rapidly detect nitroaromatic compounds. Nitroaromatic compounds are electrochemically active17–19 since they possess nitro functionalities that can be fully reduced to amine compounds or partially reduced to nitroso or hydroxylamine derivatives.17,20 Thus, electrochemical methods are excellent candidates for a sensitive detection of nitroaromatic compounds by monitoring their reduction signals. Some advantages which electrochemical methods offer include fast detection, low-cost instrumentation and the potential to develop portable, on-site analytical devices. Such characteristics grant electrochemical methods an edge over other conventional methods such as liquid chromatography due to the fact that they require costly instrumentation, highly specialized operators and relatively time consuming analysis.7,21,22Traditionally, metals act as reducing reagents by donating electrons. They are often used as catalysts in synthetic reactions.23 Metals such as iron, zinc and tin are popular catalysts in synthetic organic reactions.24,25 Metal nanoparticles, like silver, have also been used to promote the reduction of nitroaromatic compounds.26,27 Other previous works have also employed non-metallic materials with high surface area such as graphene and carbon nanotubes to encourage the adsorption effect, obtaining enhanced reduction signals of nitroaromatic compounds.2,28 Zinc and zinc-based derivatives have been successfully adopted in organic synthetic reactions with the aim of reducing nitro groups specifically.29,30
Here, we investigate the catalytic properties of zinc and zinc oxide nanoparticles, towards electrocatalytic reduction of nitroaromatic compounds aiming to develop a fast and sensitive electrochemical sensor.
2 Experimental
2.1 Reagents
2-Nitrotoluene (2-NT), 4-amino-2-nitrotoluene (4-A-2NT) and zinc oxide nanoparticles (40% in water, colloidal dispersion) were obtained from Alfa Aesar (Ward Hill, MA). 2,6-Dinitrotoluene (2,6-DNT) was obtained from Fluka Analytical (St. Louis, MC). Trinitrotoluene (TNT) was obtained from Supelco Analytical (Bellefonte, PA) as analytical standard in diluted form (1000 ppm) and used as received. 2,4-Dinitrotoluene (2,4-DNT), zinc nanopowder, sodium diphosphate salt and sodium tetraborate decahydrate were obtained from Sigma Aldrich (St. Louis, MO). Acetonitrile and N,N-dimethylformamide (DMF) were obtained from Merck (Singapore).2.2 Apparatus
All electrochemical experiments were performed using an μAutolab type III instrument (Eco Chemie BV, Utrecht, The Netherlands) connected to a personal computer and controlled by General Purpose Electrochemical Systems v. 4.9 software. The experiments were carried out at room temperature using a three-electrode configuration in a 10 mL glass cell. Glassy carbon electrode (3 mm in diameter), platinum auxiliary electrode and Ag/AgCl (with porous Teflon tip) reference were obtained from CH Instruments (Austin, TX). Prior to measurement, the glassy carbon electrode was polished to obtain a mirror finish with 0.05 μm alumina on a polishing pad. X-ray photoelectron spectroscopy (XPS) was performed using a Phoibos 100 spectrometer and a monochromatic Mg X-ray source (SPECS, Germany). Relative sensitivity factors were used to evaluate C/O ratios from wide spectra XPS measurements. XPS samples were prepared by coating carbon tape with a uniform layer of material. Scanning electron microscopy/X-ray Energy Dispersive analysis (SEM/EDS) was performed on a JEOL-7600F semi-in-lens FE-SEM.2.3 Procedures and electrochemical studies
Zinc nanopowder and zinc oxide nanoparticles were prepared in solutions of 1 mg mL−1 with DMF. 1 μL of metal solution was drop cast onto a clean GCE and left to dry under a lamp to obtain a modified GCE.2-NT, 2,4-DNT, 2,6-DNT and 4-A-2-NT were prepared in 1000 ppm solution with acetonitrile. CV was performed with a sample solution of 8 mL buffer consisting of 20 ppm of nitroaromatic compound. DPV was performed with a sample solution of 8 mL buffer consisting of 4, 8, 12, 16 or 20 ppm of nitroaromatic compound.
All CV experiments were carried out at a scan rate of 100 mV s−1. All DPV experiments were carried out at a step potential of 5 mV and a modulation amplitude of 25 mV.
3 Results and discussion
3.1 Cyclic voltammetry analysis
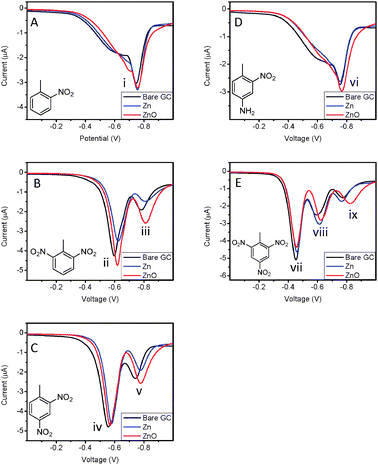
Cyclic voltammetry (CV) was performed on three different types of electrodes – bare glassy carbon electrode (GCE), zinc nanoparticle modified GCE (Zn-GCE) and zinc oxide nanoparticle modified GCE (ZnO-GCE) to determine if the modified electrodes perform differently from bare GCE. Fig. 1 shows the cyclic voltammograms of nitroaromatic compounds, 2-nitrotoluene (2-NT) (A), 2,6-dinitrotoluene (2,6-DNT) (B), 2,4-dinitrotoluene (2,4-DNT) (C), 4-nitro-2-aminotoluene (4-A-2-NT) (D) and trinitrotoluene (TNT) (E). Generally, the number of reduction peaks corresponds to the number of nitro groups present in the compound if all six electrons responsible for reducing the amino group to amine are transferred in a single six electron wave under alkaline conditions.31,32 | ||
| Fig. 1 Cyclic voltammograms of 2-NT (A), 2,6-DNT (B), 2,4-DNT (C), 4-A-2-NT (D) and TNT (E). Conditions: 20 mM borate buffer, pH 9.3; scan rate of 100 mV s−1. Concentration of nitroaromatic compounds: 20 ppm. | ||
Fig. 1A shows that 2-NT has two reduction signals at (i) −781 mV and (ii) −1166 mV for a bare GCE system. In a zinc nanoparticle modified GCE (Zn-GCE) system, 2-NT has reduction peaks at (i) −801 mV and (ii) −1100 mV. With a zinc oxide nanoparticle modified GCE (ZnO-GCE) system, 2-NT has only one reduction signal at (i) −853 mV. Upon comparing the reduction peak (i), the improvement in the peak height of Zn-GCE was 51% and of ZnO-GCE was 117% when compared to a bare GCE system. Fig. 1B depicts that reduction of 2,6-DNT with a bare GCE system was (iii) −668 mV, (iv) −847 mV and (v) −1230 mV. With Zn-GCE, it was (iii) −674 mV and (iv) −851 mV. With ZnO-GCE, it was (iii) −676 mV and (iv) −938 mV. The height difference in peak (iv) was −27% in Zn-GCE and 288% in ZnO-GCE with regard to a bare GCE system. In Fig. 1C, the reduction of 2,4-DNT with a bare GCE system gave signals occurring at (vi) −623 mV and (vii) −810 mV. With Zn-GCE, signals occurred at (vi) −636 mV and (vii) −834 mV. With ZnO-GCE, signals were observed at (vi) −641 mV and (vii) −882 mV. Compared with the bare GCE peak (vii), the Zn-GCE peak height dropped by 20% while the ZnO-GCE peak height increased by 190%. Fig. 1D shows that 4-A-2-NT with the bare GCE system, Zn-GCE and ZnO-GCE was reduced at peaks (viii) −848 mV, −875 mV and −894 mV respectively. When compared to a bare GCE system, the improvement in peak current was 7% and 34% in Zn-GCE and ZnO-GCE respectively. Fig. 1E depicts that TNT reduction occurred at (ix) −515 mV, (x) −690 mV and (xi) −924 mV in a bare GCE system. TNT reduction signals were at (ix) −516 mV, (x) −703 mV and (xi) −939 mV in the Zn-GCE system. For the ZnO-GCE system, signals were observed at (ix) −531 mV, (x) −719 mV and (xi) −916 mV. Comparing peaks (xi) across all systems, Zn-GCE gave a 12% increase in peak height and ZnO-GCE gave a 333% increment compared to the bare GCE system.
In the ZnO-GCE system, the reduction signal at the most negative potential has a greater peak width and higher peak height when compared to a bare GCE system and a Zn-GCE system. However, the rest of the reduction peak heights in ZnO-GCE were comparable to that in the other two systems. This may be due to the catalytic effect that zinc oxide nanoparticles have on nitroaromatic reduction. The adsorption effect should not be accountable for improvement in performance linked to zinc oxide nanoparticles as only particular peaks were higher than the bare GCE system. On the other hand, Zn-GCE did not improve the system sensitivity by a large margin compared to the bare GCE system.
We performed materials analysis of the bare electrode surface, ZnO NPs modified surfaces before and after the CV voltammetric study. From SEM/EDS morphological and elemental analysis (Fig. 2) it is clear that there are no observable changes in the electrocatalyst surface and this electrocatalyst does not undergo changes. Survey XPS analysis was performed as well to identify the presence of Zn at the surface of the electrode before and after electrochemical experiments (Fig. 3). Spectra of the ZnO NPs modified electrodes present the characteristic signal of Zn2p at binding energy of 1022.1 eV. XPS confirmed the SEM/EDS observation that the catalyst is present at the surface of the electrode and does not undergo any changes.
 | ||
| Fig. 2 SEM/EDS analysis of the bare electrode surface (A), ZnO NPs modified surface before (B) and after (C) cyclic voltammetric analysis. | ||
 | ||
| Fig. 3 XPS analysis of the bare electrode surface (A), ZnO NPs modified surface before (B) and after (C) cyclic voltammetric analysis. | ||
3.2 Effect of pH
In order to investigate the effect of pH on electrocatalytic behavior of zinc oxide nanoparticles, cyclic voltammograms of 2,4-DNT were obtained using a bare GCE system and ZnO-GCE at three different pH (4.1, 7.0 and 9.3) values. The typical cyclic voltammograms are shown in Fig. 4. With ZnO-GCE, the height increment of peak (vi) compared to the bare GCE system observed in Fig. 4C was not observed at pH 4.1 (Fig. 4A) and pH 7.0 (Fig. 4B). Instead, the heights of peaks (i), (ii), (iii) and (iv) in a bare GCE system and a ZnO-GCE system were similar at pH 4.1 and pH 7.0. If zinc oxide nanoparticles catalyse the reduction of nitroaromatic compounds, the catalytic effect was only observed under alkaline conditions. | ||
| Fig. 4 Cyclic voltammograms of 2,4-DNT at different pHs. 50 mM PBS buffer, pH 4.1 (A), 50 mM PBS buffer, pH 7.0 (B), 20 mM borate buffer, pH 9.3 (C) Conditions: scan rate of 100 mV s−1. Concentration of 2,4-dinitrotoluene: 20 ppm. | ||
For nitroaromatic compounds containing more than one nitro group, the reduction signal with a lower reducing potential has a smaller peak current compared to the reduction signal with a higher reducing potential under acidic conditions. The inverse is observed under basic conditions. It is also noted that an increase in pH results in a general increment of peak potentials.19
3.3 Differential pulse voltammetry analysis
Differential pulse voltammetry (DPV) was performed on the five different nitroaromatic compounds using three different electrode systems at five different concentrations (4, 8, 12, 16 and 20 ppm). Calibration curves for each compound are shown in Fig. 5. Table 1 summarizes the key features of the calibration curves. Fig. 6 displays the typical differential pulse voltammograms obtained for each compound at a concentration of 20 ppm. Calibration curves were based on the signal at the most negative potential. | ||
| Fig. 5 Concentration dependence of 2-NT (A), 2,6-DNT (B), 2,4-DNT (C), 4-A-2-NT (D) and TNT (E). Conditions: 20 mM borate buffer, pH 9.3; scan rate of 100 mV s−1. | ||
| 2-NT | 2,6-DNT | 2,4-DNT | ||||
|---|---|---|---|---|---|---|
| Electrode | Sensitivity (nA ppm−1) | R 2 | Sensitivity (nA ppm−1) | R 2 | Sensitivity (nA ppm−1) | R 2 |
| Bare GCE | 73.6 | 0.975 | 44.2 | 0.975 | 63.5 | 0.938 |
| Zn-GCE | 78.7 | 0.975 | 19.5 | 0.951 | 45.8 | 0.985 |
| ZnO-GCE | 70.8 | 0.845 | 66.9 | 0.992 | 73.1 | 0.943 |
| 4-A-2-NT | TNT | |||
|---|---|---|---|---|
| Electrode | Sensitivity (nA ppm−1) | R 2 | Sensitivity (nA ppm−1) | R 2 |
| Bare GCE | 49.1 | 0.926 | 34.2 | 0.973 |
| Zn-GCE | 56.6 | 0.988 | 33.1 | 0.991 |
| ZnO-GCE | 78.1 | 0.901 | 46.7 | 0.996 |
 | ||
| Fig. 6 Differential pulse voltammograms of 2-NT (A), 2,6-DNT (B), 2,4-DNT (C), 4-A-2-NT (D) and TNT (E). Conditions: 20 mM borate buffer, pH 9.3; scan rate of 100 mV s−1. Concentration of nitroaromatic compounds: 20 ppm. | ||
For 2-NT, the calibration curves were plotted based on peak (i). At the same concentration, the peak height is the greatest in ZnO-GCE, then Zn-GCE and followed by the bare GCE system. The slope of the calibration curve is at around 75 nA ppm−1 for all three systems. For 2,6-DNT, peak (iii) was used to plot the calibration curves. At a concentration of 4 ppm, all three systems gave similar signals. However, the slope of the three systems differs greatly and the ZnO-GCE's slope (66.8 nA ppm−1) is 1.5 times greater than that of the bare GCE system (44.2 nA ppm−1) and twice that of Zn-GCE (19.5 nA ppm−1). ZnO-GCE also gave the best R2 value of 0.992 out of the three systems. In the calibration plots of 2,4-DNT, peak (v) was used for calculation. ZnO-GCE (73.1 nA ppm−1) has a slightly steeper slope than the bare GCE system (63.5 nA ppm−1) and ZnO-GCE gave a greater signal than the bare GCE system and Zn-GCE system at all concentrations. Zn-GCE has a gentler slope (45.8 nA ppm−1) and signal height around the bare GCE system. For 4-A-2-NT, the calibration curve was based on peak (vi). ZnO-GCE gives the best slope (78.1 nA ppm−1) and highest signals at all concentrations. However, it also has the lowest R2 of 0.901. The bare GCE system and Zn-GCE system give slopes of 49.1 nA ppm−1 and 56.6 nA ppm−1 respectively. The TNT calibration curve was plotted based on peak (ix). Both Zn-GCE and ZnO-GCE give a R2 greater than 0.99. ZnO-GCE gives the highest slope (46.7 nA ppm−1) out of the three systems (bare GCE system: 34.2 nA ppm−1 and Zn-GCE: 33.1 nA ppm−1). ZnO also performed the best by giving the highest peak height at all concentrations. Generally, ZnO is the system with the steepest slope and highest signals at all concentrations.
4 Conclusion
The electrocatalytic effect of ZnO and Zn nanoparticles on five nitroaromatic compounds has been studied. Cyclic voltammetry with a zinc oxide nanoparticle modified glassy carbon electrode has shown an increase in peak height for the reduction signal at the most negative potential. Calibration of the five compounds also showed that the zinc oxide modified GCE gave a larger signal and greater sensitivity towards reduction signals at the most negative potential compared to the bare GCE and zinc nanoparticle modified GCE. Our findings will have profound influence on construction of electrochemical detection devices.Acknowledgements
M.P. thanks MINDEF-NTU-JPP-11-02-06 from Ministry of Defense, Singapore. We wish to acknowledge the funding support for this project from Nanyang Technological University under the Undergraduate Research Experience on Campus (URECA) programme.References
- A. Agrawal and P. Tratnyek, Environ. Sci. Technol., 1996, 30, 153 CrossRef CAS.
- J. Wang, B. Hocevar and B. Ogorevc, Electrochem. Commun., 2004, 6, 176 CrossRef CAS.
- S. Hrapovic, E. Majid, Y. Liu, K. Male, J. H. T. Luong and F. S. Shen, Anal. Chim. Acta, 2006, 78, 5504 CAS.
- J. Zang, C. X. Gui, F. Hu, L. Yu and C. M. Li, Anal. Chim. Acta, 2011, 683, 187 CrossRef CAS.
- C. X. Guo, Y. Lei and C. M. Li, J. Electroanal. Chem., 2011, 23, 885 CAS.
- M. Boronat, P. Concepcion, A. Corma, S. González, F. Illas and P. Serna, J. Am. Chem. Soc., 2007, 129, 16230 CrossRef CAS.
- J. Wang, J. Electroanal. Chem., 2007, 4, 415 Search PubMed.
- M. Pumera, Electrophoresis, 2006, 27, 244 CrossRef CAS.
- D. Royds, S. W. Lewis and A. M. Taylor, Talanta, 2005, 67, 262 CrossRef CAS.
- M. Galik, A. M. O'Mahony and J. Wang, Electroanalysis, 2011, 23, 1193 CrossRef CAS.
- D. R. S. Lima, M. L. S. Bezerra, E. B. Neves and F. R. Moreira, Rev. Environ. Health, 2011, 26, 101 CrossRef.
- H. I. F. Amaral, J. Fernandes, M. Berg, R. P. Schwarzenbach and R. Kipfer, Chemosphere, 2009, 77, 805 CrossRef CAS.
- R. C. Stringer, S. Gangopadhyay and S. A. Grant, Anal. Chem., 2010, 82, 4015 CrossRef CAS.
- S. Hrapovic, E. Majid, Y. Liu, K. Male and J. H. T. Luong, Anal. Chem., 2006, 78, 5504 CrossRef CAS.
- A. Hilmi and J. H. T. Luong, Environ. Sci. Technol., 2000, 34, 3046 CrossRef CAS.
- T. Shimada, C. L. Hayes, H. Yamazaki, S. Amin, S. S. Hecht, F. P. Guengerich and T. R. Sutter, Cancer Res., 1996, 56, 2979 CAS.
- K. Bratin, P. T. Kissinger, R. C. Briner and C. S. Bruntlett, Anal. Chim. Acta, 1981, 130, 295 CrossRef CAS.
- C. K. Chua, M. Pumera and L. Rulí
![[s with combining breve]](https://www.rsc.org/images/entities/char_0073_0306.gif) ek, J. Phys. Chem. C, 2012, 116, 4243 CAS.
ek, J. Phys. Chem. C, 2012, 116, 4243 CAS. - C. K. Chua and M. Pumera, Electroanalysis, 2011, 23, 2350 CrossRef CAS.
- S. Coffey, E. H. Rodd, M. F. Ansell and M. Sainsbury, Rodd's Chemistry of Carbon Compounds: Topical Volumes and Cumulative Index: Organic Electrochemistry, Elsevier Science B. V., Amsterdam, The Netherlands, 2nd edn, 2002 Search PubMed.
- N. L. Rosi and C. A. Mirkin, Chem. Rev., 2005, 105, 1547 CrossRef CAS.
- V. Berry, A. Gole, S. Kundu, C. J. Murphy and R. F. Saraf, J. Am. Chem. Soc., 2005, 127, 17600 CrossRef CAS.
- P. Atkins, Physical Chemistry, W.H. Freeman and Company, New York, 6th edn, 1997 Search PubMed.
- M. Hudlický, Reductions in Organic Chemistry, Ellis Horwood, Chichester, 1984 Search PubMed.
- M. B. Smith, J. March, March's Advanced Organic Chemistry, John Wiley & Sons, Inc., Hoboken, New Jersey, 6th edn, 2007 Search PubMed.
- X. Lu, H. Qi, X. Zhang, Z. Xue, J. Jin, Y. Zhou and X. Liu, Chem. Commun., 2011, 47, 12494 RSC.
- G. Maduraiveeran and R. Ramaraj, Anal. Chem., 2009, 81, 7550 CrossRef.
- M. S. Goh and M. Pumera, Anal. Bioanal. Chem., 2011, 399, 127 CrossRef CAS.
- T. Tsukinoki and H. Tsuzuki, Green Chem., 2001, 3, 37 RSC.
- H. Jiang and Y. Dong, Chin. J. Chem., 2008, 26, 1407 CrossRef CAS.
- H. Shindo and C. J. Nishihara, J. Electroanal. Chem., 1989, 263, 415 CrossRef CAS.
- P. Martigny and J. Simonett, J. Chem. Soc., Perkin Trans. 2, 1990, 759 Search PubMed.
| This journal is © The Royal Society of Chemistry 2013 |