 Open Access Article
 This Open Access Article is licensed under a
 Creative Commons Attribution 3.0 Unported Licence
Chemical reactivity and long-range transport potential of polycyclic aromatic hydrocarbons – a review†
Ian J.
Keyte
a,
Roy M.
Harrison‡
*a and
Gerhard
Lammel
bc
aDivision of Environmental Health & Risk Management, School of Geography, Earth & Environmental Sciences, University of Birmingham, Edgbaston, Birmingham B15 2TT, UK. E-mail: r.m.harrison@bham.ac.uk; Fax: +44 (0)121 414 3709; Tel: +44 (0)121 414 3494
bMax Planck Institute for Chemistry, Hahn-Meitner-Weg 1, 55128 Mainz, Germany
cMasaryk University, Research Centre for Toxic Compounds in the Environment, Kamenice 5, 62500 Brno, Czech Republic
First published on 30th September 2013
Abstract
Polycyclic aromatic hydrocarbons (PAHs) are of considerable concern due to their well-recognised toxicity and especially due to the carcinogenic hazard which they present. PAHs are semi-volatile and therefore partition between vapour and condensed phases in the atmosphere and both the vapour and particulate forms undergo chemical reactions. This article briefly reviews the current understanding of vapour–particle partitioning of PAHs and the PAH deposition processes, and in greater detail, their chemical reactions. PAHs are reactive towards a number of atmospheric oxidants, most notably the hydroxyl radical, ozone, the nitrate radical (NO3) and nitrogen dioxide. Rate coefficient data are reviewed for reactions of lower molecular weight PAH vapour with these species as well as for heterogeneous reactions of higher molecular weight compounds. Whereas the data for reactions of the 2–3-ring PAH vapour are quite extensive and generally consistent, such data are mostly lacking for the 4-ring PAHs and the heterogeneous rate data (5 and more rings), which are dependent on the substrate type and reaction conditions, are less comprehensive. The atmospheric reactions of PAH lead to the formation of oxy and nitro derivatives, reviewed here, too. Finally, the capacity of PAHs for long range transport and the results of numerical model studies are described. Research needs are identified.
 Ian J. Keyte | Ian Keyte is a doctoral researcher in the Division of Environmental Health and Risk Management at the University of Birmingham. He has previously gained a BSc in Environmental Chemistry from Lancaster University and an MSc in Green Chemistry and Industrial Technology from the University of York. His research focuses on the sources, atmospheric behaviour and fate of polycyclic aromatic hydrocarbons (PAHs) and their oxygenated and nitrated derivative compounds. This approach involves using atmospheric measurements in combination with chemical kinetics data to assess the contribution of photochemical reactivity of PAHs to observed levels of oxy- and nitro-PAH. |
 Roy M. Harrison | Roy Harrison has held the position of Queen Elizabeth II Birmingham Centenary Professor of Environmental Health at the University of Birmingham, UK, since 1991, and has recently also been appointed as Distinguished Adjunct Professor at King Abdulaziz University, Saudi Arabia. Roy's research interests are in air pollution, especially airborne particulate matter. This includes studies of particles from emissions, through atmospheric transformations to human exposure and effects on human health. In recognition of his government advisory work, he was appointed an Officer of the Order of the British Empire (OBE) in the 2004 New Year Honours List. |
 Gerhard Lammel | Gerhard Lammel is a senior scientist at the Max Planck Institute (MPI) for Chemistry, Mainz, Germany, and a professor of Environmental Chemistry at Masaryk University, Brno, Czech Republic. He studied chemistry at the Universities of Regensburg and Freiburg, Germany, received his PhD from University of Mainz 1988 and his Habilitation from University of Hohenheim, Stuttgart, 2000. He was a research scientist at the Karlsruhe Research Centre, Germany, the Lawrence Berkeley Laboratory, USA, and the MPI for Meteorology, Hamburg. In his research he has been focusing on atmospheric and aerosol chemistry through field and laboratory experimental studies and multicompartmental chemistry of semivolatile organics through modelling and field studies. |
Extended summary
Polycyclic aromatic hydrocarbons (PAHs) are a class of organic compounds characterised by the presence of fused aromatic rings. Their ubiquitous presence in the environment is of major concern due to the carcinogenicity of a number of specific PAH compounds (congeners). The European Union has set an indicative limit value of 1 ng m−3 of benzo[a]pyrene used as a marker for the typically complex mixture of congeners. While elevated concentrations of atmospheric PAHs are encountered in the vicinity of major sources, observations from remote sites indicate long-range transport. In this context, the atmospheric chemistry of PAHs is of particular importance as this has a major influence upon their atmospheric lifetime and hence distribution in the environment.PAHs are generated mainly as by-products of incomplete combustion processes. Consequently, their sources include domestic burning of coal and wood for heating and cooking; fossil and biomass fuel burning power plants; industrial processes; and road transport. Globally, the combustion of biofuels and wildfires are major sources, while road traffic and specific industries frequently dominate urban emissions.
PAHs range from naphthalene (two aromatic rings) which under ambient conditions exists almost entirely as vapour through to compounds with six or more aromatic rings which partition almost entirely into the particulate phase. The majority of compounds, and especially those with three or four rings, are considered as semi-volatile and such compounds partition between the vapour and particle phases in the atmosphere. These compounds can deposit to surface water and soils where they have a long lifetime but subsequently re-evaporate to the atmosphere. Much of the soil PAH in temperate regions is historic and concentrations in air and soil are relaxing to equilibrium on various time scales. Vapour–particle partitioning of PAH can be quantified through the gas–particle partitioning coefficient. This is influenced by both adsorption and absorption processes and is strongly temperature-dependent; hence a seasonal variation in partitioning is typically observed. Quantitative analysis of the partitioning process suggests that it can be described by the sum of the absorptive process as indicated by the octanol–air partition coefficient and the adsorptive process as described by the soot–air partitioning coefficient. Modes in the mass size distribution for PAH are typically within the ultrafine (less than 0.1 μm) and accumulation (0.1–1 μm) ranges of aerodynamic diameter, but mass size distributions can be transient and measurement is rendered difficult by artefacts in the measurement process caused by PAH semi-volatility. Fast and sensitive in situ measurement techniques are not available.
Dry deposition is more effective than wet deposition as a removal process from the atmosphere. Chemical reactions provide the other main sink for atmospheric PAHs. The gas phase reactions of PAHs with the OH radical, the NO3 radical and ozone have been widely investigated. Available rate coefficient data are most abundant in the case of the OH radical. The established mechanism of PAH reactions with the OH radical involves the formation of a PAH–OH adduct followed by further reaction with NO2 or O3. The observed reaction products include both ring-retaining nitro-PAHs and quinones, as well as ring-opened products such as phthalic acid, phthalaldehyde and phthalic anhydride. The presence of methyl groups in methyl naphthalenes and methyl phenanthrenes in most cases leads to a modest increase in reactivity relative to the parent PAH. For NO3 reactions, the predominant reaction pathway involves NO3 addition followed by reaction with NO2 leading to nitro-PAH formation. The observed rate coefficients are proportional to the nitrogen dioxide concentration. There have been far fewer studies of the gas phase reactions of PAH with ozone.
The main atmospheric sink for gas phase PAHs appears to be reaction with the OH radical, with rate coefficients for these reactions up to five orders of magnitude greater than for the corresponding reactions with NO3 for most three to four ring PAHs. While NO3 reactions appear to be less significant than OH reactions as a PAH degradation process, considerably higher nitro-PAH yields suggest that nighttime reactions of PAHs with NO3 may be a significant contributor of these compounds in the atmosphere, in addition to daytime OH reactions. Reactions of PAHs with ozone are considered to be of negligible importance in the atmosphere. For many atmospherically relevant substances the available data are insufficient.
Given the predominant association of many PAHs with the particulate phase, heterogeneous reactions of a number of PAHs adsorbed on a number of solid substrates have been extensively studied. Reaction substrates include both carbonaceous aerosol (graphite, diesel exhaust, kerosene flame soot, ethylene flame soot) and mineral particles (silica and MgO). Reactions have been studied for OH, N2O5/NO3 and O3 and rates have been shown to depend not only upon the reactant but also upon the nature of the substrate. Reactions with nitrogen dioxide have also been shown to proceed at a significant rate for some PAHs. For semi-volatile PAHs (mostly three to four ring compounds), comparisons between the rates of homogeneous and heterogeneous reactions can be made. In the case of the hydroxyl radical, PAH reactions on carbonaceous particle surfaces are one to three orders of magnitude lower than those derived for gas phase reactions. The presence of a plateau in the experimental decays of PAHs in the reactions of OH indicates that a significant fraction of PAH is unavailable for reaction. However, in the case of ozone, studies of PAH absorbed on graphite and silica substrates show heterogeneous processes to be approximately two orders of magnitude faster than those of the corresponding gas phase reactions.
Estimation of reaction rates in the atmosphere using typical concentrations of atmospheric oxidants indicates that the gas phase reaction with OH remains the dominant loss process for most PAHs studied so far but that heterogeneous reactions with nitrogen dioxide and ozone may be of some importance. However, field measurements, particularly from remote sites, and recent laboratory experiments suggest the stabilisation of particle-associated PAHs in the atmosphere, probably due to incorporation in a particle matrix which limits their accessibility to atmospheric oxidants. A number of ring-opened and ring-retaining products have been identified from these heterogeneous reactions including nitro-PAHs and quinones. In some cases a difference has been noted between heterogeneous and gas-phase reaction products.
Long-range atmospheric transport of PAHs has been studied through both atmospheric measurements and numerical modelling. PAHs show a global distribution with appreciable concentrations observed at sites within the Arctic. Models suggest that atmospheric half-lives of 3–5 ring PAHs are of the order of hours or days, but vary considerably amongst model studies. Since there is significant uncertainty in emissions inventories and the processes determining gas–particle partitioning, and models include different processes (e.g. most models neglect revolatilisation from surfaces), model predictions currently have a high degree of uncertainty.
The role of atmospheric reactivity in influencing the observed levels of oxy- and nitro-PAH compounds relative to primary emissions has been investigated using atmospheric measurements. Differences in the reaction mechanism between primary combustion emissions and gas-phase decomposition of PAH have been shown to result in differences in nitro-PAH isomer distributions. Ratios of oxy- and nitro-PAHs to their parent PAHs have also been used to assess the importance of atmospheric reactions in influencing the concentrations of these compounds.
Measurements of temporal (daily, seasonal and diurnal) variations in the concentrations of PAHs and their oxy- and nitro-derivatives have been used to evaluate the reactivity of PAHs and the formation of derivative compounds. Such studies have also been used to determine the atmospheric oxidants having the greatest impact on the atmospheric chemistry of PAH. In the case of low molecular weight compounds reacting predominantly in the vapour phase, some studies have shown a good agreement between atmospheric observations and predictions based upon laboratory kinetic data. A full analysis of atmospheric processing of PAH is limited by the limited current knowledge of the atmospheric reactivity and reaction products of the nitro- and oxy-derivatives of PAH.
1. Introduction
Polycyclic aromatic hydrocarbons (PAHs) are a group of compounds with proven carcinogenicity. Although the carcinogenic potency varies greatly between congeners,1,2 they are generally emitted to the atmosphere as a mixture which presents a substantial toxic hazard. Levels in the atmosphere are almost everywhere dominated by combustion sources, while aluminium and iron and steel production as well as petrogenic sources are significant in some environments.3 The World Health Organisation recommends guidelines in terms of a carcinogenic slope factor4 and the European Union indicative limit value is set at 1 ng m−3 of benzo[a]pyrene.5 The United Kingdom has set an air quality standard of 0.25 ng m−3 benzo[a]pyrene.6 Because of the complexity of PAH mixtures, the standards and guidelines are set in terms of the concentration of benzo[a]pyrene as this compound typically represents a substantial proportion of the total carcinogenic potential of at least the parent PAH mixture.2 In turn, the carcinogenic potential of PAH frequently makes a substantial contribution to the carcinogenicity of urban air.7–10Although often referred to as persistent organic pollutants (POPs), PAHs are reactive in the atmosphere. In fact, such reactivity presents problems for receptor modelling methods in source attribution studies. Oxidised products are formed, the most notable being oxy-derivatives (mostly quinones) and nitrated compounds. Some such compounds are also present in primary emissions. PAH derivatives have attracted interest because some are very potent mutagens and carcinogens.11–13
A further complexity in studying PAH and their derivatives arises from their semi-volatility. Compounds partition between the particle and vapour phases and hence undergo chemical reactions in both phases. While for the lower molecular weight compounds, reactions in the gas phase are likely to dominate, for compounds with four aromatic rings and higher, reactions in both phases need to be considered. Furthermore, if contact with the ground does not imply immediate reaction, semi-volatility implies the potential of re-volatilisation.
Observations of PAHs at remote sites, i.e. far from industrial and transport sources, indicate long-range transport. This is a concern, because of the related hazard for human health and ecosystems. Some PAHs, benzo[a]pyrene, benzo[b]fluoranthene, benzo[k]fluoranthene, and indeno[1,2,3-cd]pyrene beside others, are bio-accumulative. Therefore, and because of resistance to degradation PAHs are considered persistent organic pollutants (POPs) by the Convention on Long-range Transboundary Air Pollution and are listed by conventions for UNECE14 and OSPAR.15 Monitoring in the atmospheric environment mandated by convention processes is on-going in Europe and North America.14,16,17
Much of the scientific literature is focussed upon the 16 USEPA priority PAHs i.e., acenaphthene (Ace), acenaphthylene (Acy), fluorene (Fln), naphthalene (Nap), anthracene (Ant), fluoranthene (Flt), phenanthrene (Phe), benzo[a]anthracene (BaA), benzo[b]fluoranthene (BbF), benzo[k]fluoranthene (BkF), chrysene (Chr), pyrene (Pyr), benzo[ghi]perylene (BgP), benzo[a]pyrene (BaP), dibenzo[a,h]anthracene (DBahA), and indeno[1,2,3-cd]pyrene (IPy) (Table 1). This list is of largely historic significance and was developed when knowledge of relative toxicity of PAH congeners was more limited than at present. It does not include some of the more potent carcinogens, but focuses upon those compounds typically present at higher concentrations which are hence measurable in many environmental samples.
| p L (Pa) |
K
H![[thin space (1/6-em)]](https://www.rsc.org/images/entities/char_2009.gif) (M atm−1)
(M atm−1) |
logKoac |
k g OH (10−12 cm3 molec−1 s−1) | k g O3 (10−18 cm3 molec−1 s−1) | τ total (h) | |
|---|---|---|---|---|---|---|
| a Ma et al.,19 for temperature dependent data see Tenhulscher et al.20 b Ma et al.,19 for temperature dependent data see Lei et al.21 c Ma et al.,19 for temperature dependent data see Odabasi et al.22 d Based on oxidant levels characteristic of the continental background in mid latitudes (106 OH per cm3, 50 ppbV O3) and assuming model aerosols being representative for ambient aerosols (silica for unspecific particulate mass, diesel and flame soot for BC). Ranges given reflect uncertainties of kinetic data (see Tables 3, 5 and 6), particulate mass fraction, θ (adopted from a range of field observations during various seasons and in various climates, i.e. Simcik et al.;23 Mandalakis et al.;24 Tsapakis and Stephanou;25 Ding et al.;26 He and Balasubramanian;27 Lammel et al.;10 Demircioglu et al.;28 besides others), and of BC content (adopted from Spindler et al.29). e Paasivirta et al.30 f Odabasi et al.22 | ||||||
Naphthalene (Nap)  |
38 | 2.2 | 5.19 | 22 | <0.3 | 13 |
Acenaphthylene (Acy)  |
2.6 | 10.5 | 6.46 | 110 | 550 | 1 |
Acenaphthene (Ace)  |
1.7 | 7.1 | 6.44 | 58 | <0.5 | 5 |
Fluorene (Fln)  |
0.54 | 11.3 | 6.85 | 13 | 21 | |
Phenanthrene (Phe)  |
0.10 | 23.5 | 7.64 | 31 | 0.40 | 9 |
Anthracene (Ant)  |
5.9 × 10⁻² | 20.0 | 7.70 | 130 | 2 | |
Fluoranthene (Flt)  |
6.8 × 10⁻³ | 76 | 8.81 | 11 | 14–25 | |
Pyrene (Pyr)  |
4.2 × 10⁻³ | 76 | 8.86 | 50 | 5–6 | |
Benzo(a)anthracene (BaA)  |
3.8 × 10⁻⁴ | 159 | 10.28 | 3–11 | ||
Chrysene (Chr)  |
1.3 × 10⁻⁴ | 270 | 10.30 | (50) | 9–27 | |
Benzo(b)fluoranthene (BbF)  |
1.0 × 10⁻⁵ | 1550 | 11.34 | (16) | 34 to >330 | |
Benzo(k)fluoranthene (BkF)  |
7.8 × 10⁻⁶ | 1790 | 11.37 | (54) | 8–21 | |
Benzo(e)pyrene (BeP)  |
1.8 × 10⁻⁵e |
276e (1240) | (11.35) | (50) | 10–15 | |
Benzo(a)pyrene (BaP)  |
7.9 × 10⁻⁶ | 1320 | 11.48 | (50) | 2–5 | |
Indeno(1,2,3-c,d)pyrene (IPy)  |
6.6 × 10⁻⁷ | 2050 | 12.43 | 150 | 6–9 | |
Dibenz(a,h)anthracene (DBA)  |
9.5 × 10⁻⁸e |
120e (2045) | 12.59f | (50) | 34 to >330 | |
Benzo(g,h,i)perylene (BPe)  |
4.6 × 10⁻⁷ | 2410 | 12.55 | 5.9 | 5 | |
In this article, we review current knowledge of PAH and nitro-PAH with a focus upon chemical reactivity in both the gaseous and condensed phases, and where possible elucidate rates and mechanisms. Reactivity is put in the context of exposure of remote atmospheric environments, i.e. long-range transport (LRT) potential of these pollutants.
2. Sources
2.1. Primary emissions
Polycyclic aromatic hydrocarbons (PAHs) are by-products of all types of combustion, in particular incomplete. Major anthropogenic emission sources to air are, domestic burning of coal and wood, fossil fuel burning power plants, road transport, wood burning, cooking, and others. For global sources in 2004, Zhang and Tao31 reported biofuel (i.e. straw, firewood and animal dung, 56.7%) and wildfire (i.e. forest and savanna fires, 17.0%) as the main contributions, while traffic, domestic coal combustion and burning of agricultural waste contribute only 4.8%, 3.7% and 2.7%, respectively (referring to the sum of the 16 USEPA priority PAHs). In open fires of agricultural debris, forest or savannah grass, PAHs are not only emitted into air but also into soil. Additionally, petrogenic and biological32 sources may contribute, but anthropogenic sources prevail by far.The countries ranking highest in emissions of the 16 USEPA priority PAHs in 2004 were China (114 kt year−1), India (90 kt year−1) and the USA (32 kt year−1).31 Dominated by the use of biofuels, the PAH pattern may differ considerably among countries. For example, health risk, expressed in BaPeq/sum of 16 PAHs, ranges 0.18–3.58% among countries with highest values expected for countries with high usage of non-anthracite coal or wheat straw.31 High spatial resolution emission inventories are available for a number of countries (usually only BaP or few substances, namely BaP, BbF, BkF and InP; e.g. EEA;33 Xu et al.34). Emission estimates have also been compiled for whole regions (e.g., Gusev et al.35) as well as globally31,36 (Table 2). Global anthropogenic emissions of the 16 USEPA priority PAHs in 2004 were close to 4 kg km−2 year−1 with biofuel (56.7%), wildfire (17.0%) and consumer product usage (6.9%) contributing most.31 Power plants, open biomass burning, road transport (mostly diesel), industrial processes, air and sea transport also contribute. For BaP 1990 global anthropogenic emissions, it was estimated that 13% is due to biomass burning and 87% due to fossil fuel combustion.37
Emission inventories are based on emission factors from the various combustion technologies and fuel consumption and transformation data and usually apply for one particular year. Emission inventory determination is very uncertain as substance-specific emission factors (ng g−1 fuel burnt or μg km−1 for transport) determined experimentally are very sensitive to even minor differences in combustion technology, engine operation, fuel composition, etc. and, hence, may vary by several orders of magnitude for the same type of emission. Most uncertain are emission factors of open fires (e.g. forest fires), because of difficulties in measuring under realistic and representative conditions. Data gaps have been filled assuming a constant ratio of emission factors of PAH and another trace substance (e.g. black carbon36). To distribute on a grid, country-based data are often scaled according to population density (under the assumption that emission per capita is constant) and annual data are temporally distributed evenly neglecting seasonal variation of major sources, such as residential heating related fossil fuel burning. More realistic temporal functions have been successfully used in regional PAH modelling.35,38
Known substance patterns of emission sources partly combined with known emission fluxes have been used to quantify the contribution of individual sources to pollution levels at receptor sites using various types of source-receptor modelling.42,43 The most simple approach in this context is the comparison of ratios of pairs individual PAH's concentrations at the receptor and source sites. Pairs of PAHs of similar degradability in air have been suggested for this purpose (so-called diagnostic ratios44–46). This approach is not successful due to the variability of sink (degradation, deposition) conditions and incomplete knowledge of chemical kinetic data in both the gaseous and particulate phases (Section 347,48). The success of multivariate statistical approaches, making use of substance patterns of emission sources which encompass many PAHs (so-called fingerprint methods), is often limited by the similarity of sources in terms of the PAH pattern.49 The inclusion of other substances, such as the anhydrous sugar levoglucosan as a marker for biomass combustion50 and hopanes as markers for motor vehicle exhausts51 and coal combustion,52 can solve the problem. In the future, this challenge may consistently be covered using inverse modelling (adjoint model). In this context, the ratio of the concentrations of relatively fast degrading benzo[a]pyrene over relatively slow degrading benzo[e]pyrene (BeP) has been suggested as a measure for age of air mass.53
2.2. Re-volatilisation from ground compartments
Most of the 3–4 ring PAHs are semivolatile (i.e., their saturation vapour pressure at 298 K is in the range psat = 10−6–10−2 Pa; Table 1). Therefore, these substances are subject to re-volatilisation upon condensation on surfaces and to gas exchange with vegetation,54–57 soils28,58–62 and water surfaces.63–65 Persistence of PAHs in soils is on the order of decades.61 Therefore, LRT of PAHs may be enhanced by re-evaporation.36 Secondary emissions due to re-volatilisation from surfaces need to be included in modelling of semivolatiles, in particular if the substance had been accumulated historically in the ground compartments. For example, at the central European background observatory Košetice, Czech Republic, the burden of fluoranthene and pyrene in soil, 121 and 95 ng g−1 (mean of 2006–2008, depth sampled 10 cm) exceeds the burden in air by 4 orders of magnitude (under the assumption of a bulk soil density of 1.5 g cm−3 and that the concentrations in ground-level air, 1.83 and 1.19 ng m−3, respectively, were representative for the air column within the planetary boundary layer of 1000 m depth) and concentrations in soil and air have been approaching equilibrium during the last decade.66 Much of the soil PAH in temperate regions is historic and concentrations in air and soil are relaxing to equilibrium on a multi-year time scale.The volatilisation flux is described in models based on an empirical parameterization or as given by diffusion. However, not all contributions to effective diffusion are represented in models and additional sources to the atmosphere exist. For example, the possible enhancement of soil–air exchange by co-evaporation with soil water vapour and of air–sea exchange by turbulence in surface water (breaking wave phenomena, bubbles67,68) is usually neglected. Apart from volatilization additional secondary emission paths are possibly relevant, e.g. the formation of aerosol particles from drying sea spray droplets. This is a relevant source as PAHs, like other hydrophobic organics, were found enriched in the sea surface microlayer by up to a factor of 10, sometimes even up to a factor of 100 as compared to the subsurface water.69,70 The fraction of the PAH in surface seawater which is partitioning to suspended or sinking particulate matter can volatilize following dissolution in water in relaxation to phase equilibria – or be removed from the surface layer carried by sedimenting particles or by deep water formation. Similarly, the PAH burden stored in soils may only partly be mobile and subject to re-volatilization: in soil, through chemical interaction with fulvic acid or other organic matter71–75 and black carbon76–78 components PAH may in the long-term turn immobile (‘ageing’) and more persistent. Sorption strength is dependent on the type of soil organic matter (OM) and sorption history.79–81
Degradation in ground compartments is in models generally assumed to obey first order chemical kinetics without spatial variability in soils or in seawater. However, there is evidence for significant spatial heterogeneity of PAH biodegradability at least in soils.82 The rates used for seawater are often merely extrapolated from experimental data obtained in freshwater using a default factor to account for a lower level of bioactivity. The temperature dependence of the degradation reaction coefficient, if not neglected, is usually fixed to some default function, e.g. doubling per 10 K temperature increase.
3. Sinks
3.1. Gas–particle partitioning and deposition
| Kp = cip/(cigcm) | (1) |
Adsorption:
If adsorption is dominating the process, then for the particulate phase mass fraction of semivolatile substances, θ = cip/(cig + cip) = [1 + 1/(KpcTSP)]−1, it holds:90,91
| θ = cJS/[cJS + poL] | (2) |
| Kp = NsAmTe(Ql−Qv)/RT/(16poL) | (3) |
| logKp = mlogpoL + b | (4) |
As logpoL ∼ 1/T (Clausius–Clapeyron equation) eqn (4) is physically equivalent to plots of the form
| logKp = A/T + B | (5) |
| Kp = KOAfOMMWocrζocr/(ρocrMWOMζOM1012) | (6) |
| logKp = m′logKOA + b′ | (7) |
fOM − 11.91.
logKp of PAHs based on differentiating sampling of the gaseous and particulate fractions was found to be correlated with 1/T (or logpoL) in a number of studies.92,96–98 Therefore, as a general trend a doubling of θ per ≈5 K temperature decrease had been found,95θ being significantly higher in winter,10,25,99,100 similar to other semivolatile aerosol constituents. This temperature trend is in accordance with both adsorptive and absorptive mechanisms.95 However, KOA was suggested to be a better descriptor for PAH gas–particle partitioning than poL.101 Measurement of fOM has partly been included, however. Over-prediction of θ by the surface adsorption model had been suggested by other studies at both source and receptor sites.65 In these studies, however, S has been estimated and assumed to be constant, rather than measured. Gas–particle partitioning of PAHs is presently understood as having adsorptive and absorptive contributions. In particular, a combination of absorption into OM and adsorption onto soot seems to have a high potential to explain the observations.102,103
With, again, the assumptions ζOCT = ζOM and MWOCT/MWOM = 1 adsorptive and absorptive terms can be combined to eqn (8) (Lohmann and Lammel;103 similar equation suggested by Dachs and Eisenreich102).
| Kp = 10−12[fOM/ρoctKoa + fBC/ρBC(SBC/Ssoot)Ksoot–air] | (8) |
While fOM, likely to influence absorption, and soot, fBC, likely to influence adsorption, had been covered in field studies,65,88,105,106 the aerosol surface, S, has only rarely been covered so far,10,107 and never together with the other parameters, i.e. fOM, fBC, SBC and Ssoot. Moreover, a more differentiated specification of carbonaceous fractions of PM would be needed in order to advance the understanding of PAH's gas–particle partitioning.
Matrix specific adsorption to and absorption of PAH in particulate matter components can in principle be described accounting for all types of chemical interaction at the molecular level (so-called poly-parameter linear free energy relationships).108 The substance specific109,110 and many relevant aerosol matrix parameters are available to quantify PAH's electron donor and acceptor, and van der Waals interactions (for adsorption) and a cavity formation term accounting for solvation (absorption into the particulate matter organic phase), including their humidity dependence.111,112 However, there are still limitations due to data gaps in the experimentally determined substance and matrix parameters.
3.1.1.1. PAH mass size distribution. Upon emission in combustion processes and close to the sources mass size distributions of PAHs are peaking in the ultrafine and accumulation modes (0.01–0.1 and 0.1–1 μm aerodynamic diameter size ranges, respectively). One or two mass size modes are found at urban and rural sites, with mass median diameters, Dm, almost exclusively in the accumulation mode (0.1–1.0 μm of size).113–118 This should be seen in the context of limitations by particle size resolution (number of impactor stages) and analytical sensitivity. During atmospheric transport re-distribution in the aerosol occurs, at least of the semivolatile PAHs, which undergo gas–particle partitioning. Their mass size distribution is determined by condensation to surfaces, which leads to a maximum in the accumulation mode113,119 and the number median diameter is in the Aitken mode. This was also confirmed for PAHs.113,119–121
Particulate dry deposition fluxes of individual PAHs were measured and mean particle dry deposition velocities ranged between 0.4–10 cm s−1.28,64,124,125 In samples of deposited particulate matter 3-ring PAHs were found enriched as compared to air samples, i.e. had higher dry deposition velocities than 4- and 5-ring PAHs.28
When there is no exchange of material between the particulate and dissolved phases in rain, the total scavenging ratio, Wt, i.e. apparent volume of air washed out by volume of rainwater of a given compound can be expressed by:
| Wt = 103cr/ca = Wg × (1 − θ) + Wp × θ | (9) |
The gaseous PAH scavenging ratio, Wg, i.e. the apparent volume of air washed out by volume of rainwater, ranges from 5 × 10²–5 × 10⁵ in precipitation events.63,121,126,127Wg was found to be in good agreement with predictions,126 suggesting that phase equilibria were established.128,129 Besides dissolution, adsorption of gaseous molecules onto the surface of rain drops or snow flakes could contribute to the phase transfer process.128 The particle scavenging ratio Wp is dependent on particle size and chemical surface properties, rain intensity, raindrop diameter and collision efficiency,129 as it is the carrier's (particle) washout efficiency which is determining the process. Typical values of Wp of PAH are mostly in the range Wp = 5 × 10²–105,63,121,124,130,131 and even higher in a tropical climate.127 In conclusion, the particle scavenging contribution to the total scavenging exceeds the gas scavenging contribution. The particle scavenging contribution, Wp × θ/Wt, accounted for 14–100% in a temperate (Central Europe121) and 86–100% in a tropical environment (Singapore65). More efficient scavenging for semivolatile PAHs than for non-volatile PAHs found in various studies was attributed to a different mass size distribution.130
Snow is considered to be a more efficient scavenger for nonpolar organics in air than rain.124,132 Efficiency is negatively correlated with the vapour pressure of a substance, indicating that adsorption onto the air–ice interface is the process responsible for vapour scavenging.133
• Studies of PAH air–soil exchange
• Improved characterisation of the carbonaceous fraction of PM in field and laboratory studies in order to better account for specific sorption of PAHs to these fractions and, hence, better understand PAH's gas–particle partitioning
• Extension of sorption studies to fill the data gaps describing chemical interaction of PAH at the molecular level with regard to relevant aerosol matrix parameters and their humidity dependence (for poly-parameter linear free energy relationships).
3.2. Chemical reactions
The key sink for PAHs in the atmosphere is chemical reactions with atmospheric oxidants, i.e. OH, NO3 and O3.135,140–142 While it has been suggested that reaction with Cl atoms could also be an important loss process for gas phase PAHs in the marine boundary layer and coastal environments,143 there is, as yet, no conclusive evidence of this process being significant in the wider environment. Direct reaction with NO2 or HNO3 is also not an important atmospheric loss process.144
A significant amount of pioneering work investigating the kinetics of atmospheric reactions of PAHs over the past 30 years has been conducted by Atkinson, Arey and co-workers at the University of California, Riverside, USA. Through this research, much insight has been gained into the reaction chemistry (rate coefficients, mechanisms and products) of atmospheric reactions of gas phase 2–4 ring PAHs with OH, NO3 and O3 and their relative importance in the removal of PAHs from the atmosphere and conversion to derivative compounds.
Here, we review the reactions of PAHs with OH radicals, NO3 radicals and O3 and their transformation into nitro- and oxy-derivative compounds.
Calculated rate coefficients, proposed reaction mechanisms and observed products are discussed. Rate coefficient values and reaction products for the reactions of LWM PAHs with OH, NO3 and O3 have previously been reviewed by Atkinson and Arey.135 Since this review was published, additional research has been undertaken to validate or enhance our understanding of the reaction kinetics of these processes. We therefore provide an updated overview and discussion for specific 2–4 ring PAHs.
3.2.1.1. Gas phase reactions of PAHs with OH radicals.
3.2.1.1.1. Overview. The hydroxyl radical, OH, plays an essential role in atmospheric behaviour and transformations of organic compounds.145–147 For a wide range of organic compounds, reaction with OH represents an important removal mechanism from the atmosphere and is also a potential pathway for the transformation into more toxic compounds.148
In the troposphere, OH radicals can be formed from a series of reactions initiated by the photolysis of ozone in the presence of water vapour:147,149
| O3 + hν (λ < 319 nm) → O(1D) + O2(1Δg) |
| O(1D) + H2O → 2OH |
| O(1D) + M → O(3P) + M (M = N2, O2, CO2) |
Other mechanisms involve the reaction of RO2 with NO,145 and photolysis of nitrous acid and formaldehyde.150
The average 24 h OH concentration has been estimated to be 1.0 × 10⁶ molecules cm−3, but is generally reported as 2.0 × 10⁶ molecules cm−3, a daytime average adjusted for a 12 h average daytime period.151–153
Due to the nature of its formation and reaction chemistry, OH radical concentrations are dependent on temporal and meteorological factors including time of day, season, latitude, cloud cover, and relative humidity151,152 as well as concentration of O3 (a key source compound) and NO2 (a key sink reactant). For example, the highest OH concentrations are expected in the tropics where humidity and UV light intensity levels will be highest.152
3.2.1.1.2. Reaction mechanisms. Despite the considerable amount of research into the reactions of PAHs with OH and calculations of rate coefficient values for these reactions, the precise mechanisms by which these processes occur are not fully understood. Experimental studies have a limited capability to assess these reaction routes due to the lack of analytical methods to detect the radical intermediate species believed to be involved in these processes.154 Therefore a combination of experimental and theoretical approaches is required.
The potential mechanism(s) for the reaction of OH radicals with aromatic hydrocarbons have been discussed by Atkinson147 and Atkinson and Arey135 and more recently by Atkinson and Arey.151
The reaction of PAHs with OH radicals can be initiated via two possible reaction pathways. These are illustrated for the acenaphthene and acenaphthylene in Scheme 1. The proposed pathways involve: (1) OH radical interaction with substituent groups either through H-atom abstraction from C–H groups (Scheme 1a), or, in the case of acenaphthylene which contains an unsaturated cyclopentafused ring, addition to the ![[double bond splayed left]](https://www.rsc.org/images/entities/char_e009.gif) C
C![[double bond, length as m-dash]](https://www.rsc.org/images/entities/char_e001.gif) C
C![[double bond splayed right]](https://www.rsc.org/images/entities/char_e00a.gif) bond of this substituent (Scheme 1b);135,155 or (2) OH addition to the aromatic ring, forming an initially energy-rich hydroxycyclohexadienyl-type radical intermediate (hereafter referred to as the PAH–OH adduct), which then further reacts with NO2 or O2, to form products or thermally decompose back to reactants135,155 (Scheme 1c).
bond of this substituent (Scheme 1b);135,155 or (2) OH addition to the aromatic ring, forming an initially energy-rich hydroxycyclohexadienyl-type radical intermediate (hereafter referred to as the PAH–OH adduct), which then further reacts with NO2 or O2, to form products or thermally decompose back to reactants135,155 (Scheme 1c).
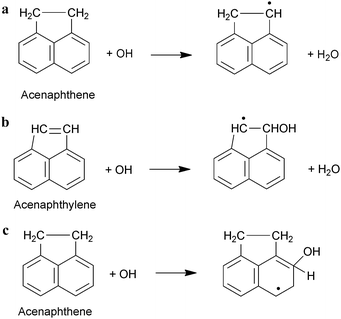 | ||
| Scheme 1 Mechanism for the reaction of gas-phase PAHs with OH radicals; (a) H-atom abstraction; (b) OH addition to substituent groups; (c) OH addition to the aromatic ring.135,147 | ||
The relative importance of the two proposed reaction pathways is dependent on the reaction temperature and pressure conditions. While the OH-addition mechanism is expected to dominate at room temperature, at elevated temperatures, H-atom abstraction from the C–H bonds will become of increasing importance as the PAH–OH adduct will be too thermally unstable and will decompose back to the original reactants.147,151 This shift in the reaction mechanism is indicated by the observation of non-exponential OH radical decay at higher temperature ranges.147,151
The dominance of the OH-addition pathway at room temperature has been demonstrated for naphthalene,156 anthracene157,158 and phenanthrene.159,160 These studies have generally reported a negative dependence of the rate constant on temperature. Rate coefficient expressions to fit these experimental data, derived from these studies, are shown in Table 3. A lack of a significant ‘isotope effect’ i.e. differences in rate coefficients between unsubstituted PAHs and their deuterated equivalent, as noted by Ananthula et al.157,160 and Lee et al.159 also indicates a minor contribution of the H-abstraction mechanisms over the temperature ranges studied.
| k OH (cm−3 molecules−1 s−1) | Ref. | T (K) | Notes | |
|---|---|---|---|---|
| Nap | 2.4 × 10⁻¹¹ | Phousongphouang and Arey171 | 298 ± 2 | RR relative to k(1,2,3-trimethylbenzene) = 3.27 × 10⁻¹¹ cm−3 moleculues−1 s−1 |
| 2.2 × 10⁻¹¹ | Atkinson147 | 298 | Recommended value based on previous data, overall uncertainty of ±30% | |
| 2.3 × 10⁻¹¹ | Brubaker and Hites140 | 298 | Measured over the temperature range 306–366 K | |
| 2.7 × 10⁻¹¹ | Klamt172 | n/a | Theoretical calculation based on a new molecular orbital based estimation method | |
| 2.4 × 10⁻¹¹ | Biermann et al.169 | 298 ± 1 | RR, relative to k(propene) = 2.63 × 10⁻¹¹ cm−3 molecules−1 s−1 | |
| 1.9 × 10⁻¹¹ | Lorenz and Zellner156 | 300 | Absolute rate, temperature range 300–873 K, extrapolated using Arrhenius parameter | |
| 2.2 × 10⁻¹¹ | Klöpffer et al.170 | 300 | RR, relative to k(ethene) = 8.44 × 10⁻¹² cm−3 molecules−1 s−1 | |
| 2.4 × 10⁻¹¹ | Atkinson et al.168 | 294 ± 1 | RR, relative to k(n-nonane) = 1.07 × 10⁻¹¹ cm−3 molecules−1 s−1 | |
| 2.6 × 10⁻¹¹ | Atkinson and Aschmann144 | 295 ± 1 | RR, relative to k(2-methyl-1,3-butadiene) = 1.02 × 10⁻¹⁰ cm−3 molecules−1 s−1 | |
| 1M-Nap | 4.1 × 10⁻¹¹ | Phousongphouang and Arey171 | 298 ± 2 | RR, relative to k(naphthalene) = 2.39 × 10⁻¹¹ cm−3 molecules−1 s−1, derived from the same work |
| 5.3 × 10⁻¹¹ | Atkinson and Aschmann173 | 298 ± 2 | RR, 2-methyl-1,3-butadiene used as reference compound, T = 298 ± 2 | |
| 6.0 × 10⁻¹¹ | Klamt172 | n/a | Theoretical calculation based on a new molecular orbital based estimation method | |
| 2M-Nap | 4.9 × 10⁻¹¹ | Phousongphouang and Arey171 | 298 ± 2 | RR, relative to k(naphthalene) = 2.39 × 10⁻¹¹ cm−3 molecules−1 s−1, derived from the same work |
| 5.2 × 10⁻¹¹ | Atkinson and Aschmann144 | 295 ± 1 | RR, relative to k(2-methyl-1,3-butadiene) = 1.02 × 10⁻¹⁰ cm−3 molecules−1 s−1 | |
| 5.7 × 10⁻¹¹ | Klamt172 | n/a | Theoretical calculation based on a new molecular orbital based estimation method | |
| 1E-Nap | 3.6 × 10⁻¹¹ | Phousongphouang and Arey171 | 298 ± 2 | RR, relative to k(naphthalene) = 2.39 × 10⁻¹¹ cm−3 molecules−1 s−1, derived from the same work |
| 2E-Nap | 4.0 × 10⁻¹¹ | Phousongphouang and Arey171 | 298 ± 2 | RR, relative to k(naphthalene) = 2.39 × 10⁻¹¹ cm−3 molecules−1 s−1, derived from the same work |
| 1,2DM-Nap | 6.0 × 10⁻¹¹ | Phousongphouang and Arey171 | 298 ± 2 | RR, relative to k(naphthalene) = 2.39 × 10⁻¹¹ cm−3 molecules−1 s−1, derived from the same work |
| 1,3DM-Nap | 2.2 × 10⁻¹¹ | Banceu et al.175 | 295 | RR [relative to k(naphthalene) = 2.39 × 10⁻¹¹ cm−3 molecules−1 s−1] |
| 7.5 × 10⁻¹¹ | Phousongphouang and Arey171 | 298 ± 2 | RR, relative to k(naphthalene) = 2.39 × 10⁻¹¹ cm−3 molecules−1 s−1, derived from the same work | |
| 1,4DM-Nap | 5.8 × 10⁻¹² | Klamt172 | n/a | Theoretical calculation based on a new molecular orbital based estimation method |
| 5.8 × 10⁻¹¹ | Phousongphouang and Arey171 | 298 ± 2 | RR, relative to k(naphthalene) = 2.39 × 10⁻¹¹ cm−3 molecules−1 s−1, derived from the same work | |
| 1,5DM-Nap | 6.0 × 10⁻¹¹ | Phousongphouang and Arey171 | 298 ± 2 | RR, relative to k(naphthalene) = 2.39 × 10⁻¹¹ cm−3 molecules−1 s−1, derived from the same work |
| 1,6DM-Nap | 6.3 × 10⁻¹¹ | Phousongphouang and Arey171 | 298 ± 2 | RR, relative to k(naphthalene) = 2.39 × 10⁻¹¹ cm−3 molecules−1 s−1, derived from the same work |
| 1,7DM-Nap | 6.8 × 10⁻¹¹ | Phousongphouang and Arey171 | 298 ± 2 | RR, relative to k(naphthalene) = 2.39 × 10⁻¹¹ cm−3 molecules−1 s−1, derived from the same work |
| 1,8DM-Nap | 6.3 × 10⁻¹¹ | Phousongphouang and Arey171 | 298 ± 2 | RR, relative to k(naphthalene) = 2.39 × 10⁻¹¹ cm−3 molecules−1 s−1, derived from the same work |
| 2,3DM-Nap | 6.2 × 10⁻¹¹ | Phousongphouang and Arey171 | 298 ± 2 | RR, relative to k(naphthalene) = 2.39 × 10⁻¹¹ cm−3 molecules−1 s−1, derived from the same work |
| 1.0 × 10⁻¹⁰ | Klamt172 | n/a | Theoretical calculation based on a new molecular orbital based estimation method | |
| 7.7 × 10⁻¹¹ | Atkinson and Aschmann144 | 295 ± 1 | RR, relative to k(2-methyl-1,3-butadiene) = 1.02 × 10⁻¹⁰ cm−3 molecules−1 s−1 | |
| 2,6DM-Nap | 6.7 × 10⁻¹¹ | Phousongphouang and Arey171 | 298 ± 2 | RR, relative to k(naphthalene) = 2.39 × 10⁻¹¹ cm−3 molecules−1 s−1, derived from the same work |
| 2,7DM-Nap | 6.9 × 10⁻¹¹ | Phousongphouang and Arey171 | 298 ± 2 | RR, relative to k(naphthalene) = 2.39 × 10⁻¹¹ cm−3 molecules−1 s−1, derived from the same work |
| Ace | 8.0 × 10⁻¹¹ | Reisen and Arey155 | 296 | RR [relative to k(trans-2-butene) = 6.48 × 10⁻¹¹ cm−3 molecules−1 s−1] |
| 5.8 × 10⁻¹¹ | Brubaker and Hites140 | 298 | Measured over the temperature range 325–365 K | |
| 1.0 × 10⁻¹⁰ | Atkinson and Aschmann173 | 296 ± 1 | RR [relative to k(2,3-dimethyl-2-butene) = 1.11 × 10⁻¹⁰ cm−3 molecules−1 s−1] | |
| 5.8 × 10⁻¹¹ | Klöpffer et al.170 | 300 | RR [relative to k(ethene) = 10−12 cm−3 molecules−1 s−1] | |
| 6.4 × 10⁻¹¹ | Banceu et al.175 | 295 | RR [relative to k(naphthalene) = 2.2 × 10⁻¹¹ cm−3 molecules−1 s−1] | |
| 8.0 × 10⁻¹¹ | Klamt172 | n/a | Theoretical calculation based on a new molecular orbital based estimation method | |
| Acy | 1.2 × 10⁻¹⁰ | Reisen and Arey155 | 296 | RR [relative to k(trans-2-butene) = 6.48 × 10⁻¹¹ cm−3 molecules−1 s−1] |
| 1.3 × 10⁻¹⁰ | Banceu et al.175 | 295 | RR [relative to k(naphthalene) = 2.2 × 10⁻¹¹ cm−3 molecules1 s−1] | |
| 1.1 × 10⁻¹⁰ | Atkinson and Aschmann173 | 296 ± 1 | RR [relative to k(2,3-dimethyl-2-butene) = 1.11 × 10⁻¹⁰ cm−3 molecules−1 s−1] | |
| Fln | 1.6 × 10⁻¹¹ | Kwok et al.176 | 297 | Placed on an absolute basis by using k2(cyclohexane) = 7.47 × 10⁻¹¹ cm−3 molecules−1 s−1 |
| 1.3 × 10⁻¹¹ | Brubaker and Hites140 | 298 | Measured over the temperature range 326–366 K | |
| 9.9 × 10⁻¹² | Klamt172 | n/a | Theoretical calculation based on a new molecular orbital based estimation method | |
| 1.3 × 10⁻¹¹ | Klöpffer et al.170 | 300 | RR [relative to k(ethene) = 7.47 × 10⁻¹² cm−3 molecules−1 s−1] | |
| Phe | 3.4 × 10⁻¹¹ | Biermann et al.169 | 298 ± 1 | RR [relative to k(propene) = 4.85 × 10⁻¹² e504/T cm−3 molecules−1 s−1] |
| 3.1 × 10⁻¹¹ | Atkinson147 | 298 | Recommended value based on previous data, overall uncertainty of ±30% | |
| 2.6 × 10⁻¹¹ | Klamt172 | n/a | Theoretical calculation based on a new molecular orbital based estimation method | |
| 1.6 × 10⁻¹¹ | Lorenz and Zellner156 | 338 | Absolute rate study, measured over a temperature range 338–748 K | |
| 1.3 × 10⁻¹¹ | Kwok et al.176 | 296 | RR [relative to k(propene) = 2.66 × 10⁻¹¹ cm−3 molecules−1 s−1] | |
| 2.7 × 10⁻¹¹ | Brubaker and Hites140 | 298 | Measured over the temperature range 346–386 K, extrapolated using Arrhenius parameters | |
| 3.2 × 10⁻¹¹ | Lee et al.159 | 298 | Measured over the temperature range 298–386 K, extrapolated using Arrhenius parameters | |
| 4.98 ± 2.96 × 10⁻⁶ T−1.97±0.10 | Ananthula et al.160 | 373–1000 K | Two-parameter expression to best fit experimental data | |
| 1M-Phe | 2.9 × 10⁻¹¹ | Lee et al.159 | 298 | Measured over the temperature range 363–403 K, extrapolated using Arrhenius parameters |
| 2M-Phe | 6.5 × 10⁻¹¹ | Lee et al.159 | 298 | Measured over the temperature range 338–398 K, extrapolated using Arrhenius parameters |
| 3M-Phe | 6.6 × 10⁻¹¹ | Lee et al.159 | 298 | Measured over the temperature range 353–388 K, extrapolated using Arrhenius parameters |
| 9M-Phe | 7.6 × 10⁻¹¹ | Lee et al.159 | 298 | Measured over the temperature range 333–373 K, extrapolated using Arrhenius parameters |
| Ant | 1.1 × 10⁻¹⁰ | Biermann et al.169 | 325 ± 1 | RR [relative to k(propene) = 2.29 × 10⁻¹¹ cm−3 molecules−1 s−1] |
| 1.9 × 10⁻¹⁰ | Brubaker and Hites140 | 298 | Measured over the temperature range 346–365 K | |
| 1.3 × 10⁻¹¹ | Kwok et al.176 | 296 | Based on a derived k(anthracene)/k(phenanthrene) value of 1.0 ± 0.5 | |
| 2.0 × 10⁻¹⁰ | Klamt172 | n/a | Theoretical calculation based on a new molecular orbital based estimation method | |
| 1.3 × 10⁻¹⁰ | Atkinson;147 Biermann et al.169 | 298 | Recommended value based on previous data, overall uncertainty of ±30% | |
| 1.12 × 10⁻¹⁰ (T/298)−0.46 | Goulay et al.158 | 58–470 | Two-parameter expression to best fit experimental data | |
| 8.17 × 10⁻¹⁴ T−8.3 e(−3171.71/T) | Ananthula et al.157 | 373–923 | Modified Arrhenius equation to best fit experimental data | |
| 2.18 × 10⁻¹¹ e(−1734.11/T) | Ananthula et al.157 | 999–1200 | Modified Arrhenius equation to best fit experimental data | |
| Flt | 1.1 × 10⁻¹¹ | Brubaker and Hites140 | 298 | Measured over the temperature range 346–366 K |
| Pyr | 5.0 × 10⁻¹¹ | Atkinson et al.162 | 296 ± 2 | RR Relative to k(naphthalene) = 3.6 × 10⁻²⁸ cm−3 molecules−1 s−1 |
| 1N-Nap | 5.4 × 10⁻¹¹ | Atkinson147 | 298 | Recommended value |
| 2N-Nap | 5.6 × 10⁻¹¹ | Atkinson147 | 298 | Recommended value |
Studies indicate that the OH-addition mechanism is the dominant reaction route up to 773 K for anthracene,157 525 K for naphthalene156 and ∼380 K for monocyclic aromatic compounds.161 It is therefore suggested that an increase in molecular size (number of aromatic rings) could have a positive effect on the OH-addition rate and/or the thermal stability of the PAH–OH adduct, with 3-ring PAHs being more stable at higher temperatures than 2-ring structures. Furthermore, Brubaker and Hites140 investigated the kinetics of the 4-ring PAH fluoranthene and indicated that this compound would form a more stable OH-adduct than 2- or 3-ring structures.
Ananthula et al.160 noted from assessment of previous kinetic studies that the rate of H-atom abstraction at elevated temperatures appears to be largely unaffected by the molecular size. This is presumably due to the dependence of reactivity on the number of possible reaction sites, which does not vary significantly between 1-, 2- and 3-ring species. The reason for the apparent dependence of the OH reaction rate upon molecular size at lower (<773 K) temperatures is not currently known.
3.2.1.1.3. Reactions of the PAH–OH adducts. Reactions of the PAH–OH adduct with NO2 are expected based on the observation of nitro-PAH compounds in a wide number of ambient measurements with relative concentrations and isomer profiles consistent with their formation from gas phase reactions (as discussed in detail in Section 5). Indeed, initial investigations into the mechanism(s) of PAH reactions suggested that the PAH–OH adduct will react with NO2 to form nitro-derivative products162–164 and would not react with O2 to a significant degree.
However, kinetic and product data from experimental studies now suggest that for OH–PAH adducts, the reaction with O2 dominates over NO2 reactions under atmospheric conditions.151,165,166 It is suggested that the NO2 and O2 reactions with the naphthalene–OH adduct may be of equal importance for NO2 mixing ratios down to 60 ppbV.166
In addition to laboratory studies, the reactions of naphthalene with OH radicals and subsequent reactions of the Nap–OH adduct have been investigated theoretically in studies by Ricca and Bauschlicher167 and Qu et al.154 Their investigations of the bond energies of the OH–naphthalene adduct indicate that OH will react with naphthalene at either C1 or C2 without an activation energy barrier above the reactants. It was inferred that, after formation of the OH–Nap adduct, decomposition back to reactants is the most favourable pathway.
Qu et al.154 also carried out theoretical study of the mechanism of the subsequent reactions of the Nap–OH adduct with NO2 and/or O2 using molecular orbital calculations. The derived pathways for these reactions are summarized in Scheme 2.
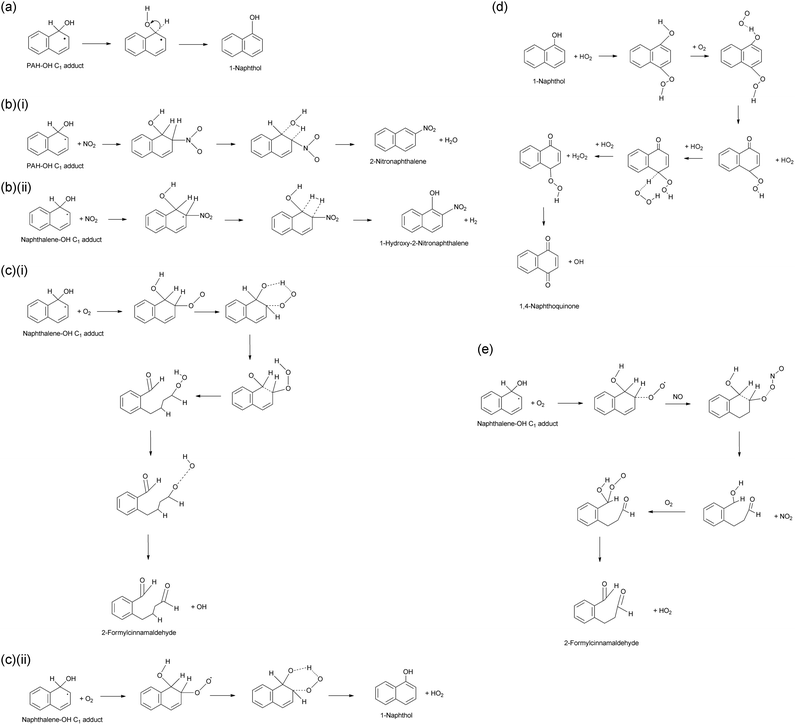 | ||
| Scheme 2 Proposed mechanisms for the further reaction of the PAH–OH adduct: (a) H-atom abstraction; (b) reactions with NO2; (c) reaction with O2; (d) further reaction of 1-naphthol; (e) reaction with NO/O2.154 | ||
It was suggested that H-atom abstraction from the OH–naphthalene adduct would primarily yield the closed-ring 1- and 2-napthol isomers, from C1 and C2 interaction of OH respectively, which would be more stable than open-shell intermediate species154,167 (Scheme 2a). It was indicated that the C1-isomer will be more stable than the C2-isomer for these hydroxyl products with a ratio of 2:1.167
It was expected that the C1 and C2 naphthalene–OH adduct would undergo a competitive decomposition with O2 and/or NOx. The N atom of NO2 can attack the OH–Nap adduct at either the trans- or cis-position of OH. Attack at the trans-position is expected to yield 1- and 2-nitronaphthalene isomers for the reactions of the C2 and C1 adducts respectively (Scheme 2bi), while attack at the cis-position would yield 2-hydroxy-1-nitronaphthalene and 1-hydroxy-2-nitronaphthalene (Scheme 2bii). It was indicated that the nitronaphthalene isomers will be the dominant products formed.
O2 is expected to attack the C1- and C2-adducts forming energy-rich intermediates, which will decompose via different pathways to yield either 2-formylcinnamaldehyde (Scheme 2ci) or 1- or 2-naphthol isomers (Scheme 2cii). It was also indicated that naphthols can further react with HO2 which yields 1,4-naphthoquinone (1,4-NQu) (Scheme 2d). It was suggested that 1,4-NQu can also be formed from 1-naphthol by further addition of OH to yield a diol intermediate which can rearrange to form 1,4-diketone followed by loss of H2.167 Furthermore, it is indicated that the C1 and C2 adducts can react with an NO–O2 mixture to form an additional route to 2-formylcinnamaldehyde (FCA) (Scheme 2e).
3.2.1.1.4. Rate coefficients. Experimental studies have been carried out to derive second-order rate coefficients for the gas phase reaction of OH with a number of individual 2–4 ring PAHs, including naphthalene, alkylnaphthalene derivatives, acenaphthene, acenaphthylene, anthracene, phenanthrene, fluorene, fluoranthene and pyrene. Values of the calculated second-order rate coefficient, k(2), derived in these studies and the experimental conditions used are detailed in Table 3.
While for most studies experimental investigation of k(2) values for PAH reaction with OH has been conducted over relatively narrow temperature ranges, Lorenz and Zellner156 investigated the rate coefficients for the reactions of OH with naphthalene and phenanthrene over a wide range of elevated temperatures (∼300–873 K). Similarly Brubaker and Hites140 measured rate coefficients for a range of temperatures above ambient levels and then extrapolated to environmentally relevant temperatures using the Arrhenius equation.
Atkinson147 recommended a k(2) value for the reaction of naphthalene with OH based on a unit-weighted least squares analysis of data from previous studies by Atkinson et al.;168 Atkinson and Aschmann;144 Lorenz and Zellner156 and Biermann et al.169 The value reported by Klöpffer et al.170 was not used in this calculation. Subsequent experimental studies by Brubaker and Hites140 and Phousongphouang and Arey,171 and a theoretical value derived by Klamt et al.,172 using molecular orbital calculations, are shown to be in good agreement with this recommended k(2) value.
k (2) values for a range of alkylnaphthalene derivatives (MNs, DMNs and ENs) with OH have been studied experimentally.144,171,173 The k(2) values for 1M-Nap, 2M-Nap and 2,3DM-Nap calculated by Phousongphouang and Arey171 and Atkinson and Aschmann144,173 are shown to be in reasonable agreement, the small difference in measured rate coefficient values being attributed to differences in product quantification methods.171 These k(2) values are also within a factor 2 of the theoretical value derived by Klamt.172
k (2) values derived in different experimental studies for the reaction of acenaphthene with OH are clearly not in agreement. Differences between k(2) reported by Reisen and Arey155 and Atkinson and Aschmann174 could be attributed to the use of capillary GC columns in the former and packed column GC techniques in the latter, leading to a more accurate measurement in the later study.155 The k(2) value reported by Klöpffer et al.170 may be erroneously low as the reference compound, ethene, reacts substantially slower than acenaphthene.155 The k(2) value reported by Reisen and Arey155 is very similar to the theoretical value derived by Klamt.172 There is generally good agreement between the three k(2) values derived for the OH reaction with acenaphthylene.155,174,175
For reactions of anthracene, there is reasonable agreement, between k(2) values calculated theoretically by Klamt172 and experimentally by Brubaker and Hites.140k(2) values measured at 325 K by Biermann et al.169 and Goulay et al.158 were in agreement but both lower than that reported by Brubaker and Hites.140 Kwok et al.176 reported a much lower k(2) based on a k(Ant)/k(Phe) value of 1.0 ± 0.5 derived from samples taken during the reaction of phenanthrene with OH. It has therefore been suggested that the k(2) value measured by Kwok et al.176 may be erroneously low.
For the reaction of phenanthrene with OH, Atkinson147 recommended a k(2) value based on previous studies by Lorenz and Zellner156 and Biermann et al.169 This k(2) value is shown to be in good agreement with the subsequent studies by Brubaker and Hites140 and Lee et al.,159 both extrapolated to 298 K using the Arrhenius relationship, and slightly higher than the theoretical value derived by Klamt.172 The k(2) value derived by Kwok et al.176 is a factor of two lower than that of the other rate coefficient values in Table 3 for a similar temperature.
The k(2) values for the reaction of fluorene with OH from three experimental studies140,170,177 and a theoretical study172 do agree well. To our knowledge, the only k(2) measurements for the gas phase reaction of fluoranthene and pyrene with OH have been made by Brubaker and Hites140 and Atkinson et al.,163 respectively.
It is clear that k(2) values for gas-phase OH reactions depend strongly on the specific PAH molecular structure. For example, as noted by Brubaker and Hites,140 Ace has a higher reaction rate than Nap. Both compounds consist of two fused aromatic rings but it is suggested that the reactivity of Ace towards OH is enhanced by H-atom abstraction occurring at the cyclopentafused ring.155 Similarly, Acy is shown to be more reactive than Ace. This has been attributed to the higher reactivity of the unsaturated cyclopentafused ring of Acy with a more rapid OH addition to the CC than H-atom abstraction from the saturated cyclopenta-fused ring.155,173,174
The k(2) values for 1M-Nap and 2M-Nap are shown to be essentially identical suggesting that the mechanism of this reaction with OH will be the same for the two isomers. The presence of alkyl groups has been observed to have an ‘activating effect’ on OH reactivity for Nap171 and Phe159 (Table 4). In contrast, Banceu et al.175 reported k(2) values for 1,3DM-Nap and 2,3DM-Nap, which are lower than that of Nap. Furthermore, enhanced reactivity is not observed for 1-methylphenanthrene (1M-Phe). As yet, it is not known why 1M-Phe is not similarly activated.
| Compound | Relative reactivitya (k1(obs)/knap(obs)) |
|---|---|
| a From Phousongphouang and Arey.171 b From Lee et al.159 | |
| Nap | 1.00 |
| 1M-Nap | 1.71 |
| 2M-Nap | 2.02 |
| 1E-Nap | 1.52 |
| 2E-Nap | 1.68 |
| 1,2DM-Nap | 2.49 |
| 1,3DM-Nap | 3.13 |
| 1,4DM-Nap | 2.42 |
| 1,5DM-Nap | 2.51 |
| 1,6DM-Nap | 2.65 |
| 1,7DM-Nap | 2.84 |
| 1,8DM-Nap | 2.62 |
| 2,3DM-Nap | 2.57 |
| 2,6DM-Nap | 2.78 |
| 2,7DM-Nap | 2.87 |
| Compound | Relative reactivityb (k1(obs)/kphen(obs)) |
| Phe | 1.00 |
| 1M-Phe | 0.90 |
| 2M-Phe | 2.02 |
| 3M-Phe | 2.08 |
| 9M-Phe | 2.36 |
It is indicated that the reactivity of Ant towards OH is much faster than that of other 3-ring PAHs such as Phe and Fln.
The difference between Ant and Fln reactivity could possibly be explained by differences in the reaction mechanism at C9 which is the most likely position for OH attack for these compounds.178,179 It is suggested, based on reaction product studies (see Section 3.2.1.1.5.), that the H-abstraction mechanism will dominate at the C9 position for Fln,178 while the OH addition mechanism will dominate for reactions of Ant,140 which could explain the enhanced reactivity of Ant relative to Fln.
Ant and Phe have essentially the same 3-ring structure, only differing by the relative position of their aromatic rings. However, Ant appears to be significantly more reactive.
The most reactive sites for Phe are expected to be at the C11 and C12 positions, where net charge is greatest. However, product studies show that reaction occurs predominantly at the C9 and C10 positions.179–182 This suggests that the reactivity at the C11- and C12-positions could be sterically hindered, resulting in lower overall reactivity. Conversely, Ant is expected to have highest net charge at C9 and C10, which are sterically unhindered. This is confirmed by product studies which indicate reactions occurring at these sites,158,180 which possibly explain the relatively enhanced reactivity.
3.2.1.1.5. Reaction products. Products from the reactions of LMW PAHs with OH radicals in the presence of O2 and NOx have been investigated in a number of laboratory studies. More attention in the literature has been paid to the reactions of naphthalene but product investigations have also been carried out for alkylnaphthalenes, acenaphthene, acenaphylene, phenanthrene, anthracene, fluoranthene and pyrene.
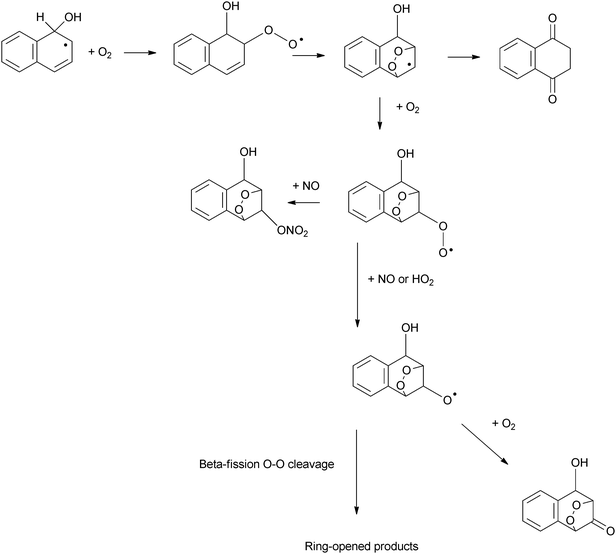
3.2.1.1.5.1. Naphthalene reaction products. The gas phase reaction of Nap with OH radicals has been shown to yield both ring-retaining and ring-opened products. Key ring-retaining products identified include naphthols, nitronaphthalenes and naphthoquinones.
1- and 2-naphthol isomers have been identified in product studies162,181–183 in yields of approximately 3–7%. The formation of naphthol isomers is expected to result from OH–Nap adduct rearomatization (Scheme 2a) or reaction with O2 and decomposition of the peroxy radical (Scheme 2cii).
1- and 2N-Nap isomers are also formed in these reactions.162,166,181,183,184 This would result from the pathway shown in Scheme 2b. Nishino et al.166 measured the formation yields of 1- and 2N-Nap to be 0.35% and 0.60% respectively. The higher yield observed for reaction occurring at C1 compared to C2 was also noted by Wang et al.185 who indicated that 68% of OH addition occurs at C1. This is in agreement with the theoretical calculations of Qu et al.,154 who calculated that the C1 adduct lies 10 kcal mol−1 lower in energy than the C2 adduct.
1,2- and 1,4-NQu isomers have also been observed as reaction products in yields of 1–6%.181,183,184 This could be expected to occur via the reaction in Scheme 2d. An alternative pathway is suggested by Lee and Lane181 and Kautzman et al.184via 1-hydroxynaphthalene-2-one and 1-hydroxynaphthalene-4-one to yield 1,2-NQu and 1,4-NQu respectively (Scheme 3). It has also been suggested that 1,4-NQu can be formed from the photolysis of 1-nitronaphthalene.162 Other ring retaining products identified from the reaction of Nap with OH include 2,3-epoxy-naphthoquinone, oxygenated indenes such as inden-1-one and 1,3-indene-dione, benzopyrones and nitro-naphthol isomers.181
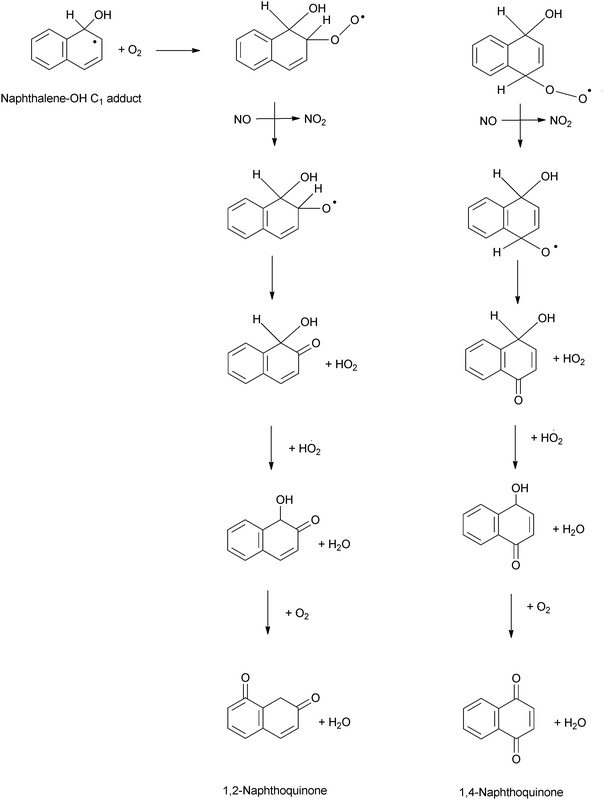 | ||
| Scheme 3 A proposed alternative reaction pathway for the formation of naphthoquinone isomers.183 | ||
Sasaki et al.182 reported that ring-retaining products represented only ∼30% of the reaction products from this process. Therefore understanding the ring-opening mechanism is important to fully understand these reactions. In particular, much interest has been paid to the formation and reactivity of the ring-opened species 2-FCA, identified as the main reaction product of naphthalene with OH.166,181–186
The product yield of 2-FCA from this reaction was estimated to be 46–71% by Nishino et al.186 Other studies have reported lower formation yields182,183 but these did not take the rapid loss of 2-FCA due to photolysis and reactivity with OH into account.186 The formation of FCA can be attributed to the mechanism shown Scheme 2ci, involving Nap–OH adduct reaction with O2 to form the peroxy radical intermediate or 2e involving reaction with O2 and NO, as predicted by Qu et al.154
Other ring opened products identified include phthalic acid, phthaldialdehyde and phthalic anhydride.181,182,184 Kautzman et al.184 suggested that these were formed from the further reaction of 2-FCA with OH. An alternative reaction pathway was also suggested involving reaction with O2 to yield C7 and C9 compounds such as benzoic acid.
Kautzman et al.184 investigated the products from the naphthalene reaction with OH under both high (∼80 ppbV) and low NOx conditions. Two reaction pathways were proposed to yield 2-FCA: (i) a series of reactions initiated by the reaction of the Nap–OH adduct with O2 to yield a peroxy radical intermediate; (ii) reaction of the Nap–OH adduct involving O2 and NO. These are summarized in Scheme 4. These mechanisms are in agreement with other product studies182,183 and theoretical calculations.154 It is not currently possible to establish the relative dominance of either of these proposed routes.
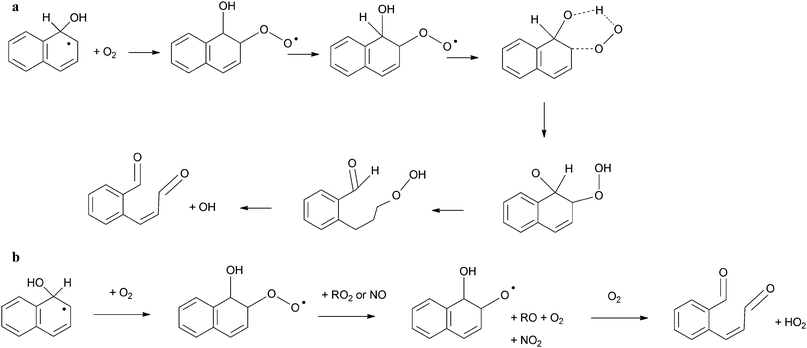 | ||
| Scheme 4 Summary of pathways to 2-formylcinnamaldehyde from the naphthalene–OH adduct: (a) via reaction with O2, (b) via reaction with O2/NO/RO2. | ||
The presence of organic peroxides in the product study by Kautzman et al.184 was attributed to an alternative reaction mechanism, initiated similarly by the reaction of the Nap–OH adduct with O2, but proceeding via the formation of a bicyclic peroxy radical (Scheme 5). This mechanism is suggested to lead to the formation of both observed ring-opened species as well as peroxide or epoxide compounds.
 | ||
| Scheme 5 An alternative reaction scheme for the reaction of naphthalene–PAH adduct proceeding via a bicyclic peroxy radical.184 | ||
Under low NOx conditions, Kautzman et al.184 indicated that the dominant mechanism for the formation of products from naphthalene will differ from that at higher NOx levels. It was suggested that the reaction is dominated by the alkoxy radical reaction predominantly with HO2 to form ring-opened products such as 2-FCA. Under these low NOx conditions, 1,4-NQu is suggested to result from the reaction pathway detailed in Scheme 2d involving the addition of HO2 to 1-naphthol followed by reaction with O2 and two further additions of HO2.184
The identified products are broadly consistent with the suggested reaction mechanisms of Qu et al.154 (as detailed in Scheme 2). The product studies detailed above have allowed the identification of >90% of the products formed from the reaction of naphthalene with OH radicals. This has allowed relatively detailed reaction pathways for these processes to be suggested, despite some discrepancies in the literature. However, obtaining a full mass balance for this reaction is difficult due to the secondary reactions of the PAH reaction products.183 More work is clearly needed to fully understand these precise reaction mechanisms.
3.2.1.1.5.2. Reactions of other PAHs. Products identified from the reactions of Phe have included ring-opened species such as 2,2′-diformylbiphenyl, 9-fluorenone (9-Flr), 1-,2-,3-,4-, and 9-phenanthrols, 2-,3-,4- and 9-nitrophenanthenes (N-Phe), 1,4- and 9,10-phenanthraquinones (PQu), dibenzopyranone and 2- and 4-nitrodibenzopyranones, and ring-opened products such as 1,2-naphthalenedicarboxaldehyde and 1,2-naphthalic anhydride.180,185,187
Corresponding to the OH addition mechanism, it was suggested that the Phe–OH adduct would be formed via addition of OH to C1.182,187 This can then form the OH–phenanthrene–O2 peroxy radical, analogous to the reaction of naphthalene (Scheme 2), from which stable products can be formed through reaction with O2 (see Lee and Lane,187 for detailed discussion). Phenanthrols could also be formed through H-atom abstraction from the Phe–OH adduct.187 It was suggested that ring-opened products such as 1,2-naphthalenedicarboxaldehyde and 1,2-naphthalic anhydride are formed through cleavage of the central ring between C9–C10, the most active site for electrophilic attack for Phe.178,187
Wang et al.185 suggested that 2,2′-diformylbiphenyl is a primary product in this reaction, which then reacts further to produce 9-fluorenone and dibenzopyranone.178,179,185 The suggested pathway leading to PQu involved initial formation of a keto alcohol at the C9–C10 bond.179,185 The calculated formation yield of 9,10-PQu was ∼3%.185 Combining the measured formation yield with the rate coefficient,159 the authors calculated a PQu formation rate of 80 pg m−3 h−1.
Helmig et al.178 identified products from the reaction of Fln with OH in the presence of NOx, including hydroxyfluorenes, nitrofluorenes (N-Fln), 9-fluorenone (9-Flr) and nitrofluorenones. The formation of N-Fln isomers is attributed to the OH-addition mechanism analogous to that discussed for Nap and Phen (Scheme 1c and 2bi). The formation of 9-Flr is expected to proceed via H-atom abstraction of the –CH2– group followed by reaction with O2.178 The relatively high fluorenone yield (∼9%) compared to nitro-fluorenes (∼1%) may indicate a higher importance of the H-atom abstraction mechanism for Fln.
Nitro-PAH isomers have been identified from the gas-phase reactions of Ant, Flth and Pyr with OH.163,180,188 As with other studies, nitro-PAH product yields are low: 1-nitroAnt (0.2%), 2-nitroAnt (0.2%), 2-nitroPyr (0.5%) and 4-nitroPyr (0.06%) 2-nitroFlt (3%) 7-nitroFlt (1%) and 8-nitroFlt (0.3%).
It is clear that the formation of the observed products from the gas phase reactions of PAHs with OH radicals is initiated by the formation of the PAH–OH adduct. The nature and extent of the subsequent reaction pathway will then dictate the precise products formed. Different pathways have been suggested leading to the formation of both ring-retaining and ring-opened products. The relatively low yield of nitro-PAH products from these processes clearly suggests that the reaction of PAH–OH adducts with NO2 does not dominate and other mechanisms such as peroxy radical formation and reaction/decomposition are more significant.
In general, formation yields of nitro-PAHs are low, ranging from 0.2 to 5%. It should be noted that, for most PAHs, despite this considerable work, the majority of OH-radical reaction products remain unidentified.135 While it can be envisaged that reactions of 3- and 4-ring PAHs will proceed in ways analogous to naphthalene, to fully understand the mechanisms of these processes, the products from these reactions need to be investigated in more detail.
3.2.1.2. Gas phase reactions of PAHs with NO3 radicals.
3.2.1.2.1. Overview. The nitrate radical, NO3, plays an important role in tropospheric chemistry and is thought to be a key contributor to the oxidising capacity towards VOCs in the lower atmosphere.189–191
This has been demonstrated through investigations of NO3 reactions with alkanes,192–194 organosulphur compounds,192 aldehydes192,195–197 and hydroxy-substituted aromatics.198 These reactions may have further impacts on tropospheric reactions through the generation of peroxy radicals.192,199,200 A detailed overview of NO3 radical chemistry is provided by Geyer et al.191,201 but a brief discussion is provided here.
The levels of NO3 in the troposphere are controlled by the complex interplay of the reactions that lead to its formation or removal. In the troposphere, NO3 radicals are formed via the sequential reactions of NO and NO2 with O3:202–205
| NO + O3 → NO2 + O2 |
| NO2 + O3 → NO3 + O2 |
NO3 can be removed from the troposphere via photolysis by solar radiation.204–206
| NO3 + hν → NO + O2 |
| NO3 + hν → NO2 + O(3P) |
NO3 reaction with NO will also lead to its removal from the troposphere:207
| NO3 + NO → 2NO2 |
NO3 radicals can also be removed from the troposphere via reaction with NO2 to form N2O5, which can subsequently thermally decompose to NO3:202,208
| NO3 + NO2 + M ↔ N2O5 + M (M = N2, O2) |
The reaction rates for this process are shown to be the same for M = O2 and M = N2.209 It is also suggested that N2O5 can be removed by hydrolysis to form HNO3, which leads to the removal of NO3 from the atmosphere:189
| N2O5 + H2O → 2HNO3 |
Because of the rapid photolysis of NO3 and reaction with NO and O3 (as well as the reaction of NO with O3) the concentrations of the NO3 radical in the ambient troposphere will be low during daytime hours.210 Concentrations of NO3 will therefore be present in the troposphere at significant levels only during evening and night time hours when photolysis is absent and NO levels are low,135,151,203 except close to major sources of emissions.
Levels of NO3 in the troposphere will therefore be subject to substantial temporal and spatial variability,151 ranging from <5 × 10⁷ molecules cm−3 to 1 × 10¹⁰ molecules cm−3.204,210 Atkinson210 has suggested an average 12 h night time NO3 radical concentration in the lower troposphere of ∼5 × 10⁸ molecules cm−3 (∼20 pptV) over continental areas. This value is expected to be significantly lower in marine environments, with mixing ratios of ∼0.25 pptV measured at 3 km altitude in Mauna Loa, Hawaii,211 due to lower NO2 concentrations.194,211
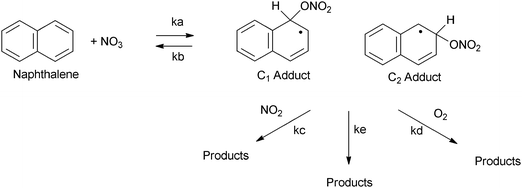
3.2.1.2.2. NO3 reaction mechanism. N2O5, NO2 and NO3 are effectively in equilibrium in the lower troposphere.203 Initial kinetic studies in mixtures of N2O5–NO3–NO2 suggested that these reactions are kinetically equivalent to the reaction with N2O5 alone.162,173,174,212 However, in a study by Atkinson et al.,203 2,3-dimethyl-2-butene was added to the reaction mixture of N2O5–NO3–NO2–N2–O2 and Nap to scavenge NO3 radicals. The removal of NO3 was shown to reduce the amount of naphthalene reacted by a factor of up to >100 indicating that Nap does not undergo elementary reaction with N2O5 to a significant degree.
It is therefore suggested that the reaction of PAHs in N2O5–NO3–NO2 mixtures involves the addition of NO3, formed from the thermal decomposition of N2O5, to the aromatic ring, in a reaction analogous to the reaction of OH radicals with PAH. The reaction scheme for this process is represented in Scheme 6. The reaction proceeds via initial addition of NO3 to the aromatic ring to form a nitratocyclohexadienyl-type radical (6a) (the PAH–NO3 adduct), which, similarly to the PAH–OH adduct can decompose back to reactants (6b), reacts with NO2 (6c) or O2 (6d) to form products135,151,210 or can undergo unimolecular decomposition (6e) that would lead to the formation of hydroxy-PAH products and further reaction to form nitro-hydroxy-PAHs.213
 | ||
| Scheme 6 Potential pathways for the reaction of PAHs with NO3.151 | ||
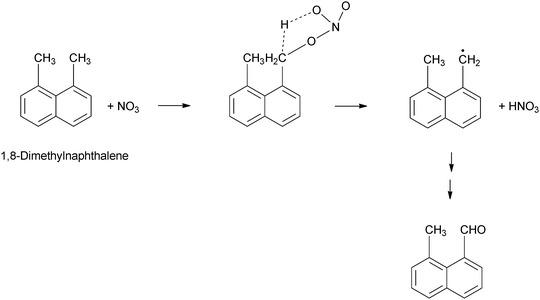
NO3 radicals can also interact with the substituent groups of compounds such as Ace, Acy and M-Nap210,214 (Scheme 7). For Ace, this involves H-atom abstraction from the C–H bond of the cyclopenta-fused ring and the formation of HNO3.174,180 For Acy, NO3 addition to the CC bond of the cyclopenta-fused ring is considered to be the dominant reaction pathway.174,180 However, for unsubstituted PAHs, the NO3-addition pathway is expected to dominate.210 It is thought that, for PAHs containing substituent groups, reaction will not result in nitro-PAH formation.180,210
 | ||
| Scheme 7 H-atom abstraction mechanism for the reaction of a methyl-substituted PAH with NO3.214 | ||
The measured rate coefficient for this reaction will therefore be:
| kobs = ka(kc[NO2] + kd[O2] + ke)/(kb + kc[NO2] + kd[O2] + ke) |
Assuming, as indicated by experimental data,162,203,210,212–215 under conditions used in reaction studies and in the ambient troposphere:
| kb ≫ (kc[NO2]) and kc[NO2] > (kd[O2] + ke) |
| kobs = ka(kc[NO2])/kb |
The observed rate coefficient will therefore be proportional to NO2 concentration. The decomposition rate coefficient of the Nap–OH adduct was calculated to be 5 × 10⁵ s−1. The PAH–NO3 adduct is therefore more stable towards decomposition compared to the monocyclic-NO3 adduct (decomposition rate coefficient of 3 × 10⁸ s−1 at 298 K). However, the NO3 adduct is estimated to be 46 kJ mol−1 less stable towards decomposition than the OH-adduct.210
It is also suggested from kinetic data that reaction of the NO3–PAH adduct with NO2 will dominate over the reaction with O2 under atmospherically relevant conditions. Atkinson et al.213 measured the rate coefficient of the NO3 reaction with Nap as a function of NO2 and O2 concentration. An upper limit of kd/kc < 4 × 10⁻⁷ was obtained at 298 ± 2 K. Therefore the reaction of the Nap–NO3 adduct with NO2 is expected to dominate relative to the reaction with O2 down to a NO2 mixing ratio of at least 80 ppbV (2 × 10¹² molecules cm−3) and possibly much lower.151
Qu et al.216 used high-level molecular orbital theory to predict NO3-initiated PAH reactions theoretically. It was shown that the Nap–NO3 adduct is formed by the attack of the O atom of NO3 at either the C1 or C2 positions. The proposed further reactions of the PAH–NO3 adduct are illustrated in Scheme 8. Two energetically favourable primary reaction pathways are proposed for the Nap–NO3 adduct(s) formed In the first pathway, loss of NO2 from the adduct leads to the formation of 1,2-epoxynaphthalene or 2,3-epoxynaphthalene for C1 and C2 adducts respectively (Scheme 8a). In the second pathway, the isomerisation of the NO3–naphthalene adduct followed by unimolecular decomposition leads to the formation of 2-FCA for the C1 adduct or 2-acetyl-cinnamaldehyde for the C2 adduct (Scheme 8b).
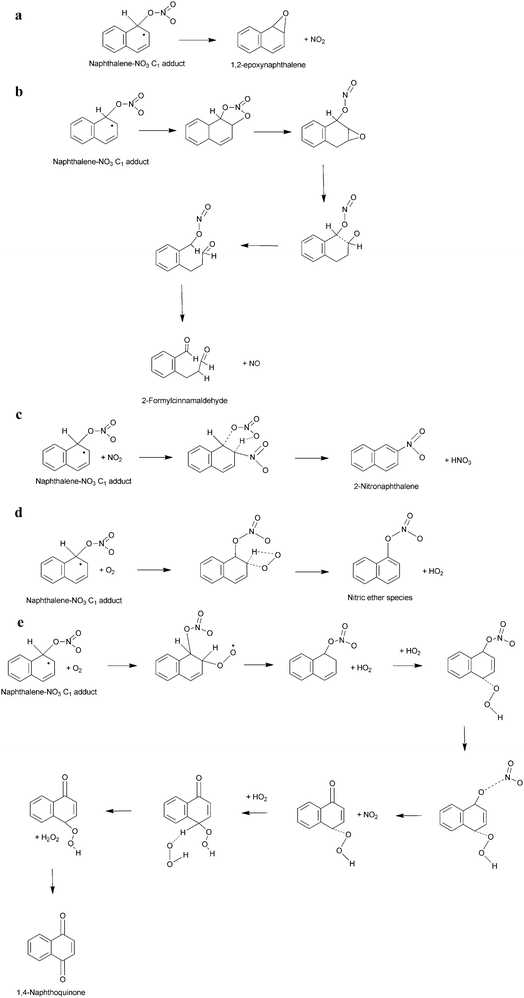 | ||
| Scheme 8 Proposed reaction pathways for the further reaction of the PAH–NO3 adducts: (a) unimolecular decomposition; (b) isomerisation followed by unimolecular decomposition; (c) reaction with NO2; (d) reaction with O2; (e) reaction with O2–HO2.216 | ||
It was also indicated that the Nap–NO3 adduct will also undergo secondary reactions with NO2, O2 or O2/HO2 and these reaction pathways will be strongly competitive with the unimolecular decomposition pathway. Mechanisms for the proposed reactions are shown in Scheme 8c–e respectively. The energetically favourable reaction with NO2 is expected to produce 2-nitronaphthalene and 1-nitronaphthalene isomers and HNO3 for the reactions of C1- and C2-adducts respectively, while the reaction with O2 is expected to produce a nitric ether species. Both of these pathways are expected to proceed via the formation and decomposition of an energy-rich intermediate.216 The reaction of the Nap–NO3 adduct with O2/HO2 is expected to produce 1,4-NQu. (Scheme 8e).
3.2.1.2.3. Rate coefficients. Relatively fewer rate coefficient studies have been carried out for gas-phase PAH reactions with NO3 than for the corresponding reactions with OH radicals. Measured or derived k(2) values for the gas phase reactions of PAHs with NO3 radicals, along with the reaction conditions are presented in Table 5.
| k NO3 (cm−3 molecules−1 s−1) (× [NO2]) |
k
NO3 (s−1) [NO2] = 6.91 × 10¹¹ molecules cm−3a |
Ref. | T (K) | Notes | |
|---|---|---|---|---|---|
| a [NO2] = 6.91 × 10¹¹ molecules cm−3; annual average, Harwell, UK (2011). b [NO2] = <1.2 × 10¹⁵ molecules cm−3. c [NO2] = (7.2–24) × 1013 molecules cm−3. d [NO2] = (4.8–24) × 1013 molecules cm−3. | |||||
| Nap | 8.5 × 10⁻²⁸ | 1.1 × 10⁻¹⁶ | Pitts et al.212 | 298 ± 2 | RR relative to K5(NO3 + NO2 − N2O5) = 3.41 × 10⁻¹¹ cm−3 molecules−1 s−1 |
| 4.8 × 10⁻²⁸ | 6.2 × 10⁻¹⁷ | Atkinson et al.162 | 298 ± 2 | RR relative to K5(NO3 + NO2 − N2O5) = 3.41 × 10⁻¹¹ cm−3 molecules−1 s−1 | |
| 3.3 × 10⁻²⁸ | 4.3 × 10⁻¹⁷ | Atkinson and Aschmann174 | 296 ± 2 | RR relative to k(propene) = 9.45 × 10⁻¹⁵ cm−3 molecules−1 s−1 | |
| 3.7 × 10⁻²⁸ | 4.7 × 10⁻¹⁷ | Atkinson et al.163 | ∼297 | RR relative to k(thioprene) = 9.93 × 10⁻¹⁴ cm−3 molecules−1 s−1, measured over temp. range 272–297 K | |
| 4.2 × 10⁻²⁸ | 5.5 × 10⁻¹⁷ | Atkinson et al.163 | ∼297 | RR relative to K5(NO3 + NO2 − N2O5) = 1.26 × 10⁻²⁷ e11275/T cm−3 molecules−1 s−1, measured over temp. range 272–297 K | |
| 3.6 × 10⁻²⁸ | 4.6 × 10⁻¹⁷ | Atkinson210 | 298 | Recommended value | |
| 1M-Nap | 8.4 × 10⁻²⁸ | 1.1 × 10⁻¹⁶ | Atkinson and Aschmann173 | 298 ± 2 | RR relative to k(naphthalene) = 3.6 × 10⁻²⁸ cm−3 molecules−1 s−1 |
| 7.0 × 10⁻²⁸ | 9.0 × 10⁻¹⁷ | Atkinson and Aschmann174 | 296 ± 2 | RR relative to k(trans-2-butene) = 3.89 × 10⁻¹³ cm−3 molecules−1 s−1 | |
| 7.7 × 10⁻²⁸ | 9.9 × 10⁻¹⁷ | Atkinson210 | 298 | Recommended value | |
| 7.2 × 10⁻²⁸ | 9.2 × 10⁻¹⁷ | Phousongphouang and Arey214 | 298 ± 2 | RR relative to k(naphthalene) = 3.65 × 10⁻²⁸ cm−3 molecules−1 s−1, derived from the same work | |
| 2M-Nap | 1.1 × 10⁻²⁷ | 1.4 × 10⁻¹⁶ | Atkinson and Aschmann173 | 298 ± 2 | RR relative to k(naphthalene) = 3.6 × 10⁻²⁸ cm−3 molecules−1 s−1 |
| 1.1 × 10⁻²⁷ | 1.4 × 10⁻¹⁶ | Atkinson and Aschmann174 | 296 ± 2 | RR relative to k(propene) = 9.45 × 10⁻¹⁵ cm−3 molecules−1 s−1 | |
| 1.1 × 10⁻²⁷ | 1.4 × 10⁻¹⁶ | Atkinson210 | 298 | Recommended value | |
| 1.0 × 10⁻²⁷ | 1.3 × 10⁻¹⁶ | Phousongphouang and Arey214 | 298 ± 2 | RR relative to k(naphthalene) = 3.65 × 10⁻²⁸ cm−3 molecules−1 s−1, derived from the same work | |
| 1E-Nap | 9.8 × 10⁻²⁸ | 1.3 × 10⁻¹⁶ | Phousongphouang and Arey214 | 298 ± 2 | RR relative to k(naphthalene) = 3.65 × 10⁻²⁸ cm−3 molecules−1 s−1, derived from the same work |
| 2E-Nap | 8.0 × 10⁻²⁸ | 1.0 × 10⁻¹⁶ | Phousongphouang and Arey214 | 298 ± 2 | RR relative to k(naphthalene) = 3.65 × 10⁻²⁸ cm−3 molecules−1 s−1, derived from the same work |
| 1,2DM-Nap | 6.4 × 10⁻²⁷ | 8.3 × 10⁻¹⁶ | Phousongphouang and Arey214 | 298 ± 2 | RR relative to k(2,7-DMN) = 21 × 10−28 cm−3 molecules−1 s−1, derived from the same work |
| 1,3DM-Nap | 2.1 × 10⁻²⁷ | 2.7 × 10⁻¹⁶ | Phousongphouang and Arey214 | 298 ± 2 | RR relative to k(naphthalene) = 3.65 × 10⁻²⁸ cm−3 molecules−1 s−1, derived from the same work |
| 1,4DM-Nap | 1.3 × 10⁻²⁷ | 1.7 × 10⁻¹⁶ | Phousongphouang and Arey214 | 298 ± 2 | RR relative to k(naphthalene) = 3.65 × 10⁻²⁸ cm−3 molecules−1 s−1, derived from the same work |
| 1,5DM-Nap | 1.4 × 10⁻²⁷ | 1.8 × 10⁻¹⁶ | Phousongphouang and Arey214 | 298 ± 2 | RR relative to k(naphthalene) = 3.65 × 10⁻²⁸ cm−3 molecules−1 s−1, derived from the same work |
| 1,6DM-Nap | 1.7 × 10⁻²⁷ | 2.1 × 10⁻¹⁶ | Phousongphouang and Arey214 | 298 ± 2 | RR relative to k(naphthalene) = 3.65 × 10⁻²⁸ cm−3 molecules−1 s−1, derived from the same work |
| 1,7DM-Nap | 1.4 × 10⁻²⁷ | 1.7 × 10⁻¹⁶ | Phousongphouang and Arey214 | 298 ± 2 | RR relative to k(naphthalene) = 3.65 × 10⁻²⁸ cm−3 molecules−1 s−1, derived from the same work |
| 1,8DM-Nap | 2.1 × 10⁻²⁶ | 2.7 × 10⁻¹⁵ | Phousongphouang and Arey214 | 298 ± 2 | RR relative to k(2,7-DMN) = 21 × 10−28 cm−3 molecules−1 s−1, derived from the same work |
| 2,3DM-Nap | 1.5 × 10⁻²⁸ | 1.9 × 10⁻¹⁷ | Atkinson and Aschmann173 | 298 ± 2 | RR relative to k(naphthalene) = 3.6 × 10⁻²⁸ cm−3 molecules−1 s−1 |
| 1.6 × 10⁻²⁷ | 2.1 × 10⁻¹⁶ | Atkinson and Aschmann174 | 296 ± 2 | RR relative to k(propene) = 9.45 × 10⁻¹⁵ cm−3 molecules−1 s−1 | |
| 1.6 × 10⁻²⁷ | 2.0 × 10⁻¹⁶ | Atkinson210 | 298 | Recommended value | |
| 1.5 × 10⁻²⁷ | 2.0 × 10⁻¹⁶ | Phousongphouang and Arey214 | 298 ± 2 | RR relative to k(naphthalene) = 3.65 × 10⁻²⁸ cm−3 molecules−1 s−1, derived from the same work | |
| 2,6DM-Nap | 2.1 × 10⁻²⁷ | 2.7 × 10⁻¹⁶ | Phousongphouang and Arey214 | 298 ± 2 | RR relative to k(naphthalene) = 3.65 × 10⁻²⁸ cm−3 molecules−1 s−1, derived from the same work |
| 2,7DM-Nap | 2.1 × 10⁻²⁷ | 2.7 × 10⁻¹⁶ | Phousongphouang and Arey214 | 298 ± 2 | RR relative to k(naphthalene) = 3.65 × 10⁻²⁸ cm−3 molecules−1 s−1 |
| Ace | 4.6 × 10⁻¹³b |
Atkinson and Aschmann174 | 296 ± 2 | RR relative to k(trans-2-butene) = 3.89 × 10⁻¹³ cm−3 molecules−1 s−1 | |
| 1.7 × 10⁻²⁷ | 2.1 × 10⁻¹⁶ | Atkinson and Aschmann174 | 296 ± 2 | RR relative to k(trans-2-butene) = 3.89 × 10⁻¹³ cm−3 molecules−1 s−1 | |
| Acy | 5.5 × 10⁻¹²b |
Atkinson and Aschmann174 | 296 ± 2 | RR relative to k(trans-2-butene) = 3.89 × 10⁻¹³ cm−3 molecules−1 s−1 | |
| Fln | 3.5 × 10⁻¹⁴c |
Kwok et al.177 | 297 ± 2 | RR relative to k(1-butene) = 1.19 × 10⁻¹⁴ cm−3 molecules−1 s−1 | |
| Phe | 1.2 × 10⁻¹³d |
Kwok et al.176 | 296 ± 2 | RR relative to k(1-butene) = 1.19 × 10⁻¹⁴ cm−3 molecules−1 s−1 | |
| Flt | 5.1 × 10⁻²⁸ | 6.6 × 10⁻¹⁷ | Atkinson et al.163 | 296 ± 2 | RR relative to k(naphthalene) = 3.6 × 10⁻²⁸ cm−3 molecules−1 s−1 |
| Pyr | 1.6 × 10⁻²⁷ | 2.1 × 10⁻¹⁶ | Atkinson et al.163 | 296 ± 2 | RR relative to k(naphthalene) = 3.6 × 10⁻²⁸ cm−3 molecules−1 s−1 |
| 1N-Nap | 3.0 × 10⁻²⁸ | 3.9 × 10⁻¹⁷ | Atkinson210 | 298 | Recommended value |
| 2N-Nap | 2.7 × 10⁻²⁸ | 3.5 × 10⁻¹⁷ | Atkinson210 | 298 | Recommended value |
Atkinson210 derived a k(2) value for the reaction of naphthalene with NO3 based on a unit-weighted least squares analysis of three k(2) values from previous studies.163,173,174 It was also shown that the k(2) value for the NO3 reaction with naphthalene is lower than that of naphthalene-d8 (kD/kH ∼ 1.2),203 indicating that there is very little deuterium isotope effect, suggesting that the H-atom abstraction mechanism is of minor importance.
Atkinson210 recommended k(2) values for 1M-Nap, 2M-Nap and 2,3DM-Nap using unit-weighted averages of the previous values provided by Atkinson and Aschmann.173,174k(2) values measured by Phousongphouang and Arey214 for 1M-Nap, 2M-Nap, and 2,3DM-Naps are in very good agreement with values recommended by Atkinson.210 It is indicated that the k(2) for the reaction of naphthalene and alkyl-naphthalenes with NO3 radicals is linearly dependent on the NO2 mixing ratio over the range ∼0.4–50 ppmV.174,210,213 This is therefore consistent with the initial formation of the NO3–alkylnaphthalene adduct.
It is indicated that, as for OH radical reactions, alkyl substitution enhances PAH reactivity towards NO3 following the general order of reactivity DM-Naps > E-Naps > M-Naps > Nap.214 The ‘enhancement factor’ reported for alkylnaphthalene compounds towards NO3 generally parallels those for the reactions of OH, with relative enhancement ratios (NO3/OH) of between 1.1 and 2.1 for most compounds. The exceptions are 1,2DM-Nap and 1,8DM-Nap, where the relative enhancement is 7.0 and 22 respectively. While potential explanations, including the steric influence of the methyl group positioning and the possible decrease of ring aromaticity, have been suggested, the precise reason for this enhanced reactivity is not currently known.
Atkinson210 noted that the rate coefficient for Ace is similar to that of 2,3DM-Nap, suggesting that the cyclopenta-fused ring in Ace acts like two methyl substituent groups. As mentioned above, Ace is expected to react via H-atom abstraction from the –CH2– group(s) of the cyclopenta-fused ring in addition to the NO3 addition mechanism.
To our knowledge, the only k(2) value derived for the gas phase reaction of NO3 with fluorene was that reported by Kwok et al.177 In this study, no evidence of an NO2-dependent k(2) was observed, suggesting that the NO3-addition mechanism does not dominate.210 Indeed, it was suggested that the reaction proceeds via H-atom abstraction from the –CH2– group(s). k(2) values for the gas phase reactions of Flt and Pyr with NO3 radicals have only been studied in one investigation.163 For both compounds it was suggested that the reaction proceeds via initial addition of NO3 to the aromatic ring, as detailed above.
NO3 reactivity with Phe was studied by Kwok et al.215 A linear relationship between k(2) and NO2 concentration indicates that the reaction proceeds by the initial addition of NO3 to the aromatic ring, forming the Phe–NO3 adduct. Kinetic data215 also suggested that an additional mechanism occurs, independent of NO2 concentration. This may involve NO3 addition to the C9–C10 bond215 or unimolecular decomposition of the NO3–phenanthrene adduct.216
The k(2) values in Table 5 indicate that the gas phase reactions of LMW PAHs with NO3 radicals proceed significantly slower (1–3 orders of magnitude) than the corresponding reactions with OH radicals. This would suggest that OH radical reactions represent a much more important loss process for PAHs than reactions with NO3. The relative scarcity of rate coefficient data makes observations regarding the differences in NO3 reactivity between individual PAHs more difficult. As with the OH radical reaction, it appears that Acy reacts faster than Ace and Nap, which can be attributed to the additional H-atom abstraction from the CC bond of the cyclopenta-fused ring. To our knowledge, no rate coefficient data are available for the reaction of NO3 with Ant so no comparison can be made between this and the other 3 ring compounds.
3.2.1.2.4. Reaction products. Reaction of PAHs through the more dominant NO3 addition mechanism followed by preferential addition of NO2 is expected to yield nitro-PAH isomers, while reactions involving NO3 interaction with substituent groups through H-atom abstraction, for example Ace and Acy, and Fln, are not. As with the reactions involving OH radicals, the NO3 radical product studies have focused primarily on the reactions of naphthalene with a smaller number of studies investigating other 3–4 ring compounds.
As with OH reactions, product studies show that the NO3 initiated reaction of Nap forms the ring-retaining products naphthols, nitronaphthalenes and naphthoquinones. 1- and 2-nitronaphthalenes have been identified as reaction products in yields of 15–24% and 7–11% respectively.163,173,182,212 The reaction mechanism is consistent with the expected NO3 addition at the C1 or C2 of Nap to form the Nap–OH adduct, followed by addition of NO2 (Scheme 8c). The formation yield ratio for 1N-Nap/2N-Nap observed in these studies is in good agreement, and is shown to be ∼2.2.
Other lower yield products identified182 include 1,4-NQu (1.9%), 1-hydroxy-2-nitronaphthalene (1.5%) and 2-hydroxy-1-nitronaphthalene (1.3%). The observed products are broadly consistent with the reaction mechanism detailed in Scheme 8. The formation of 1,4-NQu could be explained by pathways involving either (i) reaction of the Nap–NO3 adduct with O2/HO2 (Scheme 8e) or (ii) reaction of naphthols. It should be noted that the epoxynaphthalene and nitric ether species predicted by Qu et al.216 have not been identified in product studies.
Atkinson et al.213 identified naphthols and nitronaphthols. It was shown that the ratio of nitronaphthols/nitronaphthalenes was a factor of 1.6 higher when there was no initial NO2 addition compared to a reaction where NO2 was initially present. This could indicate that the unimolecular decomposition of the PAH–NO3 adduct (e) could be competitive with the assumed dominant reaction with NO2.
Wang et al.217 found that (with the exception of 1,4DM-Nap) the yields of EN-Naps and DM-Naps over the range of NO2 mixing ratios of 0.2–2 ppmV are not linearly dependent upon NO2 concentration and that the EN-Nap/DMN-Nap profile did not change significantly with varying NO2 concentration over this range. It was shown that, as the NO2 concentration increased by a factor of 8, the EN-Nap and DMN-Nap formation yield only increased by a factor of 3. This suggests that the OH-addition mechanism may not dominate for these compounds.
However, Zielinska et al.218 reported that nitro-PAH products were formed from the gas phase reaction of 1M-Nap and 2M-Nap with NO3 in yields of ∼30%, approximately two orders of magnitude higher than the corresponding reaction initiated by OH. The MNN isomer distribution from the reaction of 1M-Nap was shown to be 1M3N-Nap > 1M5N-Nap > 1M4N-Nap > 1M8N-Nap ∼ 1M6N-Nap > 1M7N-Nap > 1M2N-Nap. For the reaction with 2M-Nap the isomer distribution was 2M4N-Nap > 2M1N-Nap ∼ 2M5N-Nap > 2M8N-Nap ∼ 2M3N-Nap ∼ 2M7N-Nap ∼ 2M6N-Nap.
Wang et al.219 found that the isomers with the highest mass formation rates are 2,7DM4NN, 1,2DM4NN, 2,6DM4N-Nap, 2,6DM1N-Nap, 1,6DM8N-Nap, 2,7DM1N-Nap, 1,6DM5N-Nap, 2E4N-Nap. The formation of these products was attributed to the addition of NO3 to an alpha-carbon next to the –CH3 group (in the case of the formation of 2,7DM4N-Nap, 2,6DM4N-Nap, 1,6DM8N-Nap, 2E4N-Nap), to an alpha-carbon on the methyl-substituted ring (in the case of 2,7DM1N-Nap, 2,6DM1N-Nap and 1,6DM5N-Nap) or ipso addition at C1 (in the case of 1,2DM4N-Nap), followed by the addition of NO2 at the para-position and removal of HNO3. This proposed mechanism is therefore consistent with the NO3 addition to the aromatic ring. It was also indicated that these reactions also yield ring-opened aromatic carbonyl (MW 170) products and alkylnaphthoquinones.217
For the gas phase reaction of Acy with NO3, Atkinson and Aschmann174 observed negligible levels of N-Acy isomers with the major products observed being oxygenated. Therefore a reaction pathway, possibly involving NO3 addition to the CC bond of the cyclopenta-fused ring, is proposed.173,174 Arey et al.180 observed the main reaction product of the reaction of Ace and NO3 to be 4-NAce with a yield of ∼40% with smaller amounts of the 3- and 5-isomers (∼2%), in agreement with the NO3 addition mechanism of to the aromatic ring and subsequent reaction with NO2.
The gas phase reaction of Fln with NO3 was shown to yield 9-fluorenone,177 which is consistent with the observation that this reaction proceeds via initial H-atom abstraction from a –CH2– group of Fln, rather than through initial NO3 addition to the aromatic ring.
For Ant, Phe and Pyr, nitro-PAH products are noted in low formation yields (<2%).163,174,180 The formation of 2-nitroFlt from the reaction of Flt with N2O5 in CCl4 and in the gas phase has been observed with a relatively high yield (24%).163,220 The observation of these nitro-PAH products is in agreement with the expected NO3 addition mechanism with further reaction with NO2 (Scheme 8c).
Wang et al.221 observed the presence of 9-Flr, dibenzopyranone, 9,10-PQu and 2,2′-diformylbiphenyl from the gas phase reaction of Phe with NO3. The reaction was suggested to proceed analogously to that of the OH-initiated reaction, with NO3 addition at the C9–C10-position expected. The calculated formation yield of 9,10-PQu was ∼33%. Combining the measured formation yield with the room temperature rate coefficient,176 the authors calculated a PQu formation rate of 800 pg m−3 h−1, suggesting that nighttime NO3-initiated reaction can contribute significantly to the atmospheric levels of PQu.221
The above studies indicate that for a number of PAHs (e.g. naphthalene, alkylnaphthalenes, acenaphthene, fluoranthene) the yield of nitro-PAH products from the NO3-initiated reaction is notably higher than that of the corresponding reaction initiated by OH radicals, suggesting the Nap–NO3 adduct reacts more preferentially with NO2 than the Nap–OH adduct. This would suggest that, while NO3 reactions may represent a less important atmospheric loss process for gas phase PAHs, these reactions are a more important source of nitro-PAH products. This indicates therefore that while during daylight hours the formation of PAH-derivatives will result from OH-initiated reactions, nighttime formation of these compounds from NO3-initiated reactions will also be significant.
3.2.1.3. Gas phase reactions of PAHs with O3. Ozone (O3) forms part of a complex reaction cycle with volatile organic compounds, for example alkenes, alkanes, aromatic hydrocarbons, aldehydes and ketones, and other atmospheric gases such as O2 and NOx, which will lead to the formation of radical species, which influence the composition and oxidising potential of the atmosphere.148,222,223 In addition, direct reaction with ozone can be an important atmospheric loss process for volatile organic chemicals.148,223
The available k(2) values for the reactions of ozone with gas phase PAHs are shown in Table 6. Experimental studies have reported no loss, or very small loss of PAH during exposure studies with relatively high (∼4 × 10¹³ molecules cm−3) O3 concentrations.144,168,173,177 These studies therefore report estimated upper limits for k(2) values considerably lower (5–8 orders of magnitude) than the corresponding reactions with OH or NO3.
| k O3 (cm−3 molecules−1 s−1) | Ref. | T (K) | Notes | |
|---|---|---|---|---|
| Nap | <2.0 × 10⁻¹⁹ | Atkinson et al.168 | 294 ± 1 | Upper limit |
| <3.0 × 10⁻¹⁹ | Atkinson and Aschmann144 | 295 ± 1 | Upper limit | |
| 1M-Nap | <1.3 × 10⁻¹⁹ | Atkinson and Aschmann173 | 298 ± 2 | Upper limit |
| 2M-Nap | <3.0 × 10⁻¹⁹ | Atkinson and Aschmann144 | 295 ± 1 | Upper limit |
| <4.0 × 10⁻¹⁹ | Atkinson and Aschmann173 | 295 ± 2 | Upper limit | |
| Ace | <5.0 × 10⁻¹⁹ | Atkinson and Aschmann174 | 296 ± 2 | Upper limit |
| Acy | 5.5 × 10⁻¹⁶ | Atkinson and Aschmann174 | 296 ± 2 | |
| 1.6 × 10⁻¹⁶ | Reisen and Arey155 | 296 ± 2 | RR, relative to k(2-methyl-2-butadiene) = 3.96 × 10⁻¹⁶ cm−3 molecules−3 s−1 | |
| 2,3DM-Nap | <4.0 × 10⁻¹⁹ | Atkinson and Aschmann144 | 295 ± 1 | Upper limit |
| <2.0 × 10⁻¹⁹ | Kwok et al.177 | 297 ± 2 | Upper limit | |
| Phe | 4.0 × 10⁻¹⁹ | Kwok et al.176 | 296 ± 2 | |
| 1N-Nap | <6.0 × 10⁻¹⁹ | Atkinson207 | 298 ± 2 | Upper limit |
| 2N-Nap | <6.0 × 10⁻¹⁹ | Atkinson207 | 298 ± 2 | Upper limit |
Kwok et al.176 did observe the reaction of phenanthrene with (8.7–15.6) × 1013 molecules cm−3 of O3 and derived a k(2) value for this reaction, which was shown to be of the same order of magnitude as the upper limits calculated for other PAHs in previous studies. These observations therefore indicate that reactions of gas phase PAHs with O3 will be negligible under atmospheric conditions and for most PAHs the reaction with ozone is too slow to be a significant degradation process or route to the formation of derivative products.
The relatively slow reaction of PAHs indicates that O3 does not react to any observable extent with the aromatic ring or with saturated side-chain groups. However, it should be noted that the reaction of acenaphthylene with O3 proceeds significantly (∼3 orders of magnitude) faster than other PAHs. This is attributed to ozone reacting with the CC bond of the unsaturated cyclopenta-fused ring.155,174
Reisen and Arey155 conducted a product study for the reaction of acenaphthylene with ozone. API-MS analysis identified a single secondary ozonide product. GC-MS analysis identified six other products: 1-naphthaldehyde, oxaacenaphthylen-2-one, 2-hydroxy-1-naphthaldehyde, 1,8-naphthalic anhydride (NtA) and two dialdehyde isomers (MW 184). These products were attributed to breakdown products of the secondary ozonide. A more comprehensive and quantitative product study is required to fully understand the reaction mechanism of this process.
Wang et al.221 observed the presence of 9-fluorenone (9-Fln), dibenzopyranone, 9,10-phenanthrequinone (PQu) and 2,2′-diformylbiphenyl from the gas phase reaction of phenanthrene with O3. The authors suggested that the mechanism would involve addition of O at the C9–C10 bond and rearrangement to a secondary ozonide. The calculated formation yield of 9,10-PQu was ∼2%. Combining the measured formation yield with the room temperature rate coefficient,176 the authors calculated a PQu formation rate of 0.2 pg m−3 h−1, suggesting that reaction with O3 is not a significant source of PQu in the atmosphere, compared with OH and NO3 radical induced reactions.
3.2.1.4. Summary and concluding remarks.
3.2.1.4.1. Key conclusions. • The main sink for gas phase PAHs appears to be reaction with the OH radical, with rate coefficients for these reactions shown to be considerably (up to 5 orders of magnitude) higher than the corresponding reactions with NO3 for most 3–4 ring PAHs.
• For most PAHs, the dominant gas phase reaction mechanism involves addition of the OH or NO3 radical to the aromatic ring to form an energy-rich adduct. Further reaction of this adduct with NO2 will yield nitro-PAH products while adduct reaction with O2 will form a peroxy-radical intermediate which can further react or decompose via a number of different pathways to yield ring-retaining products such as quinones, or a wide range of ring-opened products.
• Product studies suggest, for a number of PAHs, that the reaction is expected to proceed, at least in part due to the H-atom abstraction mechanism from C–H groups from the aromatic ring (fluorene), substituted alkyl groups (methyl- and ethyl-naphthalenes) or radical interaction with the CC bond of the cyclopenta-fused ring (acenaphthylene).
• While NO3 reactions appear to be less significant than OH reactions as a PAH degradation process, considerably higher nitro-PAH yields suggest that night-time reactions of PAHs with NO3 may be a significant contributor of these compounds in the atmosphere, in addition to day-time OH reactions.
• Reactions of PAHs with O3 are considered to be of negligible importance in the atmosphere due to a slow reaction with the aromatic ring. The reaction of acenaphthylene is shown to be faster due to interaction of ozone with the CC bond of the cyclopenta-fused ring.
• While reasonable agreement is shown between rate coefficients for the reactions of OH, NO3 and O3 derived in different studies (absolute, relative, theoretical) for individual PAHs, discrepancies can often be explained by differences in reaction conditions and quantification methods used.
• There is shown to be considerable variation in reactivity with OH between individual PAH molecules. Reactivity is dependent upon the precise reaction mechanism and can be influenced by steric hindrance of reactive sites and the number and type of substituted groups. Alkyl groups are shown to have an ‘activating effect’ compared to the reactivity of 2- and 3-ring PAHs.
• The mechanisms of gas phase PAH reactions are still not fully understood. For most PAHs, the majority of reaction products remain unidentified and the precise reaction routes of these processes are still largely unclear. The applicability of observations from experimental studies in the ambient atmosphere is also uncertain (discussed in Section 5).
3.2.1.4.2. Recommendations for future work. The following are areas we suggest for continued research in the area of gas phase PAH reactivity:
• The rates and products of the reactions of Ant with NO3 and O3 and of most (predominantly gaseous) 4-ring PAHs with OH, NO3 and O3 should be studied.
• A more comprehensive elucidation of the reaction products of the reactions of many PAHs with OH and NO3 in order to gain a clearer understanding of the reaction mechanisms.
• Verifications of reaction rates based on atmospheric observations.
3.2.2.1. Overview. Volatile and semi-volatile organic compounds associated with particulate matter can be influenced by heterogeneous photochemical reactions in the atmosphere.224,225 Semi-volatile PAHs are shown to have a high affinity for soot and particulate matter.96,104 Since ambient air sampling studies have revealed that PAHs and their derivative compounds are found to be associated with atmospheric particles137,226–229 and given the wide range of particulate matter (soot, sands, mineral dusts, metal oxides, diesel exhausts, pollens) present in the atmosphere, it is important to understand the extent and nature of heterogeneous photochemical reactions that can lead to removal of PAHs from the atmosphere and/or their conversion to derivative compounds.
In the troposphere, direct photolysis of PAHs associated with solid surfaces is a potentially important process.1,230,231 The chemistry of direct photolytic PAH decomposition has been discussed elsewhere for PAHs associated with organic aerosols,232–238 inorganic substrates239–248 and the air–ice interface.249,250 Therefore, photolysis of surface-bound PAH will not be covered in this review. Here, we will discuss the present understanding of particle-associated PAHs with OH radicals, NO3 radicals, NO2 and O3.
Heterogeneous PAH reactivity towards atmospheric oxidants has previously been reviewed by Van Cauwenberghe and Van Vaeck230 and Van Cauwenberghe,251 who provided an overview and extensive literature review of atmospheric reactions of PAH on various surfaces including primary combustion particles and ambient particulate matter with O3 and NO2. Finlayson-Pitts and Pitts1 also provide an in depth discussion of PAH reactions with O3 and NO2 on particle surfaces. Here we provide an updated overview of heterogeneous PAH reactivity, incorporating more recent kinetic studies.
3.2.2.2. Heterogeneous PAH reactions with OH radicals.
3.2.2.2.1. Overview. Heterogeneous reactions of OH radicals with PAHs adsorbed on different solid surfaces have been reported in a number of experimental studies.252–257k(2) values derived for OH reactions with PAHs associated with different substrate types are presented in Table 7.
| PAH | OH reactions | NO2 reactions | O3 reactions | NO3 reactions | ||||||||
|---|---|---|---|---|---|---|---|---|---|---|---|---|
| k OH (cm3 molec−1 s−1) | Ref. | Notes | k NO2 (cm3 molec−1 s−1) | Ref. | Notes | k O3 (cm3 molec−1 s−1) | Ref. | Notes | k NO3 (cm3 molec−1 s−1) | Ref. | Notes | |
| Nap | 0.9 × 10⁻¹⁸/(1/cO3 + 10−15) | Kahan et al.296 | Octanol | |||||||||
| Phe | 5.0 × 10⁻¹² | Estève et al.255 | Graphite particles | 2.8 × 10⁻¹⁹ | Perraudin et al.276 | Silica particles | 2.4 × 10⁻¹⁷ | Perraudin et al.298 | Graphite particles | |||
| 3.2 × 10⁻¹³ | Estève et al.256 | Diesel exhaust particles SRM 1650a | 3.4 × 10⁻¹⁸ | Nguyen et al.275 | Kerosene flame soot | 2.3 × 10⁻¹⁷ | Perraudin et al.298 | Silica particles | ||||
| 3.5 × 10⁻¹⁷ | Estève et al.255 | Graphite particles | 2.3 × 10⁻¹⁹/(1/cO3 + 4.6 × 10⁻¹⁶) | Kahan et al.296 | Octanol | |||||||
| 1.1 × 10⁻¹⁷ | Estève et al.256 | Diesel exhaust particles SRM 1650a | 1.0 × 10⁻¹⁸/(1/cO3 + 1.4 × 10⁻¹⁶) | Kahan et al.296 | Ice | |||||||
| 2.3 × 10⁻²¹ | Butler and Crossley270 | Ethylene flame soot | ||||||||||
| Ant | 4.4 × 10⁻¹² | Estève et al.256 | Graphite particles | 1.0 × 10⁻¹⁶ | Perraudin et al.276 | Silica particles | 9.8 × 10⁻¹⁷ | Perraudin et al.298 | Graphite particles | |||
| 3.4 × 10⁻¹⁸ | Nguyen et al.275 | Kerosene flame soot | 1.4 × 10⁻¹⁶ | Perraudin et al.298 | Silica particles | |||||||
| 6.9 × 10⁻¹⁷ | Estève et al.255 | Graphite particles | 5.1 × 10⁻¹⁸/(1/cO3 + 1.96 × 10⁻¹⁵) | Kwamena et al.292 | Octanol | |||||||
| 1.0 × 10⁻¹⁶ | Ma et al.278 | Silica particles | 1.3 × 10⁻¹⁶/ (1/cO3 + 2.2 × 10⁻¹⁵) | Kwamena et al.301 | Azelaic acid (wet) | |||||||
| 5.3 × 10⁻¹⁷ | Ma et al.278 | MgO particles | 1.0 × 10⁻¹⁵/(1/cO3 + 10−13) | Kwamena et al.301 | Phenylsiloxane oil | |||||||
| 1.2 × 10⁻¹⁸/(1/cO3 + 1.2 × 10⁻¹⁸) | Mmereki et al.294 | Water | ||||||||||
| Flt | 1.4 × 10⁻¹⁴ | Bedjanian et al.252 | Kerosene flame soot | 3.2 × 10⁻²¹ | Perraudin et al.276 | Silica particles | 1.9 × 10⁻¹⁷ | Perraudin et al.298 | Graphite particles | |||
| 3.2 × 10⁻¹² | Estève et al.255 | Graphite particles | 1.0 × 10⁻¹⁹ | Nguyen et al.275 | Kerosene flame soot | 1.5 × 10⁻¹⁷ | Perraudin et al.298 | Silica particles | ||||
| 3.8 × 10⁻¹³ | Estève et al.256 | Diesel exhaust particles SRM 1650a | 2.9 × 10⁻¹⁷ | Estève et al.255 | Graphite particles | |||||||
| 1.0 × 10⁻¹⁷ | Estève et al.256 | Diesel exhaust particles SRM 1650a | ||||||||||
| 2.5 × 10⁻²¹ | Butler and Crossley270 | Ethylene flame soot | ||||||||||
| Pyr | 1.6 × 10⁻¹⁴ | Bedjanian et al.252 | Kerosene flame soot | 2.0 × 10⁻¹⁷ | Perraudin et al.276 | Silica particles | 2.5 × 10⁻¹⁷ | Perraudin et al.298 | Graphite particles | 6.4 × 10⁻¹² | Liu et al.260 | Azelaic acid particles |
| 3.2 × 10⁻¹² | Estève et al.255 | Graphite particles | 1.0 × 10⁻¹⁹ | Nguyen et al.275 | Kerosene flame soot | 5.9 × 10⁻¹⁷ | Perraudin et al.298 | Silica particles | ||||
| 4.1 × 10⁻¹³ | Estève et al.256 | Diesel exhaust particles SRM 1650a | 5.1 × 10⁻¹⁷ | Estève et al.255 | Graphite particles | 9.3 × 10⁻¹⁷ | Miet et al.297 | Silica particles | ||||
| 2.4 × 10⁻¹³ | Miet et al.257 | Silica particles | 1.5 × 10⁻¹⁷ | Estève et al.256 | Diesel exhaust particles SRM 1650a | 2.2 × 10⁻¹⁹/(1/cO3 + 3.1 × 10⁻¹⁶) | Kahan et al.296 | Octanol | ||||
| 4.8 × 10⁻²¹ | Butler and Crossley270 | Ethylene flame soot | ||||||||||
| 3.2 × 10⁻¹⁶ | Miet et al.277 | Silica particles | ||||||||||
| Chr | 9.2 × 10⁻¹⁵ | Bedjanian et al.252 | Kerosene flame soot | 6.0 × 10⁻¹⁹ | Perraudin et al.276 | Silica particles | 1.5 × 10⁻¹⁷ | Perraudin et al.298 | Graphite particles | 4.0 × 10⁻¹² | Liu et al.260 | Azelaic acid particles |
| 5.0 × 10⁻¹² | Estève et al.255 | Graphite particles | 1.0 × 10⁻¹⁹ | Nguyen et al.275 | Kerosene flame soot | 3.1 × 10⁻¹⁷ | Perraudin et al.298 | Silica particles | ||||
| 4.4 × 10⁻¹³ | Estève et al.256 | Diesel exhaust particles SRM 1650a | 3.9 × 10⁻¹⁷ | Estève et al.255 | Graphite particles | |||||||
| 1.0 × 10⁻¹⁷ | Estève et al.256 | Diesel exhaust particles SRM 1650a | ||||||||||
| 2.6 × 10⁻²¹ | Butler and Crossley270 | Ethylene flame soot | ||||||||||
| BaA | 9.2 × 10⁻¹⁵ | Bedjanian et al.252 | Kerosene flame soot | 6.7 × 10⁻¹⁸ | Perraudin et al.276 | Silica particles | 2.8 × 10⁻¹⁷ | Perraudin et al.298 | Graphite particles | 4.3 × 10⁻¹² | Liu et al.260 | Azelaic acid particles |
| 5.6 × 10⁻¹³ | Estève et al.255 | Graphite particles | 1.0 × 10⁻¹⁹ | Nguyen et al.275 | Kerosene flame soot | 8.7 × 10⁻¹⁷ | Perraudin et al.298 | Silica particles | ||||
| 3.2 × 10⁻¹³ | Estève et al.256 | Diesel exhaust particles SRM 1650a | 3.3 × 10⁻¹⁷ | Estève et al.255 | Graphite particles | |||||||
| 1.3 × 10⁻¹⁷ | Estève et al.256 | Diesel exhaust particles SRM 1650a | ||||||||||
| 6.2 × 10⁻²¹ | Butler and Crossley270 | Ethylene flame soot | ||||||||||
| BkF | 1.0 × 10⁻¹⁴ | Bedjanian et al.252 | Kerosene flame soot | 2.2 × 10⁻¹⁸ | Perraudin et al.276 | Silica particles | 1.9 × 10⁻¹⁷ | Perraudin et al.298 | Graphite particles | |||
| 3.5 × 10⁻¹² | Estève et al.255 | Graphite particles | 1.0 × 10⁻¹⁹ | Nguyen et al.275 | Kerosene flame soot | 3.6 × 10⁻¹⁷ | Perraudin et al.298 | Silica particles | ||||
| 2.5 × 10⁻¹⁷ | Estève et al.255 | Graphite particles | ||||||||||
| BaP | 1.1 × 10⁻¹⁴ | Bedjanian et al.252 | Kerosene flame soot | 9.3 × 10⁻¹⁶ | Perraudin et al.276 | Silica particles | 5.3 × 10⁻¹⁷ | Perraudin et al.298 | Graphite particles | |||
| 4.1 × 10⁻¹² | Estève et al.255 | Graphite particles | 1.0 × 10⁻¹⁹ | Nguyen et al.275 | Kerosene flame soot | 1.4 × 10⁻¹⁶ | Perraudin et al.298 | Silica particles | ||||
| 2.9 × 10⁻¹³ | Estève et al.256 | Diesel exhaust particles SRM 1650a | 7.8 × 10⁻¹⁷ | Estève et al.255 | Graphite particles | 2.0 × 10⁻¹⁸/(1/cO3 + 3.6 × 10⁻¹⁶) | Kahan et al.296 | Octanol | ||||
| 1.5 × 10⁻¹⁷ | Estève et al.256 | Diesel exhaust particles SRM 1650a | <3.8 × 10⁻¹⁸/(1/cO3 + 10−16) | Kwamena et al.291,292 | NaCl | |||||||
| 1.0 × 10⁻²⁰ | Butler and Crossley270 | Ethylene flame soot | 4.2 × 10⁻¹⁵/(1/cO3 + 2.8 × 10⁻¹³) | Kwamena et al.;292 Pöschl et al.290 | Soot | |||||||
| 1.7 × 10⁻¹⁶/(1/cO3 + 1.2 × 10⁻¹⁵) | Kwamena et al.291 | Azelaic acid (wet) | ||||||||||
| 3.0 × 10⁻¹⁶/(1/cO3 + 9.50 × 10⁻¹⁵) | Kwamena et al.292 | Silica particles | ||||||||||
| BeP | 1.1 × 10⁻¹⁴ | Bedjanian et al.252 | Kerosene flame soot | 2.9 × 10⁻¹⁸ | Perraudin et al.276 | Silica particles | 1.6 × 10⁻¹⁷ | Perraudin et al.298 | Graphite particles | |||
| 4.7 × 10⁻¹² | Estève et al.255 | Graphite particles | 1.0 × 10⁻¹⁹ | Nguyen et al.275 | Kerosene flame soot | 2.9 × 10⁻¹⁷ | Perraudin et al.298 | Silica particles | ||||
| 4.7 × 10⁻¹³ | Estève et al.256 | Diesel exhaust particles SRM 1650a | 3.5 × 10⁻¹⁷ | Estève et al.255 | Graphite particles | |||||||
| 7.5 × 10⁻¹⁸ | Estève et al.256 | Diesel exhaust particles SRM 1650a | ||||||||||
| 2.8 × 10⁻²¹ | Butler and Crossley270 | Ethylene flame soot | ||||||||||
| Per | 5.0 × 10⁻¹² | Estève et al.255 | Graphite particles | 1.1 × 10⁻¹⁶ | Estève et al.255 | Graphite particles | ||||||
| IPy | 3.5 × 10⁻¹³ | Estève et al.256 | Diesel exhaust particles SRM 1650a | 6.2 × 10⁻¹⁸ | Perraudin et al.276 | Silica particles | 1.9 × 10⁻¹⁷ | Perraudin et al.298 | Graphite particles | |||
| 1.0 × 10⁻¹⁹ | Nguyen et al.275 | Kerosene flame soot | 3.8 × 10⁻¹⁷ | Perraudin et al.298 | Silica particles | |||||||
| 7.5 × 10⁻¹⁸ | Estève et al.256 | Diesel exhaust particles SRM 1650a | ||||||||||
| BgP | 5.9 × 10⁻¹² | Estève et al.255 | Graphite particles | 4.7 × 10⁻¹⁷ | Perraudin et al.276 | Silica particles | ||||||
| 1.0 × 10⁻¹⁹ | Nguyen et al.275 | Kerosene flame soot | ||||||||||
| 3.8 × 10⁻¹⁷ | Estève et al.255 | Graphite particles | ||||||||||
| 7.9 × 10⁻²¹ | Butler and Crossley270 | Ethylene flame soot | ||||||||||
| BgF | 8.4 × 10⁻¹⁵ | Bedjanian et al.252 | Kerosene flame soot | 1.0 × 10⁻¹⁹ | Nguyen et al.275 | Kerosene flame soot | ||||||
| AcP | 1.0 × 10⁻¹⁴ | Bedjanian et al.252 | Kerosene flame soot | 1.0 × 10⁻¹⁹ | Nguyen et al.275 | Kerosene flame soot | ||||||
| DBahA | 1.6 × 10⁻¹⁴ | Bedjanian et al.252 | Kerosene flame soot | 1.0 × 10⁻¹⁹ | Nguyen et al.275 | Kerosene flame soot | ||||||
| DBaeP | 1.0 × 10⁻¹⁴ | Bedjanian et al.252 | Kerosene flame soot | 1.0 × 10⁻¹⁹ | Nguyen et al.275 | Kerosene flame soot | ||||||
| BbF | 1.2 × 10⁻¹⁴ | Bedjanian et al.252 | Kerosene flame soot | 1.0 × 10⁻¹⁹ | Nguyen et al.275 | Kerosene flame soot | ||||||
| Cor | 1.1 × 10⁻¹⁴ | Bedjanian et al.252 | Kerosene flame soot | 1.3 × 10⁻¹⁸ | Perraudin et al.276 | Silica particles | ||||||
| 1.0 × 10⁻¹⁹ | Nguyen et al.275 | Kerosene flame soot | ||||||||||
| 2.3 × 10⁻²¹ | Butler and Crossley270 | Ethylene flame soot | ||||||||||
| DBalP | 1.8 × 10⁻¹⁶ | Perraudin et al.276 | Silica particles | 1.3 × 10⁻¹⁶ | Perraudin et al.298 | Graphite particles | ||||||
| 1.3 × 10⁻¹⁶ | Perraudin et al.298 | Silica particles | ||||||||||
| 1-NP | 1.0 × 10⁻¹³ | Miet et al.257 | Silica particles | 6.2 × 10⁻¹⁸ | Miet et al.277 | Silica particles | 2.2 × 10⁻¹⁷ | Miet et al.297 | Silica particles | 1.3 × 10⁻¹² | Liu et al.260 | Azelaic acid particles |
Bertram et al.253 studied the heterogeneous loss rate of OH radicals on various organic surfaces, coated on Pyrex tubes, using a flow-tube reactor coupled to a chemical ionization mass spectrometer. The average reaction probabilities (γOHave) for these organic surfaces were generally large, (>0.1) for relatively low OH concentrations (1 × 10⁸ molecules cm−3) and short exposure time (<5 minutes). For example for soot and solid pyrene surfaces, the γOHave values were 0.88 and 0.32, respectively. It was noted that the γOHave value was lower for an alumina surface than for organic surfaces. These results indicate that uptake of OH radicals to particle surfaces may be rapid and thus have the potential to contribute significantly to oxidative reactions of PAHs on organic surfaces in the atmosphere.
Estève et al.254 used a discharge flow technique to study the heterogeneous reaction of OH with Phe adsorbed on a Pyrex surface, in the presence of NO2 and in the absence of light. They investigated the reaction kinetics by measuring the total loss of OH, followed by laser-induced fluorescence (LIF). The efficiency of the heterogeneous reaction and the change in the surface properties with exposure time were demonstrated. In addition, oxidation products of the heterogeneous reaction of OH with Phe in the presence of NO2, identified by GC-MS, were noted as mono-hydroxylated isomers of phenanthrene.
In their subsequent investigations, Estève et al.255,256 studied the heterogeneous reactions of both OH radicals and NO2 with PAHs associated with carbonaceous (graphite) particles and diesel particulate exhaust. This was achieved using an adapted fast flow reactor and by monitoring the decrease in particle-bound PAH concentration by GC-MS. This therefore allowed the calculation of pseudo-first order rate coefficients of these reactions from the experimental decays of PAH concentrations in relation to OH exposure time.
Rate coefficients derived for PAH reactions with OH on diesel exhaust particles were approximately an order of magnitude lower for most compounds than for reactions of PAHs adsorbed on graphite.256 The matrix effects are detailed below (Section 3.2.2.6). These k(2) values fall approximately within the same order of magnitude for all PAHs investigated in the two studies.
Bedjanian et al.252 investigated the reactions of 15 PAHs adsorbed on laboratory generated kerosene soot surfaces using a low-pressure discharge-flow reactor combined with an electron-impact mass spectrometer. An uptake coefficient of ≈0.2 was reported under the reaction conditions used. Pseudo-k(1) coefficients calculated in this study generally fell between those derived by Estève et al.255 and Estève et al.,256 suggesting that the substrate type influences PAH reactivity. However, the OH concentration reported in the study by Bedjanian et al.252 was 1–2 orders of magnitude higher than that used in the studies by Estève and co workers255,256 leading to much lower k(2) values being derived in this study.
In the above three investigations there is relatively little variation in reactivity between each individual PAH associated with the varying types of organic particulate matter. This was also observed in a laboratory investigation of PAH decay profiles caused by heterogeneous reactions with OH radicals occurring on natural atmospheric particles.258 In each of the three studies detailed in Table 6 the k(2) values for all PAHs studied fall approximately within one order of magnitude. The above studies have demonstrated that rapid reaction with OH can potentially be an important potential pathway for degradation of PAHs associated with carbonaceous particles in the atmosphere.
To our knowledge, the only study to investigate the reaction of PAHs on silica particles was carried out by Miet et al.257 The k(2) value derived for this reaction is lower than that of the corresponding reaction on diesel particles. More work is clearly needed to assess these reactions for a wider range of compounds on mineral substrates to compare with other surface reactions.
3.2.2.2.2. Reaction mechanism and products. Ringuet et al.258 investigated the reaction products formed from PAHs reactions with OH (+NO2) occurring on natural atmospheric particles. Formation of NPAH derivative compounds was observed. For example, 1N-Pyr was observed, attributed to the heterogeneous reaction of Pyr as reported in NO3 radical reaction studies.259,260 This apparent discrepancy in radical-induced reaction products between the gas and particle phases has also been reported by Miet et al.257 for OH reactions on silica. Furthermore, 2N-Pyr and 4N-Pyr were also reported as reaction products in this study, which were not reported elsewhere and had previously been thought to be solely gas phase reaction products.
The precise mechanism of surface-bound PAHs with OH radicals has not been elucidated and the lack of product evaluation makes it difficult to assess the possible reaction chemistry occurring. The non-linear dependence of the reaction rate on OH concentration252 would indicate that this process is not a simple bi-molecular reaction. While the surface reaction of PAH towards OH is shown to be relatively fast, the presence of the ‘plateau’ in PAH degradation with exposure time would suggest that gas phase transport of OH to the soot surface is not the rate limiting step in these processes. Clearly more work is required to address these issues and investigate the mechanisms of these reactions in more detail.
3.2.2.3. Heterogeneous PAH reactions with NO3 radicals.
3.2.2.3.1. Overview. Heterogeneous reactions of PAHs with NO3 radicals have received comparatively little attention in the literature compared with the corresponding reaction in the gas phase, and the reaction of surface-bound PAHs with OH, NO2 and O3. Initial investigations focused on the reactivity of pyrene and perylene212,261 adsorbed on glass fibre filters towards N2O, NO3 radicals, NO2 and N2O5. It was concluded that NO3 did not react to a detectable extent with these compounds and that N2O5 was the main oxidising species. Kamens et al.262 reported that the heterogeneous reaction rate coefficient for the reaction of PAHs with N2O5 (≈2.5 × 10¹⁴ molecules cm−3) on wood and diesel soot is of the order of 10−18 cm−3 molecules−1 s−1.
Recently, however, studies have been conducted that contradict these original assumptions and suggest that NO3 does play an important role in heterogeneous PAH reactivity. Mak et al.263 studied the reaction of NO3 with methane and hexane soot and solid pyrene surfaces using a flow tube reactor and reported that the uptake of NO3 on fresh soot and pyrene surfaces was fast (uptake coefficient >0.1). The authors suggested that NO3 has the potential to rapidly oxidize soot surfaces and their reaction with PAHs potentially provides an important loss process for these compounds under certain atmospheric conditions.
Similarly, Karagulian and Rossi264 investigated the reaction of soot and NO3 and also reported rapid uptake (uptake coefficient of 5 × 10⁻²). Furthermore, Gross and Bertram265 studied the reactive uptake of NO3 as well as other oxidants (including NO2 and O3) with three solid PAH surfaces. Their results suggested that NO3 has the potential to be a more important sink for PAHs than reactions with NO2 and O3. In an investigation by Kwamena and Abbatt,266 exposing anthracene and pyrene to a mixed flow of NO3, NO2 and N2O5, it was concluded that the nitro-PAH products formed were as the result of a reaction initiated by NO3 or N2O5 and not through direct reaction with NO2 or HNO3.
3.2.2.3.2. Reaction mechanism and products. The first reported quantitative heterogeneous reactivity data for PAH reaction with NO3 were provided by Liu et al.260 Rate coefficients were measured for the reactions of BaA, Chr and Pyr, as well as 1-nitropyrene, adsorbed on azelaic acid particles. The k(2) values measured for these reactions are shown in Table 7. These k(2) values for the NO3 reactions are of the same order of magnitude or 1–3 orders of magnitude higher than for reactions with OH radicals and 5–7 orders of magnitude higher than the heterogeneous reactions with NO2 and O3, depending on the particle surface (discussed in the following sections). This suggests that heterogeneous reactions of PAHs with NO3 may be very significant. However, more research in this area is required to assess the precise rates and mechanisms for a wider range of surface-bound PAHs.
Product studies for the heterogeneous reaction of PAHs with NO3 radicals have been conducted for a number of PAHs on azelaic acid particles using Vacuum Ultraviolet Photoionization Aerosol Time of Flight Mass Spectrometry (VUV-ATOFMS).259,260 Products identified included 9N-Ant, AQu, 1N-Pyr, 2-, 4- and 9N-Phe isomers, BaA-7,12-dione and 7N-BaA for the reactions of Ant, Pyr, Phe and BaA. The reaction of 1N-Pyr was also shown to produce 1,3-, 1,6-, and 1,8-DN-Pyr isomers.260 While some of the products identified, e.g. AQu, are thought to be analogous to those formed from the gas phase reaction, the formation of 1N-Pyr is in contrast to gas phase reactions, in which 2N-Pyr is the major product.
3.2.2.4. Heterogeneous PAH reactions with NO2.
3.2.2.4.1. Overview. The occurrence of heterogeneous reactions of PAHs with NO2 was initially demonstrated through experimental studies exposing PAHs on various substrates to NO2 in the presence of nitric acid, at ambient or elevated levels, resulting in the formation of nitro-PAH products. This has been observed on a number of different surfaces including filters,267,268 wood smoke particles,269 soot particles,270 propane flame-generated soot,271 coal fly ash,272 silica plates,273 metal oxides TiO2, ZnO, Al2O3, Fe2O3, MgO, CaO, SiO2 and graphite.274 Details of these studies are summarized by Finlayson-Pitts and Pitts.1
More recently, full kinetic investigations of this process have been carried out with rate coefficient values for the reaction of NO2 adsorbed on various particle surfaces calculated.255,256,275,276 The k(2) values derived from these studies are presented in Table 7. In general, heterogeneous reactions of PAHs with NO2 on carbonaceous particles are considerably slower than the corresponding reactions with OH radicals and O3. Indeed, the reactions of PAHs with OH are 1–6 orders of magnitude faster than the reactions with NO2, depending on the surface type and specific experimental conditions.
Estève and co-workers investigated the heterogeneous reactions of NO2 with PAHs associated with graphite255 and diesel exhaust particles.256 It was shown that Pyr and BaP are the most reactive towards NO2 on diesel exhaust and Ant, Per and BaP are the most reactive on graphite. Nguyen et al.275 investigated the reactions of 17 PAHs associated with fresh kerosene flame soot over a temperature range (255–330 K) and the decay of PAHs due to the reaction of NO2 was considered to be negligible, suggesting that PAH degradation by NO2 alone is of minor importance in the atmosphere.
Perraudin et al.,276 Miet et al.277 and Ma et al.278 studied the reaction of NO2 with PAHs adsorbed on silica particles. Ma et al.278 also investigated the reaction of gas phase NO2 with anthracene MgO particles. k(2) values for this reaction were much more variable between individual PAH species than was observed for reactions with OH and O3 or with NO2 on carbonaceous substrates and are lower for most compounds by 1–5 orders of magnitude. The matrix effects are detailed below (Section 3.2.2.6).
3.2.2.4.2. Reaction mechanism and products. The formation of nitro-PAH isomers from heterogeneous reactions of PAHs with NO21 would indicate a direct molecular reaction between surface PAH and gaseous NO2. Consistent with this, 1-nitropyrene has been identified as the only the product from the reaction of pyrene with NO2 on silica,277,279,280 alumina279 and soot84 particles. This is in contrast to gas-phase reactions with OH/NO3 radicals followed by NO2 where 2-nitropyrene is observed as the main reaction product.188
Miet et al.277 suggested the mechanism for the nitration of pyrene due to the heterogeneous reaction with NO2 on silica particles as being a simple elementary reaction between the two species, indicated by the linear relationship between pyrene reactivity and NO2 concentration. The formation of 1-NPyr is attributed to electrophilic addition of NO2 at C1.277 However, Inazu et al.274 observed that the main products from the reaction of fluoranthene with NO2 on various particle types were 1-, 2- and 7N-Flt isomers, indicating that an electrophilic nitration (which would primarily yield 3- or 8-isomers) does not occur.
The heterogeneous reaction of PAHs with NO2 appears to be significantly enhanced by the presence of gaseous nitric acid.267,268,272,281–283 For example, it was shown that the 24 h nitration yield for pyrene adsorbed on filters exposed to 10 ppmV NO2 rose from 0.02% to 2.85% when traces of HNO3 were present.268 Grosjean et al.281 studied the transformation of perylene and BaP deposited on glass and Teflon filters loaded with fly ash and diesel exhaust particles, exposed to 100 ppbV of NO2. They reported no evidence for chemical transformations in these experiments. This could be attributed to the absence of HNO3.1
In the study by Ma et al.278 both 9N-Ant and 9,10-AQu were observed as the products from the nitration of anthracene with NO2 on SiO2 particles, whereas only 9,10-AQu was observed from the equivalent reaction on MgO particles. The difference between these two processes was attributed by the authors to the formation of HNO3 on SiO2 that does not occur on MgO particles.
For the reactions of NO2 with PAHs on silica particles, it is proposed that HNO3 is formed on the silica surface, which acts as a catalyst for the process.280 Wang and co-workers proposed that the HNO3 dissociates producing H+ leading to the protonation of NO2 and N2O4 to form HNO2+ and HN2O4+. This initiates an electrophilic nitration process with reaction occurring at the C1 position (the carbon with highest electron density), producing intermediate species that further react with NO2 and/or decompose to form 1N-Pyr (Scheme 9).
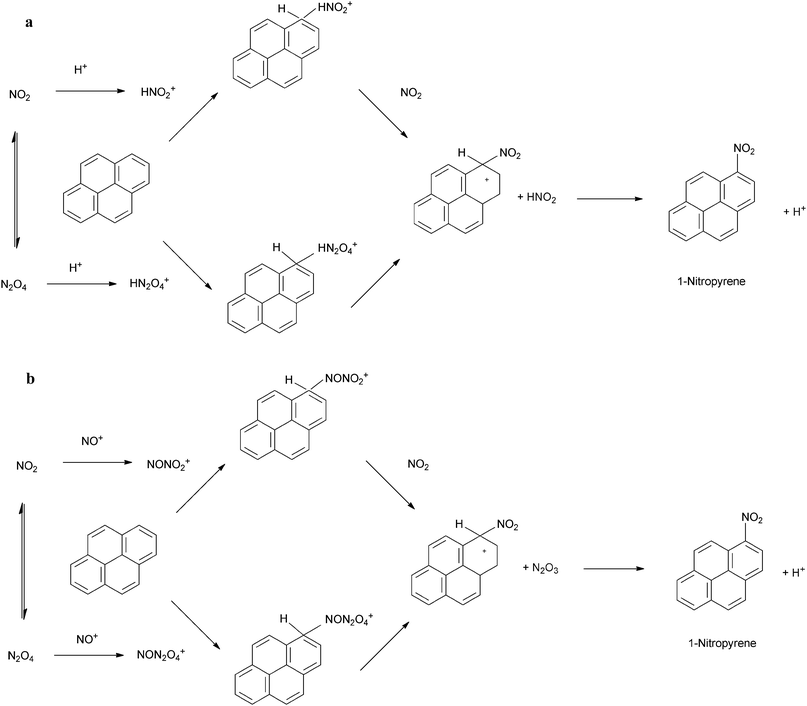 | ||
| Scheme 9 Suggested mechanisms for the heterogeneous reaction of pyrene with NO2.280,284 | ||
It was suggested that HNO2 gas, which is also formed from NO2 on the silica surface, also acts catalytically in the heterogeneous reaction of pyrene.284 Furthermore, considering the combined catalytic effect of HNO3 and HNO2, a different electrophilic nitration mechanism was proposed (Scheme 10b) in which NO+ is formed on the silica surface from the dissociation of HNO2.285 These species then reacts with NO2 or N2O4 to form NONO2+ and NON2O4+, respectively, which react with surface bound Pyr, analogous to the reaction in Scheme 10a.
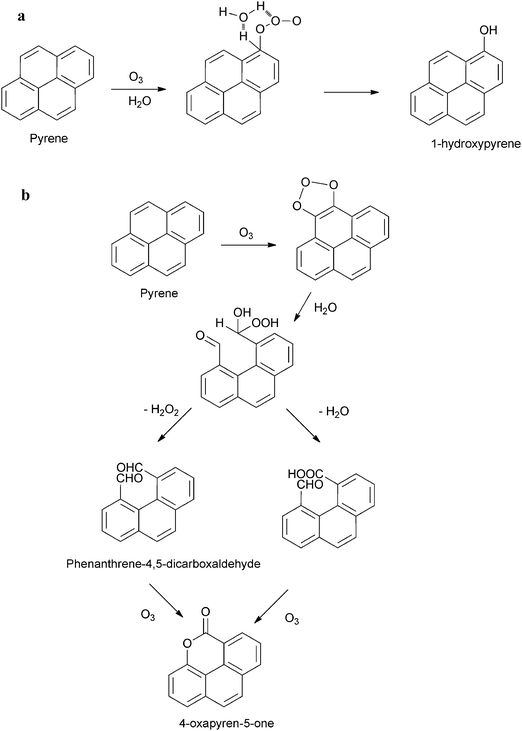 | ||
| Scheme 10 Suggested mechanism for the heterogeneous reaction of pyrene with gaseous ozone, forming 1-hydroxypyrene (a), phenanthrene-4,5,dicarboxaldehyde and 4-oxapyren-5-one (b).297 | ||
3.2.2.5. Heterogeneous PAH reactions with O3.
3.2.2.5.1. Overview. The occurrence of heterogeneous ozonolysis reactions of PAHs was first demonstrated in studies exposing PAHs on solid surfaces to O3 and observing decay in the PAH profile and/or conversion to oxidised derivative compounds.83,231,242,267,282,286–288 These studies indicated that under certain atmospheric conditions, PAHs adsorbed onto surfaces may undergo rapid heterogeneous reaction with gas phase O3. Detailed review of these studies is provided by Finlayson-Pitts and Pitts.1
More recently, studies have focussed on full kinetic investigations of the ozonation of PAHs associated with different types of surfaces such as soot particles,289,290 organic aerosols and sea salts,291,292 air–water interface,293–295 organic films,296 mineral surfaces297,298 and graphite.298
Perraudin et al.298 studied the reaction of 13 PAHs with O3 adsorbed on graphite and silica particles. Pseudo-k(1) values were calculated and shown to be proportional to gaseous O3 concentration. Therefore k(2) values were derived considering the concentration of O3 (Table 7). The reactivity of PAHs followed the order Chr < BeP < Cor, BgP, Phe, Flt, BkF, Ipy < Pyr < BaA < BaP < Ant < DBalP and Flth < Cor < Phe < BeP < Chr < BkF < Ipy < Pyr < BgP < BaA < DBP < Ant, BaP for graphite particles and silica particles, respectively.
Wu et al.299 had previously measured k(2) values for the reaction of O3 with BaP adsorbed on silica particles of 1.78 × 10⁻¹⁷ cm3 molecules−1 s−1 at room temperature, about 7 times higher than that measured by Perraudin et al.298 This may be explained by the fact that the earlier study was not performed in the dark. This is consistent with a previous study by Katz et al.286 where the reactivity of PAHs adsorbed on cellulose was shown to be more rapid under light irradiation conditions.
Miet et al.297 investigated the reaction of O3 with pyrene adsorbed on silica particles. The k(2) value derived from this study was approximately 5 times higher than that derived by Perraudin et al.298 despite the reaction conditions (temperature, pressure, particulate concentration) being essentially identical in the two studies. Previously, Kamens et al.300 investigated the reactions on wood smoke at low PAH loading with 0.52 ppmV O3 and reported k(2) values (k, cm3 molec−1 s−1) of 4.1 × 10⁻¹⁸ (BPy), 7.2 × 10⁻¹⁸ (Chr), 1.0 × 10⁻¹⁸ (BaP), 1.3 × 10⁻¹⁸ (BaA), all roughly one order of magnitude lower than reported by Perraudin et al.298 These observations clearly highlight the influence of the specific conditions and nature of the PAH and/or particle surface on the reaction kinetics of these processes.
3.2.2.5.2. Reaction mechanism and products. The precise reaction mechanism(s) and influencing factors governing the heterogeneous reaction of surface-bound PAHs with O3 have been investigated. A direct (Eley–Rideal) mechanism is possible, whereby a gas phase molecule collides directly with an adsorbed PAH molecule and facilitates a reaction. This would lead to a linear dependence between observed first order rate coefficient and the gaseous ozone concentration.
However, experimental studies suggest that the oxidation of surface-bound PAHs by gas phase ozone will follow Langmuir–Hinshelwood type kinetics.266,290–294,301 These authors investigated the kinetics and products of these reactions as a function of ozone concentration and relative humidity (Table 8).
| PAH | Langmuir adsorption equilibrium constant, KO3 (cm3 × 10−15) | Pseudo-first order rate coefficient, k (s−1 × 10³) | Surface | Ref. |
|---|---|---|---|---|
| a k value used is an average from the studies of Pöschl et al.290 and Kwamena et al.291 b Calculated assuming k1 = 3 × 10⁻³ s−1, which is the typical error of k1 obtained for azlaic acid aersol kinetics under dry conditions. This was taken to be the fastest reaction occurring at the highest O3 concentrations used (31 ppm).291 c 2.5 × 10⁻³ M. d 3.79 × 10⁻³ M. e 8 × 10⁻³ M. | ||||
| BaP | 280 ± 20 | 15 ± 1 | Soot aerosols | Pöschl et al.290 |
| 28 | 32a | Fused silica | Wu et al.299 | |
| 9.5 | 32a | Non activated silica | Alebic-Juretic et al.302 | |
| 2.80 ± 1.4 | 60 ± 18 | Azelaic acid aerosol (72% RH) | Kwamena et al.291 | |
| 1.20 ± 0.4 | 48 ± 8 | Azelaic acid aerosol (<1% RH) | ||
| <0.12b | 32a | NaCl | ||
| Ant | 100 ± 40 | 10 ± 3 | Phenylsiloxane oil aerosols | Kwamena et al.301 |
| 6.4 ± 1.8 | 2.8 ± 0.9 | Pyrex glass | Kwamena et al.292 | |
| 2.2 ± 0.9 | 57 ± 9 | Azelaic acid aerosols | Kwamena et al.301 | |
| 2.143 ± 0.441 | 2.55 ± 0.17 | Water | Mmereki et al.294 | |
| 1.922 ± 0.478 | 2.26 ± 0.20 | Stearic acid film on water | ||
| 0.681 ± 0.291 | 1.11 ± 0.12 | Octanoic acidd | ||
| 0.56 | 2 | Octanol thin film | Kahan et al.296 | |
| 0.508 ± 0.088 | 2.59 ± 0.14 | 1-Octanolc | Mmereki and Donaldson293 | |
| 0.118 ± 0.036 | 0.48 ± 0.07 | Hexanoic acide | Mmereki et al.294 | |
The Langmuir–Hinshelwood mechanism involves one species (in this case the PAH molecule) being strongly adsorbed to the particle surface and the gas species (O3) being in equilibrium between the gas phase and the particle surface.291 The reaction therefore proceeds in two steps: (i) adsorption of the gas molecule, (ii) surface reaction of PAH and the gas molecule. The reaction rate is therefore dependent on the concentration of both PAH and O3 and will exhibit a non-linear dependence on gas species concentration.
Earlier studies had indicated a linear relationship between ozone concentration and pseudo-first order reaction rate for ozone mixing ratios of 0.5–0.40 ppmV302 and 0–1.5 ppmV299 on silica. It has been suggested that for these studies, the Langmuir–Hinshelwood mechanism may have been reported if the experiments had been conducted over larger ozone concentration ranges.291 A linear dependence of pseudo-first order reactivity on ozone concentration over the concentration range 0.4 × 10¹⁴–3.3 × 1014 cm3 molecules−1 was observed by Perraudin et al.298 for a range of PAHs, which may also indicate a simple direct mechanism. However, the suitability of a Langmuir–Hinshelwood-type mechanism was not tested in this study, so no definitive conclusion can be drawn.
The observation of Langmuir–Hinshelwood kinetics emphasises the potential importance of the degree of ozone partitioning to the particle surface, as this will have a direct influence on the reaction rate. Therefore, in addition to the pseudo-first order rate coefficient (pseudo-k(1)), which describes the surface reaction rate, the Langmuir–Hinshelwood mechanism is also characterized by the ozone partitioning coefficient (KO3), which describes the degree of partitioning of ozone between the gas phase and the surface (Table 8).
There is notably more variation in KO3 values between these different reaction systems than for the pseudo-k(1) values. This may suggest that differences in heterogeneous reactivity of PAHs with O3 observed on different substrates is due, to a large extent, to differences in the partitioning rate of O3 to the surface rather than differences in the surface reaction mechanism(s). However, no direct correlation between KO3 and pseudo-k(1) is found in these data and the lack of k(2) values derived from these studies mean that no solid conclusions can be drawn regarding these reactions.
Differences in KO3 values have been attributed to differences in binding interactions of the initial ozone-substrate complex.292 Therefore, KO3 will be influenced to a large degree by the specific type of particle and/or the coating of additional species (e.g. water, organic molecules etc.) that will affect the affinity of ozone to the surface and therefore influence PAH reactivity.291 It has been suggested, based on adsorption enthalpy values, that ozone will interact more strongly with non-polar surfaces than with polar surfaces.290 This would explain the higher rate of O3 partitioning to non-polar soot and phenylsiloxane oil aerosols, for example, compared with polar NaCl and azelaic acid aerosols.
A number of studies have identified both ring-opened (e.g. dialdehydes, dicarboxylic acids, keto carboxylic acids), and ring-retaining (e.g. quinones) products from the heterogeneous reactions of a number of PAHs with O3 on particle surfaces.1 This suggests the significance of both bond-attack (ring-opening) and atom-attack (substitution) mechanisms at the most electrophilic positions.297
Van Cauwenberghe251 proposed 2 mechanisms for the heterogeneous reaction of PAHs with O3. (1) A one-step electrophilic–nucleophilic attack on olefin bonds with the highest electron density to initially form a primary ozonide. This will decompose to yield ring-opened products such as aldehydes and carboxylic acid compounds. (2) A two-step electrophilic attack that will ultimately lead to the formation of quinones.1
Miet et al.297 tentatively identified several oxidation products formed from the heterogeneous reaction of pyrene with O3 on silica including 1-hydroxypyrene, phenanthrene-4,5-dicarboxaldehyde and 4-oxapyren-5-one. The proposed mechanisms, suggested by the authors to explain the formation of these products are depicted in Scheme 10. It was suggested that hydroxypyrene would be formed from the reaction of O3 with the most reactive carbon atom while phenanthrene-4,5-dicarboxaldehyde would be formed by ozonolysis of a C–C bond.297 It was also suggested that 4-oxapyren-5-one would be formed by further reaction of phenanthrene-4,5-dicarboxaldehyde.
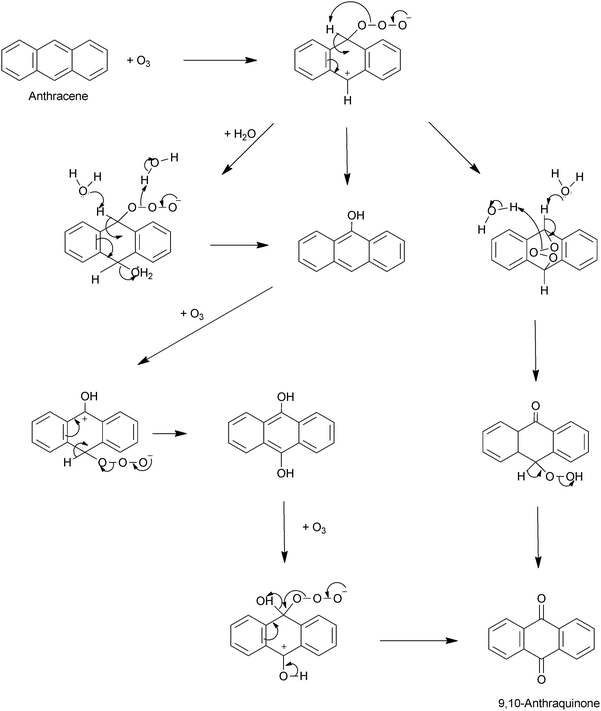 | ||
| Scheme 11 Suggested mechanisms for the heterogeneous reaction of anthracene with O3.292 | ||
Ringuet et al.258 investigated PAH decay and PAH derivative formation resulting from heterogeneous reactions of PAHs adsorbed on natural atmospheric particles collected from a high traffic area, exposed to OH and O3. BaP was noted as the most reactive PAH studied, in agreement with the findings of Perraudin et al.298 for reactions on silica and graphite particles. PAH decay and the formation of PAH ketones and quinones e.g. 9-Flr and AQu were observed. However, it was noted that the rate of OPAH formation did not match with the rate of parent PAH degradation in these cases, suggesting that other compounds/species are involved in these reactions.
The formation of NPAH compounds was also noted in these reaction studies, which is surprising as NO2 was absent in this experiment. Organic nitrogen present was suggested as the precursor, which may react with O3 to form a reactive species (e.g. NOx, NO2−, NO3−) which then reacts with the PAH upon O3 attack.
PAH degradation and NPAH formation was also observed for reaction of PAH with a mixture of NO2 and O3. However, it was noted that the formation of these products accounted for only 0.2% and 0.4% of the parent PAH decay for Fln and BaP, respectively. The observation of significant amounts of 2N-Fln and 2N-Pyr from these reactions indicates that these compounds are formed in homogeneous as well as heterogeneous reactions.
The reaction of ozone with anthracene adsorbed onto aqueous surfaces or Pyrex leads to the formation of 9,10-AQu only,292,294 while both anthraquinone and anthrone are formed on silica particles.303
A possible mechanism for the reaction has been proposed, consistent with that described by Bailey.304 This was suggested to involve two potential pathways (Scheme 11): the first of these involves three consecutive electrophilic attacks by ozone at the C9 and C10 positions of anthracene with the first two ozone attacks being followed by the loss of oxygen and a proton transfer and the third attack followed by loss of oxygen and water.294 The second of these pathways involves the formation of an ozonide due to O3 addition across the C9–C10 bond of Ant, which re-arranges to hydroperoxide, which finally dehydrates to form anthraquinone.303 There is some disagreement between these studies as to which of these reaction pathways dominates. More work is clearly required to establish the mechanism responsible for the formation of quinones from heterogeneous reactions of PAHs with ozone.
The products of the heterogeneous reactions of BaP with ozone were investigated by Letzel et al.305 They identified BaP-1,6-dione, BaP-3,6-dione and BaP-6,12-dione as the main reaction products, as previously observed by Pitts et al.,267 as well as BaP-4,5-dione and 4-oxa-benzo[d,e,f]chrysene-5-one (B(def)C-lactone). The formation of these products would seem to be broadly consistent with the mechanism for the reaction of anthracene (Scheme 11).
The reaction yield of the production of anthraquinone from the reaction of anthracene with O3 on a pyrex surface was calculated by Kwamena et al.292 to be approximately 30% at O3 concentrations of up to 9.1 × 10¹⁵ molecules cm−3. However at atmospherically relevant ozone mixing ratios (100 ppbV) the AQu formation yield was expected to be very small (<1%), suggesting that this reaction route may be of minor importance in the ambient atmosphere.
3.2.2.6. Factors influencing heterogeneous PAH reactivity.
3.2.2.6.1. Substrate type and conditions. It is clear from the discussion above that the chemical composition and specific conditions of the substrate to which PAHs are associated will have a critical role in the heterogeneous reactivity of these compounds towards oxidising species. This ‘substrate effect’ has the potential to influence the degree of partitioning of the oxidant to the particle surface (as demonstrated for ozone reactions), the relative accessibility of the PAH within the particle matrix, as well as the precise reaction mechanism.
3.2.2.6.1.1. Reaction with NO2. Ramdahl et al.279 showed that PAH reactivity on different surfaces follows the order silica > alumina > charcoal, for six PAHs exposed to 0.5 ppmV of NO2 in air containing water vapour and traces of HNO3. It was estimated that PAH reactivity on alumina was 14–24% of that on silica. Similarly, Jäger and Hanus306 observed the order of reactivity for the reaction of several PAHs with 1.3 ppmV of NO2 to be silica gel > fly ash > aluminium oxide > carbon.
The enhanced reactivity of NO2 with PAH adsorbed on silica relative to that associated with alumina was attributed to the catalytic effect of HNO3, as discussed above.280,284,285,307 The formation of nitric acid on the acidic silica surface is likely to be greater than that on neutral alumina surfaces which may explain the higher reactivity.279 Similarly, Ma et al.278 noted that the reaction rate on SiO2 was almost two times faster than on MgO. The authors attributed this to the formation of HNO3, which occurs on the surface of SiO2 but not on MgO.
Inazu et al.274 investigated the reaction of Flt with NO2 on different particle types and the factors influencing the degradation of Flt and the yield of N-Flt*s. The amount of Flt degradation ranged from 20.9% for graphite to 79.5% for TiO2 and followed the order TiO2 > ZnO > Al2O3 > MgO > CaO > SiO2 > Fe2O3 > graphite. The authors suggested three possible types of matrix effect to explain the different degradation rates and N-Flt yields on different substrate types.
One possible impact is suggested to be the photocatalytic generation of active species such as O2− and O− on the particle surface.274 This would apply only to TiO2 and ZnO and Fe2O3, which have a band gap energy of less than 4.3 eV, explaining the higher degradation rates of Flt on TiO2 and ZnO. The reason for Fe2O3 degradation being lower than expected is not currently known. While this phenomenon may explain the higher degradation of Flt on these compounds, the overall yield and selectivity of N-Flt products are lower than for other matrices such as MnO. This was attributed to the photoactivation of the support leading to the formation of oxidising agents as opposed to nitrating agents.
Another effect proposed to influence the Flt reactivity was potential fluoranthene–surface interaction due to the acidity/basicity of the matrix.274 The order of matrix acidity was Al2O3 > SiO2 > TiO2 > Fe2O3 > ZnO > MgO > CaO. This would explain the relatively high degradation rate of Al2O3 resulting from cation radical formation. The selectivity of nitration on different supports was observed to be almost opposite to the acidity order. It is therefore suggested that basicity of the support facilitates N-Flt formation and hence explains the higher reaction yield and selectivity on MgO.
The photochemical activation of fluoranthene sorbed to a surface was not considered to be an important factor in these studies.274 It was noted that irradiation and the presence of O2 are important factors in heterogeneous reactions of PAHs but the specific surface area and particle size have a relatively small influence compared to the surface chemical properties.
3.2.2.6.1.2. Reactions with O3 and OH. The reactivity of PAHs associated with graphite, diesel exhaust and urban particles towards ozone, OH and NO2 have been shown to reach a ‘plateau’, indicating that no further reaction occurs after a certain exposure time.255,256,258 These heterogeneous processes proceed via a rapid surface reaction but a significant fraction of PAH is unavailable for the reaction due to poor diffusion of the oxidant through and/or inaccessibility of the PAH within the bulk particle. This was studied for the reaction of BaP sorbed to ammonium sulfate particles with O3.308 Solid EC coating and various liquid organic coatings (when exceeding 10 nm of thickness) prevented the reaction. These results provide a strong indication for matrix effects to enhance the LRTP of PAHs.
Interesting differences were noted between the reactions of O3 with PAHs for graphite and silica particles: the plateau observed in the case of graphite was relatively similar for the different PAHs studied (40–60%), while the fraction of unreacted PAH was highly variable in the case of silica particles (10–90%) and appeared to be dependent on the reactivity of individual PAH molecules.298
For reactions with both NO2 and OH degradation on diesel particles is slower or stops earlier than on graphite particles.256 For example the amount of PAH degradation was 7–25% on diesel particles, compared to 10–75% on graphite particles (the same NO2 concentration). These differences may be related to differences in particle surface area (108 m2 g−1 for diesel vs. 13.2 m2 g−1 for graphite) and the corresponding presence of pores that could house adsorbed pollutant molecules, leading to differences in the relative accessibility of oxidants.256 This difference may be caused by differences in particle generation: in contrast to physisorption of PAHs to (pure) graphite particles, PAHs present in diesel are generated simultaneously and incorporated in the carbonaceous core of the particles.256
It has been noted that the ozonation reactions of PAHs on solid substrates (e.g. silica and graphite) are considerably faster than the reactions on organic films. For example, the rate coefficients for the reaction of ozone with BaP and Anth were shown to be up to a factor of ten higher in the studies conducted by Kwamena and co-workers292,301 than those calculated by Kahan et al.,296 seemingly contradicting the above suggestion of enhanced affinity of ozone for organic surfaces. However, this observation has been attributed to the potential formation of PAH dimers on the solid surface which may react differently with the gaseous oxidant and thus alter the reaction kinetics.296
Ozone will have a higher affinity for non-polar surfaces, therefore will be more attracted to hydrophobic, organic particles like soot or azelaic acid and will have very low affinity for polar, ionic particles like NaCl.291 For example, Kwamena et al.291 noted that the partitioning efficiency for O3 followed the order elemental carbon > fixed silica > non-activated silica > solid organic carbon > inorganic salts.
Therefore, the heterogeneous reaction of PAH with ozone could be enhanced by the presence of water. For example, Kwamena et al.291 observed a partitioning coefficient for ozone to azelaic acid at high RH that was 230% higher than the value that was observed under dry conditions, leading to a pseudo-first order rate coefficient increase for the reaction of anthracene of 25%.291 It was suggested that the partitioning of gas phase water to the particle provided a substrate to which O3 had a greater affinity and hence led to enhanced O3 partitioning. While the KO3 values for these two RH conditions differ by more than a factor 2, the actual pseudo-first order rate coefficient does not vary to such a degree (Table 8).
In contrast, however, in the presence of water both gas phase ozone loss and BaP decay rates were reduced,290 attributed to the competitive adsorption of O3 and H2O. Additionally, the reaction kinetics of anthracene reacting with ozone on Pyrex tubes was unaffected by RH conditions.292 Pyrex may be too hydrophobic for water adsorption and, hence, water may not have partitioned to the Pyrex surface during the high RH experiments.292
The enhanced reaction rate of anthracene with ozone on the octanol-coated aqueous surface compared to the pure water surface293,294 can be explained by the fact that octanol is less polar than water and, hence, ozone will have a higher affinity for this surface. A similar explanation was given for the higher reaction rate for naphthalene on water droplets in the presence of fulvic acid.295
3.2.2.6.2. Influence of PAH molecular structure. Where heterogeneous reactions of PAHs with NO2 have been reported, the relative heterogeneous reactivity of NO2 with different PAHs has been observed to follow the general order BaP > Pyr > Chr > Flt, Phe.255,256,270,279 It is indicated that for the reactions of PAHs with O3, Anth, BaA, BaP and DBalP are the most reactive compounds and Flt, Chr, BkF and Cor are the least reactive.286,288,298
It has been suggested that the nature of the PAH structure has the potential to influence heterogeneous reactivity of PAHs associated with silica particles, both for reactions with NO2 and O3.276,298 The values of the derived second-order rate coefficients are considerably more variable between molecules for the reactions of PAHs with NO2 (variation of ≈5 orders of magnitude) than the reactions with O3 (variation of ≈1 order of magnitude).
The variability of reaction kinetics for different PAH structures observed for silica particles is in contrast to observations of PAHs adsorbed on carbonaceous particles (graphite, diesel exhaust, wood soot) where oxidation rates do not appear to be strongly dependent on the nature of the PAH for OH, NO2 and O3 reactions.252,255,256,276,298 The derived k(2) values in these studies fall within the same order of magnitude for all PAH molecules assessed in these studies.
Similar rate coefficients of PAHs associated with carbonaceous particles, for example graphite, may be explained by chemical stabilisation of the PAH due to delocalised π-electrons, which is effective regardless of PAH structure.276 The interactions between PAHs and silica are not as strong as those for graphite, which may explain the enhanced differences in heterogeneous reactivity between the individual PAHs.276
Kwamena et al.301 suggested that the values of the adsorption coefficient (KO3) for the reactions of surface-bound PAH and ozone reflect the partitioning behaviour of ozone to the surface irrespective of the PAH adsorbed onto it. This indicates that, once ozone is adsorbed onto the aerosol surface, there is an inherent barrier to the reaction regardless of the specific PAH that would result in similar rate coefficient values, although there is significant variation between calculated pseudo-first order rate coefficients in the reported studies. This barrier could be related to the level of mobility of the two reactants or to the transformation of ozone into more reactive forms on the substrate surface.
The lack of an observable trend between PAH structure and reactivity for heterogeneous reactions with OH is in contrast to the observations made for the corresponding reactions in the gas phase. In general, it is shown that the reactivity of PAHs with OH in the gas phase depends strongly on the structure of the specific molecule.135,140,210 This clearly highlights the importance of the ‘stabilising effect’ of organic particles on the reactivity of PAHs towards OH radicals. Similar comparisons for NO2 and O3 are not possible due to lack of data.
3.2.2.6.3. Influence of PAH surface concentration. It is suggested that particle PAH reactivity with oxidants is influenced by the amount of PAH coated on the particle surface. Perraudin et al.298 and Miet et al.297 reported that the rate coefficient for the reaction of O3 with pyrene adsorbed on silica particles can be up to 2 orders of magnitude higher when the particle surface concentration of pyrene was ≈50 μg g−1 compared to that of a surface concentration of ≈500 μg g−1. The effect of this ‘bulk shielding’ due to multilayer coverage of BaP on soot particles was also shown to reduce the heterogeneous reactivity with ozone.290 This demonstrates that heterogeneous reactivity of PAH with atmospheric oxidants is dependent on both the gaseous concentration of reactant and the particulate loading of PAH.
Perraudin et al.298 commented that the enhanced heterogeneous reactivity of PAHs on silica particles at lower PAH particle loadings could partly be explained by the nature of the surface adsorption sites. They suggested that PAHs may be adsorbed on at least two different types of silica surface site, initially being coated on the more reactive sites, leading to higher reaction rates at lower surface concentrations. Miet et al.297 noted that, while reactivity of PAH adsorbed on silica particles towards O3 is linearly dependent on gaseous O3 concentration for a constant PAH surface coating, the relationship for a constant O3 concentration and different PAH particle loading is rather more complex. The authors attributed this to the possibility of PAH being adsorbed on two types of silica surface sites.
Similarly, Alebic-Juretic et al.302 indicated that the rate coefficient for the reaction of ozone with PAHs adsorbed on silica gel surfaces is 1.3–2.3 times higher for less than a monolayer coverage of PAH than for a more than one monolayer. Persistance of BaP on soot and ammonium sulfate particles exposed to O3 was attributed to this ‘bulk shielding’ effect290,308 (Section 3.2.2.6.1.2). Therefore, instances of negligible reactivity reported for the reaction of PAHs exposed to ambient O3 levels83,281,309 may be explained by the lack of availability of BaP for reaction at the surface.
Butler and Crossley270 and Nguyen et al.275 reported a very low reactivity for PAHs on soot particles towards NO2, in contrast to the studies of Estève et al.255,256 for graphite and SRM 1650a diesel exhaust particles. It was noted by Nguyen et al.275 that the typical PAH concentrations on SRM 1650a diesel exhaust are of the order of a few tens of μg g−1 while those used by Butler and Crossley270 and Nguyen et al.275 are nearly two orders of magnitude higher.
A further explanation for the lower reactivity at higher PAH loading could be the presence of higher molecular weight oxidation products formed due to heterogeneous reactions.273,290 These may have a lower volatility than the parent PAH and thus prevent the attacking gaseous oxidant from reaching the PAH that is ‘hidden’ underneath the exposed surface when there is a greater than monolayer coverage.
3.2.2.7. Gas phase reaction vs. heterogeneous reaction. For semivolatile PAHs (mostly 3–4 ring compounds) comparisons for reactions with atmospheric oxidant gases can be carried out between reactions occurring in the gas phase and reactions occurring on various substrate types. This is possible only for the reactions of OH, NO3 and O3, as direct reactions of PAHs with gaseous NO2 are not expected to occur in the gas phase (see Section 3.2.1).
It is suggested that reactivity of PAHs in the gas phase would be significantly greater than when associated with carbonaceous particles,255,256 suggesting that the particle surface may have an inhibiting effect on the heterogeneous reaction with OH. It can be seen that k(2) values for PAH reactions with OH on carbonaceous particle surfaces are 1–3 orders of magnitude lower than those derived for gas phase reactions.
The presence of a ‘plateau’ in the experimental decays of PAHs in the reactions of OH indicates that a significant fraction of PAH is unavailable for reaction.255,256 The higher level of this plateau observed in the case of diesel particles relative to that for graphite particles confirms the enhanced inhibiting factor of diesel particles compared to graphite. This ‘stabilising’ effect of particles towards PAH reactivity is also reflected in the relatively similar rate coefficients observed for different PAHs associated with organic particles compared with the apparent PAH-dependent reactivity in the gas phase.
However, it is indicated that the reaction of PAHs with ozone is enhanced on particles in comparison with reactions in the gas phase. For example, Perraudin et al.298 studied the reaction of PAHs with ozone adsorbed on graphite and silica particles and reported k(2) values approximately 2 orders of magnitude higher than those calculated for corresponding gas phase reactions (see Tables 2 and 6). Similar comparisons with studies investigating the reaction of ozone with individual PAHs on soot particles,290 Pyrex,292 organic aerosols301 and the air–aqueous interface293,294 are more difficult to make as second-order rate coefficients were not reported in these studies.
3.2.2.8. Comparison of oxidising species: absolute reaction rates. To assess the relative importance of the second order rate coefficients for the reactions of PAHs in the gas phase (Tables 3, 5 and 6) and associated with particle surfaces (Table 7), absolute reaction rates have been derived using the second order reaction rates derived from the literature and concentrations of atmospheric species typically found in the background atmosphere (Tables 9 and 10).
| OH | NO3 | O3 | ||||
|---|---|---|---|---|---|---|
| k (1) (s−1) | Ref. | k (1) (s−1) | Ref. | k (1) (s−1) | Ref. | |
| a [OH] = 2 × 10⁶ molecules cm−3; global 12 h average (Atkinson and Arey151). b [NO3] = 5 × 10⁸ molecules cm−3; global 12 h average (Atkinson and Arey151). c [O3] = 6.9 × 10¹¹ molecules cm−3; 2011 annual average, Harwell, UK. | ||||||
| Nap | 4.8 × 10⁻⁵ | Phousongphouang and Arey171 | 5.5 × 10⁻⁸ | Pitts et al.212 | 1.4 × 10⁻⁷ | Atkinson et al.168 |
| 4.3 × 10⁻⁵ | Atkinson147 | 3.1 × 10⁻⁸ | Atkinson et al.162 | 2.1 × 10⁻⁷ | Atkinson and Aschmann144 | |
| 4.6 × 10⁻⁵ | Brubaker and Hites140 | 2.1 × 10⁻⁸ | Atkinson and Aschmann174 | |||
| 5.3 × 10⁻⁵ | Klamt172 | 2.4 × 10⁻⁸ | Atkinson et al.163 | |||
| 4.7 × 10⁻⁵ | Biermann et al.169 | 2.7 × 10⁻⁸ | Atkinson et al.163 | |||
| 3.7 × 10⁻⁵ | Lorenz and Zellner156 | 2.3 × 10⁻⁸ | Atkinson210 | |||
| 4.3 × 10⁻⁵ | Klöpffer et al.170 | |||||
| 4.8 × 10⁻⁵ | Atkinson et al.168 | |||||
| 5.2 × 10⁻⁵ | Atkinson and Aschmann144 | |||||
| 1M-Nap | 8.2 × 10⁻⁵ | Phousongphouang and Arey171 | 5.4 × 10⁻⁸ | Atkinson and Aschmann173 | 9.0 × 10⁻⁸ | Atkinson and Aschmann173 |
| 1.1 × 10⁻⁴ | Atkinson and Aschmann173 | 4.5 × 10⁻⁸ | Atkinson and Aschmann174 | |||
| 1.2 × 10⁻⁴ | Klamt172 | 5.0 × 10⁻⁸ | Atkinson210 | |||
| 4.6 × 10⁻⁸ | Phousongphouang and Arey214 | |||||
| 2M-Nap | 9.7 × 10⁻⁵ | Phousongphouang and Arey171 | 6.9 × 10⁻⁸ | Atkinson and Aschmann173 | 2.1 × 10⁻⁷ | Atkinson and Aschmann144 |
| 1.1 × 10⁻⁴ | Atkinson and Aschmann144 | 7.0 × 10⁻⁸ | Atkinson and Aschmann174 | 2.8 × 10⁻⁷ | Atkinson and Aschmann173 | |
| 1.2 × 10⁻⁴ | Klamt172 | 7.0 × 10⁻⁸ | Atkinson210 | |||
| 6.6 × 10⁻⁸ | Phousongphouang and Arey214 | |||||
| 1E-Nap | 7.3 × 10⁻⁵ | Phousongphouang and Arey171 | 6.3 × 10⁻⁸ | Phousongphouang and Arey214 | ||
| 2E-Nap | 8.0 × 10⁻⁵ | Phousongphouang and Arey171 | 5.2 × 10⁻⁸ | Phousongphouang and Arey214 | ||
| 1,2DM-Nap | 1.2 × 10⁻⁴ | Phousongphouang and Arey171 | 4.1 × 10⁻⁷ | Phousongphouang and Arey214 | ||
| 1,3DM-Nap | 4.4 × 10⁻⁵ | Banceu et al.175 | 1.4 × 10⁻⁷ | Phousongphouang and Arey214 | ||
| 1.5 × 10⁻⁴ | Phousongphouang and Arey171 | |||||
| 1,4DM-Nap | 1.2 × 10⁻⁵ | Klamt172 | 8.4 × 10⁻⁸ | Phousongphouang and Arey214 | ||
| 1.2 × 10⁻⁴ | Phousongphouang and Arey171 | |||||
| 1,5DM-Nap | 1.2 × 10⁻⁴ | Phousongphouang and Arey171 | 9.1 × 10⁻⁸ | Phousongphouang and Arey214 | ||
| 1,6DM-Nap | 1.3 × 10⁻⁴ | Phousongphouang and Arey171 | 1.1 × 10⁻⁷ | Phousongphouang and Arey214 | ||
| 1,7DM-Nap | 1.4 × 10⁻⁴ | Phousongphouang and Arey171 | 8.7 × 10⁻⁸ | Phousongphouang and Arey214 | ||
| 1,8DM-Nap | 1.3 × 10⁻⁴ | Phousongphouang and Arey171 | 1.4 × 10⁻⁶ | Phousongphouang and Arey214 | ||
| 2,3DM-Nap | 1.2 × 10⁻⁴ | Phousongphouang and Arey171 | 9.5 × 10⁻⁹ | Atkinson and Aschmann173 | ||
| 2.0 × 10⁻⁴ | Banceu et al.175 | 1.0 × 10⁻⁷ | Atkinson and Aschmann174 | 2.8 × 10⁻⁷ | Atkinson and Aschmann144 | |
| 1.5 × 10⁻⁴ | Atkinson and Aschmann144 | 1.0 × 10⁻⁷ | Atkinson210 | |||
| 9.8 × 10⁻⁸ | Phousongphouang and Arey214 | |||||
| 2,6DM-Nap | 1.3 × 10⁻⁴ | Phousongphouang and Arey171 | 1.4 × 10⁻⁷ | Phousongphouang and Arey214 | ||
| 2,7DM-Nap | 1.4 × 10⁻⁴ | Phousongphouang and Arey171 | 1.4 × 10⁻⁷ | Phousongphouang and Arey214 | ||
| Ace | 1.6 × 10⁻⁴ | Reisen and Arey155 | 2.3 × 10⁻⁴ | Atkinson and Aschmann174 | 3.5 × 10⁻⁷ | Atkinson and Aschmann174 |
| 1.2 × 10⁻⁴ | Brubaker and Hites140 | 1.1 × 10⁻⁷ | Atkinson and Aschmann174 | |||
| 2.1 × 10⁻⁴ | Atkinson and Aschmann174 | |||||
| 1.2 × 10⁻⁴ | Klöpffer et al.170 | |||||
| 1.3 × 10⁻⁴ | Banceu et al.175 | |||||
| 1.6 × 10⁻⁴ | Klamt172 | |||||
| Acy | 2.5 × 10⁻⁴ | Reisen and Arey155 | 2.7 × 10⁻³ | Atkinson and Aschmann174 | 3.8 × 10⁻⁴ | Atkinson and Aschmann174 |
| 2.6 × 10⁻⁴ | Banceu et al.175 | 1.1 × 10⁻⁴ | Reisen and Arey155 | |||
| 2.2 × 10⁻⁴ | Atkinson and Aschmann174 | |||||
| Fln | 3.2 × 10⁻⁵ | Kwok et al.177 | 1.8 × 10⁻⁵ | Kwok et al.177 | 1.4 × 10⁻⁷ | Kwok et al.177 |
| 2.6 × 10⁻⁵ | Brubaker and Hites140 | |||||
| 2.0 × 10⁻⁵ | Klamt172 | |||||
| 2.6 × 10⁻⁵ | Klöpffer et al.170 | |||||
| Phe | 6.8 × 10⁻⁵ | Biermann et al.169 | 6.0 × 10⁻⁵ | Kwok et al.176 | 2.8 × 10⁻⁷ | Kwok et al.176 |
| 6.2 × 10⁻⁵ | Atkinson147 | |||||
| 5.1 × 10⁻⁵ | Klamt172 | |||||
| 3.1 × 10⁻⁵ | Lorenz and Zellner156 | |||||
| 2.5 × 10⁻⁵ | Kwok et al.176 | |||||
| 5.4 × 10⁻⁵ | Brubaker and Hites140 | |||||
| 6.4 × 10⁻⁵ | Lee et al.159 | |||||
| 1M-Phe | 5.8 × 10⁻⁵ | Lee et al.159 | ||||
| 2M-Phe | 1.3 × 10⁻⁴ | Lee et al.159 | ||||
| 3M-Phe | 1.3 × 10⁻⁴ | Lee et al.159 | ||||
| 9M-Phe | 1.5 × 10⁻⁴ | Lee et al.159 | ||||
| Ant | 2.2 × 10⁻⁴ | Biermann et al.169 | ||||
| 3.8 × 10⁻⁴ | Brubaker and Hites140 | |||||
| 2.6 × 10⁻⁵ | Kwok et al.176 | |||||
| 4.0 × 10⁻⁴ | Klamt172 | |||||
| 2.6 × 10⁻⁴ | Atkinson;147 Biermann et al.169 | |||||
| Flt | 2.2 × 10⁻⁵ | Brubaker and Hites140 | 3.3 × 10⁻⁸ | Atkinson et al.163 | ||
| Pyr | 1.0 × 10⁻⁴ | Atkinson et al.163 | 1.0 × 10⁻⁷ | Atkinson et al.163 | ||
| 1N-Nap | 1.1 × 10⁻⁴ | Atkinson147 | 1.9 × 10⁻⁸ | Atkinson210 | 4.1 × 10⁻⁷ | Atkinson207 |
| 2N-Nap | 1.1 × 10⁻⁴ | Atkinson147 | 1.7 × 10⁻⁸ | Atkinson210 | 4.1 × 10⁻⁷ | Atkinson207 |
| PAH | OH reactions | NO2 reactions | O3 reactions | NO3 reactions | ||||||||
|---|---|---|---|---|---|---|---|---|---|---|---|---|
|
k
(1)OH
(s−1) |
Ref. | Notes |
(s−1) |
Ref. | Notes |
(s−1) |
Ref. | Notes |
(s−1) |
Ref. | Notes | |
| a [OH] = 2 × 10⁶ molecules cm−3; global 12 h average.151 b [NO2] = 1.3 × 10¹¹; 2011 annual average, Harwell, UK. c [O3] = 6.9 × 10¹¹ molecules cm−3; 2011 annual average, Harwell, UK. d [NO3] = 5 × 10⁸ molecules cm−3; global 12 h average.151 | ||||||||||||
| Phe | 1.0 × 10⁻⁵ | Estève et al.255 | Graphite particles | 1.9 × 10⁻⁷ | Perraudin et al.276 | Silica particles | 3.1 × 10⁻⁶ | Perraudin et al.298 | Graphite particles | |||
| 6.5 × 10⁻⁷ | Estève et al.256 | Diesel exhaust particles | 2.3 × 10⁻⁶ | Nguyen et al.275 | Kerosene flame soot | 3.0 × 10⁻⁶ | Perraudin et al.298 | Silica particles | ||||
| 2.3 × 10⁻⁶ | Estève et al.255 | Graphite particles | ||||||||||
| 7.8 × 10⁻⁶ | Estève et al.256 | Diesel exhaust particles | ||||||||||
| 1.6 × 10⁻⁹ | Butler and Crossley270 | Ethylene flame soot | ||||||||||
| Ant | 8.8 × 10⁻⁶ | Estève et al.255 | Graphite particles | 6.9 × 10⁻⁵ | Perraudin et al.276 | Silica particles | 1.3 × 10⁻⁵ | Perraudin et al.298 | Graphite particles | |||
| 2.3 × 10⁻⁶ | Nguyen et al.275 | Kerosene flame soot | 1.8 × 10⁻⁵ | Perraudin et al.298 | Silica particles | |||||||
| 4.8 × 10⁻⁵ | Estève et al.255 | Graphite particles | ||||||||||
| 6.9 × 10⁻⁵ | Ma et al.278 | Silica particles | ||||||||||
| 3.7 × 10⁻⁵ | Ma et al.278 | MgO particles | ||||||||||
| Flo | 2.9 × 10⁻⁸ | Bedjanian et al.252 | 2.2 × 10⁻⁹ | Perraudin et al.276 | Silica particles | 2.5 × 10⁻⁶ | Perraudin et al.298 | Graphite particles | ||||
| 6.5 × 10⁻⁶ | Estève et al.255 | Graphite particles | 6.9 × 10⁻⁸ | Nguyen et al.275 | Kerosene flame soot | 1.9 × 10⁻⁶ | Perraudin et al.298 | Silica particles | ||||
| 7.6 × 10⁻⁷ | Estève et al.256 | Diesel exhaust particles | 2.0 × 10⁻⁵ | Estève et al.255 | Graphite particles | |||||||
| 6.9 × 10⁻⁶ | Estève et al.256 | Diesel exhaust particles | ||||||||||
| 1.7 × 10⁻⁹ | Butler and Crossley270 | Ethylene flame soot | ||||||||||
| Pyr | 3.1 × 10⁻⁸ | Bedjanian et al.252 | Kerosene flame soot | 1.4 × 10⁻⁵ | Perraudin et al.276 | Silica particles | 3.2 × 10⁻⁶ | Perraudin et al.298 | Graphite particles | 3.2 × 10⁻³ | Liu et al.260 | Azelaic acid particles |
| 6.5 × 10⁻⁶ | Estève et al.255 | Graphite particles | 6.9 × 10⁻⁸ | Nguyen et al.275 | Kerosene flame soot | 7.6 × 10⁻⁶ | Perraudin et al.298 | Silica particles | ||||
| 8.2 × 10⁻⁷ | Estève et al.256 | Diesel exhaust particles | 3.5 × 10⁻⁵ | Estève et al.255 | Graphite particles | 4.2 × 10⁻⁵ | Miet et al.297 | Silica particles | ||||
| 4.8 × 10⁻⁷ | Miet et al.257 | Silica particles | 1.0 × 10⁻⁵ | Estève et al.256 | Diesel exhaust particles | |||||||
| 3.3 × 10⁻⁹ | Butler and Crossley270 | Ethylene flame soot | ||||||||||
| 6.4 × 10⁻⁵ | Miet et al.277 | Silica particles | ||||||||||
| Chr | 1.8 × 10⁻⁸ | Bedjanian et al.252 | Kerosene flame soot | 4.1 × 10⁻⁷ | Perraudin et al.276 | Silica particles | 1.9 × 10⁻⁶ | Perraudin et al.298 | Graphite particles | 2.0 × 10⁻³ | Liu et al.260 | Azelaic acid particles |
| 1.0 × 10⁻⁵ | Estève et al.255 | Graphite particles | 6.9 × 10⁻⁸ | Nguyen et al.275 | Kerosene flame soot | 4.0 × 10⁻⁶ | Perraudin et al.298 | Silica particles | ||||
| 8.8 × 10⁻⁷ | Estève et al.256 | Diesel exhaust particles | 2.6 × 10⁻⁵ | Estève et al.255 | Graphite particles | |||||||
| 6.9 × 10⁻⁶ | Estève et al.256 | Diesel exhaust particles | ||||||||||
| 1.8 × 10⁻⁹ | Butler and Crossley270 | Ethylene flame soot | ||||||||||
| BaA | 1.8 × 10⁻⁸ | Bedjanian et al.252 | Kerosene flame soot | 4.6 × 10⁻⁶ | Perraudin et al.276 | Silica particles | 3.6 × 10⁻⁶ | Perraudin et al.298 | Graphite particles | 2.2 × 10⁻³ | Liu et al.260 | Azelaic acid particles |
| 1.1 × 10⁻⁶ | Estève et al.255 | Graphite particles | 6.9 × 10⁻⁸ | Nguyen et al.275 | Kerosene flame soot | 1.1 × 10⁻⁵ | Perraudin et al.298 | Silica particles | ||||
| 6.5 × 10⁻⁷ | Estève et al.256 | Diesel exhaust particles | 2.2 × 10⁻⁵ | Estève et al.255 | Graphite particles | |||||||
| 8.6 × 10⁻⁶ | Estève et al.256 | Diesel exhaust particles | ||||||||||
| 4.3 × 10⁻⁹ | Butler and Crossley270 | Ethylene flame soot | ||||||||||
| BkF | 2.1 × 10⁻⁸ | Bedjanian et al.252 | Kerosene flame soot | 1.5 × 10⁻⁶ | Perraudin et al.276 | Silica particles | 2.5 × 10⁻⁶ | Perraudin et al.298 | Graphite particles | |||
| 7.1 × 10⁻⁶ | Estève et al.255 | Graphite particles | 6.9 × 10⁻⁸ | Nguyen et al.275 | Kerosene flame soot | 4.6 × 10⁻⁶ | Perraudin et al.298 | Silica particles | ||||
| 1.7 × 10⁻⁵ | Estève et al.255 | Graphite particles | ||||||||||
| BaP | 2.2 × 10⁻⁸ | Bedjanian et al.252 | Kerosene flame soot | 6.4 × 10⁻⁴ | Perraudin et al.276 | Silica particles | 6.8 × 10⁻⁶ | Perraudin et al.298 | Graphite particles | |||
| 8.2 × 10⁻⁶ | Estève et al.255 | Graphite particles | 6.9 × 10⁻⁸ | Nguyen et al.275 | Kerosene flame soot | 1.8 × 10⁻⁵ | Perraudin et al.298 | Silica particles | ||||
| 5.9 × 10⁻⁷ | Estève et al.256 | Diesel exhaust particles | 5.4 × 10⁻⁵ | Estève et al.255 | Graphite particles | |||||||
| 1.0 × 10⁻⁵ | Estève et al.256 | Diesel exhaust particles | ||||||||||
| 6.9 × 10⁻⁹ | Butler and Crossley270 | Ethylene flame soot | ||||||||||
| BeP | 2.2 × 10⁻⁸ | Bedjanian et al.252 | Kerosene flame soot | 2.0 × 10⁻⁶ | Perraudin et al.276 | Silica particles | 2.1 × 10⁻⁶ | Perraudin et al.298 | Graphite particles | |||
| 9.4 × 10⁻⁶ | Estève et al.255 | Graphite particles | 6.9 × 10⁻⁸ | Nguyen et al.275 | Kerosene flame soot | 3.7 × 10⁻⁶ | Perraudin et al.298 | Silica particles | ||||
| 9.4 × 10⁻⁷ | Estève et al.256 | Diesel exhaust particles | 2.4 × 10⁻⁵ | Estève et al.255 | Graphite particles | |||||||
| 5.2 × 10⁻⁶ | Estève et al.256 | Diesel exhaust particles | ||||||||||
| 2.0 × 10⁻⁹ | Butler and Crossley270 | Ethylene flame soot | ||||||||||
| Per | 1.0 × 10⁻⁵ | Estève et al.255 | Graphite particles | 7.3 × 10⁻⁵ | Estève et al.255 | Graphite particles | ||||||
| IPy | 7.1 × 10⁻⁷ | Estève et al.256 | Diesel exhaust particles | 4.3 × 10⁻⁶ | Perraudin et al.276 | Silica particles | 2.5 × 10⁻⁶ | Perraudin et al.298 | Graphite particles | |||
| 6.9 × 10⁻⁸ | Nguyen et al.275 | Kerosene flame soot | 4.9 × 10⁻⁶ | Perraudin et al.298 | Silica particles | |||||||
| 5.2 × 10⁻⁶ | Estève et al.256 | Diesel exhaust particles | ||||||||||
| BgP | 1.2 × 10⁻⁵ | Estève et al.255 | Graphite particles | 3.2 × 10⁻⁵ | Perraudin et al.276 | Silica particles | 2.5 × 10⁻⁶ | Perraudin et al.298 | Graphite particles | |||
| 6.9 × 10⁻⁸ | Nguyen et al.275 | Kerosene flame soot | 9.2 × 10⁻⁶ | Perraudin et al.298 | Silica particles | |||||||
| 2.6 × 10⁻⁵ | Estève et al.255 | Graphite particles | ||||||||||
| 5.5 × 10⁻⁹ | Butler and Crossley270 | Ethylene flame soot | ||||||||||
| BgF | 1.7 × 10⁻⁸ | Bedjanian et al.252 | Kerosene flame soot | 6.9 × 10⁻⁸ | Nguyen et al.275 | Kerosene flame soot | ||||||
| AcP | 2.1 × 10⁻⁸ | Bedjanian et al.252 | Kerosene flame soot | 6.9 × 10⁻⁸ | Nguyen et al.275 | Kerosene flame soot | ||||||
| DBA | 3.2 × 10⁻⁸ | Bedjanian et al.252 | Kerosene flame soot | 6.9 × 10⁻⁸ | Nguyen et al.275 | Kerosene flame soot | ||||||
| DBaeP | 2.1 × 10⁻⁸ | Bedjanian et al.252 | Kerosene flame soot | 6.9 × 10⁻⁸ | Nguyen et al.275 | Kerosene flame soot | ||||||
| BbF | 2.4 × 10⁻⁸ | Bedjanian et al.252 | Kerosene flame soot | 6.9 × 10⁻⁸ | Nguyen et al.275 | Kerosene flame soot | ||||||
| Cor | 2.2 × 10⁻⁸ | Bedjanian et al.252 | Kerosene flame soot | 9.2 × 10⁻⁷ | Perraudin et al.276 | Silica particles | 2.5 × 10⁻⁶ | Perraudin et al.298 | Graphite particles | |||
| 6.9 × 10⁻⁸ | Nguyen et al.275 | Kerosene flame soot | ||||||||||
| 1.6 × 10⁻⁹ | Butler and Crossley270 | Ethylene flame soot | ||||||||||
| DBalP | 1.2 × 10⁻⁴ | Perraudin et al.276 | Silica particles | 1.7 × 10⁻⁵ | Perraudin et al.298 | Graphite particles | ||||||
| 1.7 × 10⁻⁵ | Perraudin et al.298 | Silica particles | ||||||||||
| 1N-Pyr | 2.0 × 10⁻⁷ | Miet et al.257 | Silica particles | 4.3 × 10⁻⁶ | Miet et al.277 | Silica particles | 2.9 × 10⁻⁶ | Miet et al.297 | Silica particles | 6.5 × 10⁻⁴ | Liu et al.260 | Azelaic acid particles |


These tables indicate that the gas phase reaction with OH remains the dominant loss process for PAHs and these reactions are approximately 3 orders of magnitude faster than the corresponding gas phase reactions with NO3.
It appears that for heterogeneous processes, PAH reactions with NO2 and O3 may be more important than second order rate coefficients would suggest. Indeed the absolute rates for PAH reactions with NO2 and O3 are shown to be comparable to those of OH reactions, depending on the specific surface type and conditions.
3.2.2.9. Summary and concluding remarks.
3.2.2.9.1. Key conclusions. • Heterogeneous reactivity of PAHs with atmospheric oxidants involves complex processes that have been shown to be influenced by a number of factors including the nature (chemical composition, surface area, porosity) of the matrix, presence of other species (e.g. nitric acid, water or other organic species), oxidant concentration, PAH molecule involved, and PAH surface concentration.
• The wide diversity in particle properties, including their chemical composition (organic, mineral, biogenic), sources (combustion, erosion, gas phase condensation), origin (natural, anthropogenic), the method of particle formation (temperature, pressure), physical properties (size, porosity, specific surface area), surface coatings (water, nitric acid, organic molecules), means that gaining a full understanding of this reactivity will be extremely difficult as the relative importance of these different factors is highly variable across reaction systems.
• Reaction with OH radicals is the dominant pathway for heterogeneous degradation of PAHs compared with reactions with NO2 and O3 with second order rate coefficients 1–7 orders of magnitude higher on carbonaceous particles.
• Particles are shown to exhibit a potential ‘inhibiting factor’ on the reactivity of PAHs due to slow diffusion of the oxidant or inaccessibility of PAHs in the bulk particle. This may turn PAHs to persistent compounds in air.
• Carbonaceous particles have the potential to stabilize the reactivity of PAH towards OH with slower rates than observed in the gas phase.
• Heterogeneous reactions of PAHs with O3 are observed to proceed more quickly than the corresponding reactions in the gas phase, with second order rate coefficients ≈2 orders of magnitude greater for certain compounds and model matrices studied so far.
• A number of ring-opened and ring-retaining products have been identified from these heterogeneous reactions including nitro-PAHs and quinones. In some cases, a difference has been noted between heterogeneous and gas phase reaction products. For example the observation of 1-nitropyrene from the reaction of particle-bound PAH is in contrast to the production of 2-nitropyrene from gas phase reactions.
• The heterogeneous reaction of PAH with ozone on a range of surfaces has been shown to follow Langmuir–Hinshelwood-type kinetics, where the pseudo-first order reaction rate is characterized by a dependence on gas phase concentration and available reaction sites and reactivity is strongly dependent on the degree of partitioning of ozone to the surface. This is shown to be strongly influenced by the specific nature of the particle surface.
• When atmospheric concentrations of the different oxidising species are considered, the absolute heterogeneous reaction rates of PAHs with OH, NO2 and O3 are comparable, depending on the specific particle surface and reaction conditions.
• Heterogeneous reaction chemistry of PAHs is far from being fully understood with knowledge of the reaction mechanisms, products and the factors that influence the reaction kinetics still lacking. Reaction rates for ambient conditions are very difficult to extrapolate, also because many aerosol matrices have not been included in laboratory studies so far.
3.2.2.9.2. Recommendations for future work. The following are areas we suggest for continued research in the area of heterogeneous PAH reactivity:
• Investigation of the mechanisms of the heterogeneous reactions of PAHs with NO2, OH and NO3 for various aerosol matrices and conditions.
• More comprehensive elucidation of reaction products of the heterogeneous reactions of PAHs, particularly for OH and NO3 reactions.
• Investigation of the reactions with OH radicals on silica particles for comparison with other reaction systems.
• Verification of the reactivity and products based on field studies, with particular emphasis on matrix effects.
Clearly, heterogeneous reactions (Section 3.2.2) can significantly contribute to the removal of semivolatile and non-volatile PAHs from the atmosphere and to the formation of mutagenic derivative compounds. A quantitative assessment of this contribution has to be considered preliminary and with great caution, because the representativity of model aerosols and laboratory conditions for ambient conditions is insufficient. For example, the matrix of secondary inorganic and organic aerosols has hardly been addressed. Furthermore, the processes ruling gas–particle partitioning are not fully understood, with the consequence that particulate mass fractions, θ, of the semivolatile PAHs in a given aerosol are uncertain, in particular in the cold (free troposphere, Arctic). Assuming representativity of studied model aerosols for ambient aerosols (namely silica for unspecific particulate mass, diesel and flame soot for BC) and a range of θ observed (although in the near ground atmosphere only) the PAHs' lifetimes towards heterogeneous photochemical degradation, τhet, are estimated to range between 2 hours and >10 days for oxidant and BC concentrations typical for the continental background in mid latitudes. (For values >10 days atmospheric lifetime would be limited by physical sinks, i.e. deposition.) Total photochemical residence times, τtotal, resulting as τtotal = [(1 − θ)/τhom + θ/τhet]−1, are listed in Table 9. Obviously, most of the uncertainty of τtotal for semivolatile and non-volatile PAHs results from the consideration of heterogeneous reactivity (related to the aerosol characteristics' variability). It enhances overall reactivity significantly for the semivolatile (partly partitioning to particles) PAHs, e.g. Flt and Chr, but less for Pyr (Table 9).
Zimmerman et al.310 recently observed the formation of nitro-PAH isomers on PM samples exposed to a mixture of N2O5–NO2–NO3 in a chamber reaction study. The authors attributed this to a heterogeneous reaction with surface-adsorbed N2O5 as opposed to reaction with radical NO3. It was proposed that such heterogeneous reactivity could lead to the formation of nitro-PAH isomers such as 1-NPyr during atmospheric transport of PM. However, the concentrations of NO2 and N2O5 used in this study were factors of >100 higher than observed under ambient conditions so the applicability of this observation in the atmosphere is uncertain.
4. Long-range transport
Slow photochemical degradation (Section 3.2) and limited deposition along transport (Section 3.1.2) permit long-range atmospheric transport of PAHs.4.1. Observations at remote sites
Evidence of long-range transport of PAH comes from numerous observations in air and precipitation/deposition at remote terrestrial and marine sites (Table 11). Only a few monitoring stations at remote sites are operating and these are concentrated in Europe and North America. Levels at remote sites are at least one order of magnitude lower than within source areas311,312 and some of the (often addressed) 16 USEPA priority PAHs were below the limits of quantification. Elevated PAH concentrations far from combustion sources were observed in long-range transported plumes of open fires, such as from biomass burning in Africa (over the Atlantic313) and boreal forest fires (in high latitudes62,314). Because of photodegradation being more efficient in summer and emissions being higher in winter, winter levels usually exceed summer levels at receptor sites. An exception, i.e. minima in winter, was observed on mountain sites in Oregon, USA315 which can be explained by air mass trajectory statistics. Observations at remote sites are usually considered to prove the LRT potential. In some cases, however, the influences of local emissions are difficult to exclude. For example, the Zeppelin observatory, near Ny Alesund, Svalbard, is considered to reflect the remoteness of the Arctic island's environment with usually very low levels observed (e.g. 46–75 pg m−3 in July and 260–1500 pg m−3 in January of recent years for the sum of 15 PAH; Table 11). However, samples collected at the station may have been influenced by smoldering combustion in underground coal mines in the years 2005–2006 and 2009–2010 and in a mine dump 2006–2008 in the region (located 150–200 km north of the station; Kallenborn, Norwegian Institute for Air Research, personal communication).| n | c tot | Ref. | ||
|---|---|---|---|---|
| a Sum of 24, including naphthalene. b Sum of 11. c Sum of 8. d Passive sampling, equivalent air volume inferred from performance reference compound or following Melymuk et al.323 e Passive sampling, equivalent air volume inferred from side-by-side sampling (Klánová, personal communication). f Sum of 9. g Total sampling time of 8 d per month. h Sum of 12. | ||||
| Continental remote and mountain sites | ||||
| Tagish, Yukon, Canada 60°N/134°W | Oct 1993–Apr 1994/May–Sep 1993 | 7/5 | 300/61 | Halsall et al.318 |
| Redó, Pyrenees (2250 m a.s.l.) | Jun 1997/Feb 1997 | 7/3 | ≈1650/2750a | Fernández et al.317 |
| Gossenkölle, Alps (2413 m a.s.l.) | Jul 1997/Mar 1997 | 6/4 | ≈2750/2000a | |
| Øvre Neådalsvatn, Central Norway (728 m a.s.l.) | 1996–1998 | 8 | 1900 | van Drooge et al.325 |
| Izana, Tenerife (2367 m a.s.l.) | 2000 | 12 | 240 | |
| Skalnaté Pleso, High Tatras (1778 m a.s.l.) | 2001–2002 | 9 | 5100 | |
| Mt. Bachelor, Oregon, USA (44°N/122°W, 2763 m a.s.l.) | Spring and summer/fall and winter 2004–2006 | 26/10 | ≈1400/≈450 | Primbs et al.315 |
| Lake Nam Co, Tibetan Plateau (31°/91°E, 4730 m a.s.l.) | Oct 2006–Feb 2008 | 15 | 75–1470b | Xiao et al.326 |
| Jungfraujoch, Alps (3573 m a.s.l.) | Jul–Oct 2006 | 1 | 1440c,d | Halse et al.319e |
| Moussala, Balkans (2925 m a.s.l.) | 1 | 500c,d | ||
| Chopok, High Tatras (2008 m a.s.l.) | 1 | 1300c,d | ||
| Zugspitze, Alps (2650 m a.s.l.) | Jun 2007/Feb 2008 | 8/14 | 71/1027 | Lammel et al.322 |
| Molopo Reserve, Barberspan (steppe), South Africa (1366 m a.s.l.) | Jan–Jun 2008 | 12 | 36–125e | Klánová et al.312 |
| Tombouctou, (desert) Mali, West Africa (200 m a.s.l.) | 6 | 55–160e | ||
| Mt. Kenya (3650 m a.s.l.) | 6 | 23–36e | ||
| Marine sites | ||||
| Finokalia, Crete, Mediterranean 35°N/26°E | Feb 2000–Feb 2002 | 23 | 13500 |
Tsapakis and Stephanou25 |
| North Pacific (cruise) 52–62°N | Jul–Sep 2003 | 10 | 11260 |
Ding et al.26 |
| Biscay Bay, Atlantic (cruise) 46–49°N | Oct–Nov 2005 | 3 | 1370f | Nizzetto et al.313 |
| Eastern North Atlantic (cruise) 25–31°N | 4 | 230f | ||
| Eastern Equatorial Atlantic (cruise) 0–25°S | 13 | 170f | ||
| Malta, Giordan Lighthouse, Med. 36°N/14°E | Aug–Nov 2006 | 1 | 2510c,d | Halse et al.319e |
| Mace Head, Ireland 53°N/10°W | Jul–Oct 2006 | 1 | 5690c,d | |
| Arctic and Antarctic sites | ||||
| Barrow, Alaska, US, 71°N | Mar 1979 | 3 | ≈1190b | Daisey et al.316 |
| Aug 1979 | 5 | 157b | ||
| Dye 3, Greenland 65°N/44°W | Winter-spring 1989 and spring-summer 1991 | 9 | 18–200f | Jaffrézo et al.321 |
| Alert, Canadian Archipelago 82°N/62°W | Feb–Apr 1988 | 10 | ≈290–1100b | Patton et al.324 |
| Oct 1993–Apr 1994/May–Sep 1994 | 7/5 | 695/48 | Halsall et al.318 | |
| Jan–Dec 1992/1993/1994 | 52/52/52 | 900/570/370 | Hung et al.320 | |
| Jan–Dec 1998/1999/2000 | 52/52/52 | 430/180/150 | ||
| Dunai Island, Eastern Siberia 74°N/124°E | Nov 1993–Mar 1994/May–Aug 1993 | 4/4 | 2450/122 | Halsall et al.318 |
| Zeppelinfjell, Spitsbergen 79°N12°E | Jul 1994–1996/Jan 1994–1996g | 13/13 | 180–330/2400–6600h | EMEP16 |
| Jul 2008–2010/Jan 2008–2010g | 13/13 | 46–75/260–1500 | ||
| Arctic Ocean (cruise) 65-80°N/150–180°W | Jul–Sep 2003 | 29 | 3700 | Ding et al.26 |
| Pallas, Finland 68°N/24°E | Jul–Oct 2006 | 1 | 600c,d | Halse et al.319e |
Snow (firn) and ice core studies allow the assessment of temporal deposition trends. PAH deposition at high mountain sites in Europe and North America was traced back until 1700 and 1875, respectively.327,328 Levels in Europe increased with fossil fuel use (coal), significantly by the year 1900.327,329 PAH accumulates in high altitude soils and biota.330,331 Contamination in the Arctic is comparable with high mountain sites in Europe: PAH levels in the range of 36–660 ng L−1 were reported from an ice core in the Canadian Archipelago attributed to the years 1963–1993332 and 0.6–237 ng kg−1 in an ice core from Greenland attributed to 1987–1990333 (Table 11). In the Arctic, meridional transports carrying PAHs are common in particular in the so-called haze season, i.e. spring-time.318,334
No continuous monitoring of PAHs in Antarctic air has been conducted so far. Deposited amounts are lower than in the Arctic, it seems. Snow contamination by PAH on the Ekström shelf ice, 2002–2005, was completely explained by emissions within the region (ships, research stations), whereas no influence of intercontinental transport was suggested.335 Mostly due to the atmospheric dynamics of the region (polar vortex in the Southern Ocean), intercontinental atmospheric transport to the Antarctic continent is much less likely than in the Arctic. Levels in snow are 18–99 ng L−1 in surface and deep snow for 1987–1991 on the Antarctic Peninsula (Terra Nova Bay, 74–75°S, 163–164°E336) and 26–197 ng L−1 on the Ekström Shelf Ice in the Weddell Sea.335
PAH observations in the remote marine environment are very rare. Ship-based measurements are often unreliable because of blank problems related to fuel emissions from the ship.337 Measurements in seawater demonstrate the deposition of PAH from combustion sources to the open ocean.337
4.2. Model results
The transport of fluorene, phenanthrene, fluoranthene and benzo[a]pyrene from the UK to northern Russia has been studied using a Lagrangian box model.338 Regional (North America) and trans-Pacific transport pathways of PAHs were documented based on back trajectories.314,315,339–341 The atmospheric fate of PAHs was studied for the Los Angeles Basin using another multimedia model.342 The potential influence of seasonally dependent environmental fate processes on the observed seasonality of concentrations of six PAHs in air was investigated for the UK using a multimedia box model (climatological atmospheric transports343). The regional and hemispheric transport and fate of benzo[a]pyrene was studied by atmospheric and multicompartment models with a focus on Europe35,344–348 and East Asia.349,350 Global distribution and fate of benzo[a]pyrene and 1–2 semivolatile PAHs were studied using an atmosphere general circulation model based multicompartment model36,351 and using an assimilated meteorology driven atmospheric model.352 Due to lack of consolidated kinetic data the heterogeneous reactivity of PAHs (i.e. basically total reactivity in the case of BaP) has been neglected so far in most model studies (assumption of zero degradability in the particulate phase).Conventional atmospheric chemistry models neglect re-volatilisation from surfaces. As benzo[a]pyrene volatility is low (vapour pressure, p = 7.3 × 10⁻⁷ Pa at 298 K) its tendency to re-volatilise upon deposition to surfaces is limited, but still secondary emissions are estimated to contribute 9% to total emissions on the European continent (2007 emissions345). However, parameterisations of air–soil exchange which are in use in multicompartment models are not well validated. Multicompartment models so far have been neglecting PAH cycling in the cryosphere (sea ice, land ice, temporary snow cover).
The LRT potential of PAHs has been quantified.36,345,351,352 For benzo[a]pyrene, benzo[b]fluoranthene, benzo[k]fluoranthene, and indeno[1,2,3-cd]pyrene it was characterized to be regional and close to the one of polybrominated diphenylethers; i.e., areas of high emission are still reflected in the deposition pattern (e.g. Gusev et al.35). However, a large part of PAH transport occurs in the free troposphere, above the planetary boundary layer.350,351 Atmospheric half-lives of 3–5 ring PAHs are of the order of hours or days and do vary among model studies considerably. This reflects uncertain or unknown rate coefficients and the uncertainty with regard to air–soil exchange and processes which determine partitioning, as well as different methods of representation of these processes. Accordingly, model estimates for the total environmental residence time, which weighs all the compartmental residence times including in soil and water, where degradability is slow, do vary largely across models, namely 2–66 months for benzo[a]pyrene.353 Assuming similar degradability in the particulate and gas phase would lead to unrealistically short lifetimes.36,352 Hence, modelling provides evidence that degradation kinetics in the particulate phase must be significantly slower than in the gas phase.
Gas–particle partitioning strongly influences the atmospheric cycling, the total environmental fate including compartmental distributions and the LRT potential. Using a global model including a dynamic aerosol sub-model with the components OM and soot, the comparison of various gas–particle partitioning models suggests that for BaP, Ant and Flt both adsorption (preferentially to soot) and absorption (into OM) processes are contributing, and that total environmental burdens would be significantly lower assuming adsorption alone.36 Most of the total environmental burden of BaP, Ant and Flt, namely 80–90%, is found in soil (including vegetation) after a few years of continuous emission into the model world atmosphere, while the atmospheric burdens of these substances account for 2–4% and oceanic burdens for 5–12%.
The effective meridional spreading (MS) and the spatial range (SR), measures for the tendency of distributions to extend across latitudes, of benzo[a]pyrene were quantified to 1000 km in air by a zonal multimedia fate model but and 10000 km by the general circulation model based multicompartment model.353 Multimedia fate models underestimate the transport in the free troposphere, because temporal and spatial variability of wind is not represented and, hence, should underestimate the LRT potential. Multimedia models have been used in the context of substance screening for POPs criteria and accounting for the multicompartmental cycling of PAH on various spatial scales (e.g. Hauck et al.354). The LRT potential of semivolatile PAHs is higher than that of benzo[a]pyrene and other 5-ring PAHs. It is enhanced by re-volatilisation. Re-volatilisation was estimated to account for >10% of the Ant and Flt global total emissions throughout the year.36 The numerical values of the various LRT metrics in use strongly depend on the evaluation methodology and on model design.
As a number of PAHs, e.g. Pyr (Section 3), are converted in photochemistry into long-lived derivatives which undergo LRT1,355 and, eventually, are ubiquitously distributed, the assessment of PAHs' LRT potential and environmental risk should also include these derivatives. This aspect has been addressed in a box model study only.342 As PAHs can enter the food web, integrated modelling is needed to assess the exposure of the ecosystems356,357 and, hence, uptake along food chains.
4.3. Recommendations for future work
The assessment of LRTP relies on remote observations and related model results, i.e. residence times and LRTP.• Monitoring at remote sites of continents other than Europe and North America
• Validation of air–soil exchange parameterisations used in models in order to better account for the LRT potential being enhanced by secondary emission (re-volatilisation)
• Extend assessment of pollutants' LRT potential to derivatives of PAHs, in particular nitro-PAHs
• Include PAHs in food web modelling
5. Observational evidence for atmospheric reactions of PAHs in the atmosphere and formation of nitro- and oxy-derivatives
Levels of oxy- and nitro-PAH compounds in the ambient atmosphere, as well as the extent and nature of their direct emission sources have been widely investigated in the last 30 years. Tables S1 and S2 of the ESI† provide an overview of specific oxy- and nitro-PAH compounds respectively, identified in atmospheric samples, in studies of different combustion emission sources, and in product studies of laboratory reaction experiments. A review of environmental occurrence of oxy-PAH in the atmosphere was recently provided by Walgraeve et al.,358 which discussed the levels of these compounds in the atmosphere as well as their seasonality, partitioning behaviour and environmental fate. To our knowledge, no such review exists for nitro-PAH compounds. It should be noted that Tables S1 and S2 (ESI†) do not provide details of measured concentrations. For details of this, the reader is directed to the specific references provided or the review by Walgraeve et al.358As discussed in detail in Section 3, laboratory experiments strongly indicate that both gas phase and heterogeneous reactions of PAHs can occur under environmentally relevant conditions in the atmosphere and can contribute to the observed levels of these compounds. The potentially mutagenic nature of these reaction products is a concern from a public health perspective. However, the key questions remain: (i) to what extent do these reactions occur in the ambient atmosphere? (ii) What is the relative contribution of these reactions to observed levels of PAH-derivative compounds in the atmosphere compared with primary combustion emissions?
A number of ambient sampling approaches have been used to address these questions, in addition to or in conjunction with, laboratory reaction kinetics data. These sampling studies have been discussed previously.135,151 Here we provide an updated review of the current evidence of PAH reactivity and the formation of nitro- and oxy-PAHs in the atmosphere. This includes a discussion of differences in isomer profiles, temporal concentration variations, air-mass trajectory studies, theoretical calculations and the impact of source reduction measures.
5.1. Isomer profiles
As discussed in Section 3, the position on the aromatic ring where oxidation or nitration of a PAH compound occurs will determine the specific isomer of the oxy- or nitro-PAH derivative formed. Differences in the reaction mechanism during combustion processes and atmospheric photodecomposition processes can therefore produce distinct isomer product distributions. A key observation that can lead to an assessment of the relative contribution of direct emissions compared to atmospheric formation is therefore comparison of the isomer profiles of specific oxy- and nitro-PAH compounds observed in ambient sampling studies.It has been noted that the key formation mechanism during combustion processes (see Table S2, ESI†) which produce nitro-PAH isomers is electrophilic nitration which creates products distinct from the isomers formed from radical-initiated reactions.359 For example, electrophilic nitration products for the reactions of pyrene and fluoranthene are noted as 1N-Pyr and 3N-Flt, while gas phase reactions under simulated atmospheric conditions are shown to form mainly 2N-Pyr and 2N-Flt.135
As shown in Table S2 (ESI†), 2N-Flt and 2N-Pyr have been observed in ambient air samples in many different locations around the world but are generally not observed in direct emissions. 2N-Flt has been observed in a direct industrial emission from carbon electrode manufacture360 but this is not considered to be a major contributor on a large scale.361 Zhu et al.362 also identified 2N-Flt in diesel vehicle emissions but with an emission rate significantly lower (∼0.2%) than that of 1N-Pyr. The isomers 2N-Flt and 2N-Pyr are therefore commonly used as markers for gas phase reaction products. Conversely, 1N-Pyr has been identified in a number of incomplete emission sources including diesel- and gasoline-fuelled vehicles, coal-fired power plants and aluminium smelting (see Table S2, ESI†) but is not observed as a gas phase reaction product, making it suitable as a marker for direct emissions.
2N-Flt and 2N-Pyr have been reported to be present in the atmosphere at higher levels than 1N-Pyr.360,361,363–372 The observation of 2N-Flt and 2N-Pyr associated with PM in ambient studies at these levels is therefore indicative of the occurrence of OH and/or NO3 radical-induced reactions in the ambient atmosphere. Furthermore, measured concentrations of 2N-Flt and 2N-Pyr are generally consistent with those predicted based on measured rate coefficients and formation yields.188,204,220,373
Due to the distinct origins of the 2N-Flt and 1N-Pyr isomers, the 2N-Flt/1N-Pyr ratio can be used to assess the relative contribution from atmospheric reactions (OH and NO3) compared to that of direct emissions.355,364,365,372,374,375 It is suggested that, assuming comparable levels of Flt and Pyr are present and the same dispersion and photolytic loss rates of the two isomers, a 2N-Flt/1N-Pyr ratio of >5 indicates the dominance of atmospheric reactions while a ratio of <5 indicates the dominance of direct combustion emissions.355,376
It is indicated from laboratory studies that 2N-Flt can be formed via both OH and NO3 initiated reactions,163,188 while 2N-Pyr will be formed only by OH-initiated reactions.163,220 The ratio between these two isomers can therefore be used as an indicator for the relative importance of OH (daytime) and NO3 (night time) reaction pathways.364,374,377 A value of between 5 and 10 would indicate the dominance of the OH reaction pathway, while a value of above 100 would suggest the enhanced importance of NO3-initiated reactions.376
Values of the 2N-Flt/1N-Pyr and 2N-Flt/2N-Pyr ratios measured in a number of different locations and conditions are presented in Tables 12 and 13 respectively. It can be seen that the values of both isomer ratios are highly variable between sites and under different specific conditions. A 2N-Flt/1N-Pyr value of >5 is more commonly observed,355,364,372,378 indicative of atmospheric formation dominating in these studies. Locations with lower 2N-Flt/1N-Pyr ratios are generally areas with a dominant specific source, such as heavily trafficked areas367,374,379 and large urban centres.364,371,380 It has been noted that the 2N-Flt/1N-Pyr ratio is generally higher at suburban sites relative to their proximate urban site.364,374,375 This has been attributed to a longer exposure of the air mass to photochemical oxidants.355
| Location | Details | 2NF/1NP | Ref. |
|---|---|---|---|
| Marseilles area, France | Urban and suburban | <5 | Albinet et al.134 |
| Marseilles area, France | Rural | >10 | Albinet et al.134 |
| Alpine Valley locations, South France | Mean summer value (one location) | >20 | Albinet et al.376 |
| Alpine Valley locations, South France | Mean winter value (all locations) | <10 | Albinet et al.376 |
| Baltimore, USA | Urban, winter | 1–3 | Bamford and Baker364 |
| Baltimore, USA | Urban, summer | 6–24 | Bamford and Baker364 |
| Baltimore, USA | Suburban | 1–10 | Bamford and Baker364 |
| Baltimore, USA | Urban | 8–30 | Bamford and Baker364 |
| Barcelona, Spain | Residential area | 4 | Bayona et al.381 |
| Milan, Italy | Residential area | 6.1 | Cecinato et al.382 |
| Rome, Italy | Residential area | 1.4 | Cecinato et al.382 |
| Columbus, USA | Residential area | 2.5 | Chuang et al.383 |
| Rome, Italy | Urban | 6.7 | Ciccioli et al.355 |
| Milan, Italy | Urban | 5.2 | Ciccioli et al.355 |
| Naples, Italy | Residential area | 1 | Ciccioli et al.355 |
| Montelibretti, Italy | Suburban | 9 | Ciccioli et al.355 |
| Madrid, Spain | Suburban | 7 | Ciccioli et al.355 |
| C.Porziano, Italy | Suburban | 12 | Ciccioli et al.355 |
| Birmingham, UK | Roadway tunnel | 2.5 | Dimashki et al.379 |
| Ho Chi Minh City, Vietnam | Urban | 21 | Hien et al.367 |
| Ho Chi Minh City, Vietnam | Traffic site | 2.7 | Hien et al.367 |
| Copenhagen, Denmark | Traffic site | 0.72 | Feilberg et al.374 |
| Tokyo, Japan | Urban (summer) | 8.9 | Kojima et al.387 |
| Tokyo, Japan | Urban (winter) | 5.4 | Kojima et al.387 |
| Kanazawa, Japan | Urban | 1.8 | Murahashi and Hayakawa380 |
| Athens, Greece | Urban | 2.1 | Marino et al.375 |
| Riverside, USA | Urban background | 8.75 | Pitts et al.369 |
| Los Angeles, USA | Urban | 3.9 | Reisen and Arey371 |
| Claremont, USA | Urban background | 7.8 | Ramdahl et al.370 |
| St Louis, USA | SRM (1648) | 3.5 | Ramdahl et al.370 |
| Washington DC, USA | SRM (1649) | 3 | Ramdahl et al.370 |
| Aurskog, Norway | Rural residential | 3.7 | Ramdahl et al.370 |
| Beijing, China | 2008 Olympic Games | 25–46 | Wang et al.397 |
| Houston, USA | Suburban | 4.2 | Wilson et al.384 |
| Claremont, USA | Urban | 21 | Zielinska et al.218 |
| Location | Details | 2NF/2NP | Ref. |
|---|---|---|---|
| Marseilles area, France | Rural | 3.7 | Albinet et al.134 |
| Alpine Valley locations, France | Mean summer value (one location) | <60 | Albinet et al.376 |
| Alpine Valley locations, France | Mean winter value (all locations) | <10 | Albinet et al.376 |
| Baltimore, USA | Urban | 5–57 | Bamford and Baker364 |
| Baltimore, USA | Suburban | 7–60 | Bamford and Baker364 |
| Barcelona, Spain | Residential area | 6 | Bayona et al.381 |
| Rome, Italy | Residential area | 2.2 | Cecinato et al.382 |
| Milan, Italy | Residential area | 4.6 | Cecinato et al.382 |
| Naples, Italy | Residential area | 1.7 | Ciccioli et al.355 |
| Montelibretti, Italy | Suburban | 4.5 | Ciccioli et al.355 |
| Madrid, Spain | Suburban | 3.5 | Ciccioli et al.355 |
| C.Porziano, Italy | Suburban | 6 | Ciccioli et al.355 |
| Copenhagen, Denmark | Urban and suburban | <10 | Feilberg et al.374 |
| Copenhagen, Denmark | Urban and suburban | 14.2 | Feilberg et al.374 |
| Athens, Greece | Urban | 1.9 | Marino et al.375 |
| Riverside, USA | Ambient POM | 23.3 | Pitts et al.369 |
| Claremont, USA | Urban background | 35 | Ramdahl et al.370 |
| St Louis, USA | SRM (1648) | 9.3 | Ramdahl et al.370 |
| Washington DC, USA | SRM (1649) | 12 | Ramdahl et al.370 |
| Aurskog, Norway | Rural residential | 3.3 | Ramdahl et al.370 |
| Los Angeles and Riverside, USA | Winter | 16 ± 7 | Reisen and Arey371 |
| Los Angeles and Riverside, USA | Summer | >35 | Reisen and Arey371 |
| Finokalia, Crete | Mean value from a diurnal study, marine background location | 3.5 | Tsapakis and Stephanou377 |
| Beijing, China | 2008 Olympic Games | 3.4–4.8 | Wang et al.397 |
The relatively low (<10) 2N-Flt/2N-Pyr ratios in most studies, are indicative of daytime OH-initiated reactions dominating over NO3-initiated reactions, as indicated in laboratory reaction studies. Higher 2N-Flt 2N-Pyr ratios have been noted in rural areas compared to urban areas,134,376 suggesting increased importance of NO3 reactions, which may be attributed to lack of fresh inputs of NO.364,376 It may be expected that, since NO3 reactions occur almost entirely at night and OH reaction will occur during the day, there may be a distinct change in 2N-Flt/2N-Pyr over a diurnal cycle. However, Feilberg et al.374 noted that there was only a small increase in the 2N-Flt/2N-Pyr value during night time sampling (see Table 13). The authors therefore suggest that NO3-initiated reactions play a minor role in the formation of 2N-Flt in these night time samples and attributed the presence of 2N-Flt to transport and dilution of OH-initiated reaction products.
It should be noted that the 2N-Flt/1N-Pyr and 2N-Flt/2-NP ratios reflect simply the relative levels of these isomers in the atmosphere and while they can be used as a reasonable marker for OH and/or NO3 initiated reactions in the atmosphere, it should be considered that these ratios can be influenced by a number of other factors which may alter the ratio. For example, the relative input and removal rates of particulate matter may be of importance. Similarly, meteorological factors such as changes in mixing height and levels of solar irradiation can affect the levels of these isomers by influencing the degree of their dispersion and photolytic loss respectively.366 The use of these ratios should therefore be used with caution when assessing the relative importance of OH and/or NO3-induced PAH reactivity, particularly over a relatively short sampling period. (Tables 12 and 13)377,379–384
The occurrence of radical-induced reactions has also been assessed by comparing the isomer distribution of naphthalene derivatives from ambient air samples with that of experimental reaction products. For example, it has been noted in several studies that the isomer profiles of N-Naps, MN-Naps and EN-Naps + DMN-Naps observed in ambient air are reasonably consistent with their formation from radical induced atmospheric reactions.180,218,361,371,378,385
As discussed by Atkinson and Arey (2007), MN-Naps profiles from a laboratory study of the reaction of 1- and 2M-Naps with OH radicals180,371 strongly resemble that of an ambient air sample taken during the morning hours in Mexico City, suggesting that atmospheric reactions have a strong influence of the levels and isomer profile of these compounds in urban air. Similarly, night-time air samples provide evidence for the occurrence of NO3-induced reactions in the atmosphere. The profile of MN-Naps from a chamber reaction of NO3 radicals produces a different profile to that of the OH-induced reaction and closely resembles the profile of a night time air sample from a receptor site downwind of urban Los Angeles (see Atkinson and Arey151 and Reisen and Arey371 for a more detailed discussion of these observations).
Based on similar observations of alkylnitronaphthalene isomer profiles, Wang et al.219 suggested specific isomers or isomer ratios as indicators for the occurrence of OH and/or NO3 reactions. For example, it was suggested that the isomers 2E1N-Nap, 1,7DM8N-Nap, 2,7DM1N-Nap, 1,6DM5N-Nap, 1,3DM4N-Nap and 1,2DM4N-Nap are indicative of NO3-induced formation, while low levels of these compounds in comparison with 1,7DM5N-Nap suggest the dominance of OH-induced reactions.219 Furthermore, relatively high ratios of 2,7DM4N-Nap/1,7DM5N-Nap and of 2M4N-Nap/1M5N-Nap are suggested to be indicative of the predominance of NO3 reaction chemistry relative to OH reactions.219
Reisen and Arey371 measured concentrations of PAHs and nitro-PAHs in California and noted that the formation ratios (nitro-PAH/PAH) for nitronaphthalenes and alkyl-substituted nitronaphthalenes followed the order N-Naps < MNNs < DMN-Naps + EN-Naps. These formation ratios were suggested to be due to atmospheric reactions of PAHs with OH radicals and were shown to be a factor ∼10 higher in summer compared to winter, which was attributed to enhanced photochemical activity during summertime. The observed trend in nitro-PAH/PAH ratios for these compounds is consistent with the observed ‘activating effect’ of alkyl groups on OH and NO3 reactivity as described by Phousongphouang and Arey171,214 (see Section 3.2.1.1.4), providing further evidence for the occurrence of atmospheric reactions, similar to those observed in laboratory reactions.
As discussed by Kameda,386 the gas phase reaction of triphenylene with OH and NO3 has been shown to form the nitro-PAH derivatives 1-nitrotriphenylene (1N-TPh) and 2-nitrophenylene (2N-TPh). These reactions preferentially form 2N-TPh. Kameda386 noted that the ratio of 2N-TPh/1N-TPh observed in samples of airborne particles was >1.55, similar to that observed from gas phase OH- and NO3-initiated reactions (2N-TPh/1N-TPh = 1.22 to >1.5). The 2N-TPh/1N-TPh ratio observed in diesel exhaust particulate samples was shown to be much lower (2N-TPh/1N-TPh = 0.37), suggesting that radical-induced reactions contribute to the observed levels of these compounds, particularly 2N-TPh and that direct combustion emissions predominantly contribute to the levels of 1N-TPh.
Studies have also used the ratio of oxy- or nitro-PAH to their ‘parent’ PAH to assess the importance of atmospheric reactions on the levels of these compounds. For example, in the review by Walgraeve et al.,358 the ratio of oxy-PAH/‘parent’ PAH was assessed for ambient sampling studies in the literature. It was shown that during winter, 50% of these ratios was between 0.006 and 0.16 (19 studies358). In summer this ratio was reported to be about 20 times higher than the winter samples, with 50% of ratios between 0.54 and 3.6 (48 studies358). This suggests the increased importance of photochemical activity during summer leading to higher levels of oxy-PAHs, thus providing evidence for the importance of atmospheric reactions.
5.2. Temporal concentration patterns
Temporal (daily, seasonal and diurnal) variations in the concentrations of atmospheric pollutants will be influenced by a number of factors including the variation in specific combustion sources, mixing height level, photolytic loss rates and gas–particle partitioning. Temporal changes in the levels of oxy- and nitro-PAH compounds have been investigated to assess the impacts of these variations and can be viewed with reference to the relative contribution of photochemical reactions to the observed levels of these compounds.Kojima et al.387 investigated daily and seasonal variations in concentrations of nitro- and oxy-PAHs associated with airborne PM in Tokyo, Japan. They observed that summer/winter concentration ratios were higher for 2N-Flt (0.36) than for 1N-Pyr (0.19–0.27), consistent with 2N-Flt being a secondary reaction product and 1N-Pyr being a primary emission. In contrast, the summer/winter concentration ratios for oxy-PAHs were the same as or lower than that of PAHs, contrary to the expected lower concentrations resulting from the contribution of secondary reactions. The authors suggested that this discrepancy may result from the increased partitioning of semi-volatile oxy-PAHs from the particulate phase to the gas phase in summer resulting in relatively low concentrations associated with the PM samples, as previously observed by Albinet et al.388 Kojima et al.387 observed strong correlations between oxy-PAH concentrations and primary emissions such as PAHs and CO in winter, while a much weaker correlation was noted in summer. This may indicate the relative dominance of direct emissions of oxy-PAHs in winter and a greater importance of atmospheric reactivity in summer.
Reisen and Arey371 noted that levels of PAHs in the Los Angeles area were elevated in winter relative to summer which can be attributed to lower mixing heights resulting in lower dispersion rates364,371 or less efficient photolytic loss.246,389 In contrast, nitro-PAHs at a site ∼60 km downwind of Los Angeles had concentrations generally higher in summer, indicating the greater importance of photochemical reactions in summer, when levels of atmospheric oxidants (OH, NO3, O3) are higher,178,389 therefore indicating enhanced secondary input of these compounds during summer. A similar observation was made by Eiguren-Fernandez et al.390 for PAH–quinone compounds.
2N-Flt/1N-Pyr have been shown to be lower during winter, especially in urban areas,376 indicating that atmospheric reactions are less important in winter relative to direct emissions. Similarly, in winter, the 2N-Flt/2N-Pyr ratio has been shown to be higher than in summer,364,371,374 suggesting that NO3-initiated reaction may play a more important role during winter. These two observations may be explained by lower intensity of photochemical activity in winter, leading to lower levels of OH radicals in the atmosphere during winter. Winter conditions may however be more favourable to the formation of the NO3 radical, and to lesser photolytic losses of this species.
Variations in pollutant concentration over a 24 h period can be indicative of the nature and extent of their input and output mechanisms to the atmosphere. This is particularly relevant to the case of PAH-derivative compounds. While the diurnal variation of parent PAHs is likely to reflect direct source emission signals as modified by meteorology, the levels of nitro- and oxy-PAHs, which may result in part from atmospheric reactions, may display different patterns, possibly reflecting the relative balance of primary and secondary inputs. Furthermore, the nature of the atmospheric reactions of PAHs in the atmosphere, with OH reactions occurring during daylight and NO3 reactions occurring at night, will lead to potentially distinct diurnal patterns in the levels of nitro- and oxy-PAHs.
Since OH radicals are only present during daylight hours night time/daytime concentration ratios provide an assessment of unreacted versus reacted air masses, and the relative values of these ratios should correspond to the relative reactivity of the individual compounds.
Arey et al.391 measured 12 h ‘daytime’ and ‘night time’ concentrations of LMW PAHs during a photochemical air pollution episode in the Los Angeles Basin. The night time/daytime concentration ratios derived were shown to correlate with the OH radical reaction rate coefficients, for example with the largest ratios being observed for PAHs that are most reactive towards OH radicals. This indicates the occurrence of OH-induced reactions occurring in the atmosphere at similar rates to those predicted in laboratory studies. Similarly, Phousongphouang and Arey171 compared night time/daytime concentration ratios of alkyl-nitronaphthalenes measured in ambient samples to their calculated rate coefficients for the gas phase reaction of OH radicals with alkyl-naphthalenes and observed a reasonable linear correlation with OH rate coefficients, supporting the expectation that OH reactions are dominating the chemistry of these compounds in the atmosphere.
Reisen and Arey371 investigated diurnal variations of PAH and nitro-PAH levels to assess atmospheric reactivity by sampling over four time periods (morning, day, evening and night) in California, USA. It was shown that, in summer, PAH concentrations clearly decrease during the day and evening periods. This could be indicative of PAH loss due to atmospheric reactions with OH and the more reactive compounds were shown to decrease the most.371 This ‘reactive loss’ was shown to be more significant in summer compared to winter.
Tsapakis and Stephanou377 studied the diurnal pattern of nitro-PAH as well as PAH, OH radicals and O3 at a background site in the eastern Mediterranean. The authors suggested that the diurnal pattern of PAHs was dominated by the input of local sources (volatilization from the sea in this case). 2N-Pyr and 2N-Flt were the most abundant nitro-PAHs identified and displayed a well-defined diurnal pattern, with a concentration maximum occurring at midday followed by a rapid decrease. This pattern closely matched the diurnal variation of OH radicals, suggesting that OH radical-initiated reactions are the dominant processes controlling the levels of these nitro-PAHs in the atmosphere. The subsequent rapid decrease in nitro-PAH concentration after the midday maximum was attributed to photolytic loss of nitro-PAH compounds.
Hien et al.367 measured concentrations of 1N-Pyr and 2N-Flt in Ho Chi Minh City, Vietnam during both daytime and night time hours in residential and high traffic locations. They observed lower levels of both compounds during daylight hours in the residential area. The higher levels of 1N-Pyr during the night were attributed to photodecomposition of 1N-Pyr during the day, while higher levels of 2N-Flt during the night were suggested to be due to atmospheric formation from NO3-induced reactions. In contrast, levels of 2N-Flt at the high traffic location were higher during the daytime, suggesting the importance of OH-radical induced reactions at these locations.
5.3. Quantitative predictions and atmospheric trajectory studies
A number of studies have attempted to make quantitative assessments of PAH reactivity in the atmosphere. These investigations can simply involve relating observed concentrations from sampling studies to laboratory reaction kinetics data and either comparing observed levels to those predicted theoretically or using measured concentration values to calculate a formation yield that can be related to observed laboratory studies. A number of studies have attempted to quantify the relative level of PAH-derivative compounds in the atmosphere originating from secondary input from photochemical reactions. This has been attempted by carrying out a sampling study along a specific air-mass trajectory with increasing distance from the source region towards a receptor site.Arey et al.392 initially predicted concentrations of 1/2N-Nap, 2N-Flt and 2N-Pyr, based on calculations using laboratory-derived OH reaction rate coefficients and nitro-PAH formation yields, measured parent PAH concentrations and incorporating photolytic loss of nitro-PAHs.180 It was shown that there was a remarkably good agreement between the calculated values and those measured in the ambient atmosphere, suggesting the dominant input of these compounds from atmospheric reactions of parent PAHs compared to direct emissions.
More recently, as discussed by Atkinson and Arey151 (and references therein), based on observed levels of 1- and 2-NNs in ambient sampling studies, the formation yields of the OH + naphthalene reaction were estimated using the [nitro-nap]/[nap] ratios, OH reaction rate coefficient and photolysis rate coefficient values from the literature and estimated average OH radical concentrations. It was shown that the calculated values for the formation yields of 1N-Nap and 2N-Nap were reasonably consistent with experimental data,182,363 providing further evidence that PAH reactions with OH radicals and further reaction with NO2 occur significantly in the ambient atmosphere.
The predicted PQu formation rates calculated by Wang et al.221 (see Section 3) are significant, compared to observed levels in ambient sampling studies (see Table S1, ESI†), suggesting that atmospheric formation may be a significant contributor to the observed levels in the atmosphere. Eiguren-Fernandez et al.390 investigated the changes in PQ concentration with decreasing distance from the highly polluted Los Angeles basin, following a prevailing wind trajectory towards a more remote downwind receptor site. A significant increase in PQu concentration was observed as the air parcel moved along this trajectory, suggesting the occurrence of photochemical reactions contributing to the observed levels of PQu.
Eiguren-Fernandez et al.390 investigated the correlations of PQu concentrations to those of phenanthrene in the particulate phase, Phe(p) and the vapour phase, Phe(v). It was shown that in the source region, there was a good correlation between PQu and Phe(p), indicative of direct emissions dominating, while at the downwind locations, there was a good correlation between PQu and Phe(v), suggesting the dominance of atmospheric reactions as the source of PQu in these locations. Eiguren-Fernandez et al.390 also estimated the percentage contribution of atmospheric transformations to the observed levels of PQu at the downwind site, based upon ratios of benzo[ghi]perylene (a marker for vehicular emissions) to PQu at the source region and downwind sites (see Eiguren-Fernandez et al.390 for details). It was estimated that ∼90% of PQu measured in the Los Angeles basin was of secondary origin from photochemical reactions during atmospheric transport.
Kojima et al.393 measured the concentrations of PAHs, oxy-PAHs and nitro-PAHs at a road-side location (A) and at sites 90 m (B) and 170 m (C) away from the roadside. Concentrations of PAHs and 1N-Pyr followed the order A > B > C (A:C ratio = 0.20–0.53 and 0.20–0.26 respectively) indicating that direct input from the traffic source and dilution with increasing distance from the road controlled their concentration. Oxy-PAH concentrations also decreased with increasing distance from the roadside, although not as significantly as PAHs and 1N-Pyr (A:C ratio = 0.42–0.69). This would suggest that their atmospheric concentrations are influenced by traffic emissions but also by an additional background source affecting all sites similarly.
In contrast, the concentration of 2N-Flt was approximately the same at all three sites (A:C ratio = 0.88–1.03), indicating the occurrence of input from atmospheric reactions. The authors attempted to quantify the contribution of atmospheric formation to the levels of oxy-PAHs, modifying the calculations used by Eiguren-Fernandez et al.390 and based on the oxy-PAH and PAH concentrations at sites A and C. Their results indicated that percentage contribution of atmospheric formation at the downwind site ranged from 9% to 72% depending on the compound and season, with a higher secondary input contribution generally noted in summer. It was also noted that the percentage of secondary input followed the order 1,8-NtA > 9-Flr and 9,10-AQu > BA with values of >50% for 1,8-NtA, 9-Flr and 9,10-AQu in both summer and winter.
These findings therefore indicate that a considerable fraction of oxy-PAHs detected in atmospheric particulate matter in urban areas will originate from atmospheric reactions of primary PAH. However, the authors note that these calculations are sometimes inadequate and may not be applicable under all environmental conditions. The amount of oxy-PAH in the atmosphere and the relative importance of atmospheric reactions versus primary emissions will also be dependent on a number of other factors including the emission rates of PAH and oxy-PAH, meteorological factors such as mixing layer height, wind speed and direction, which influence dilution levels, and the degree of gas–particle partitioning of both PAH and oxy-PAH.393
5.4. Emission reduction related studies
Urban air quality has been and will increasingly be deteriorating on most continents394 and related limit or recommended values are often exceeded, even today. For example, in Europe, this has involved setting country-specific emission mitigation targets such as those set by the National Emission Ceiling Directive (2001/81/EC).395The implementation of strict measures in certain areas to reduce emissions, either on a long-term or short-term period, provides an opportunity to investigate the impacts of these measures on the levels of oxy- and nitro-PAH compounds and to investigate the relative contribution of primary and secondary sources. To date, however, few investigations have addressed this area of research.
Kojima et al.387 investigated the impact of government regulation regarding emissions from diesel vehicles on the levels of PAHs and nitro-PAHs, in Tokyo. The emission reduction measures in this case involved a 2003 regulation, enforcing the use of lower-emission vehicles or installation of PM reduction devices. Comparison of ambient PM samples taken in 1997–1998 and 2006–2007 revealed a significant decrease in the average annual concentrations of PAHs and 1-NP over this period, attributed to the reduction in primary vehicular emissions. In contrast, no decrease in concentration was noted for 2N-Flt and 2N-Pyr suggesting the importance of other inputs such as atmospheric reactions to influence the levels of these compounds.
During the 2008 Olympic Games, efforts were made to improve the air quality in Beijing by implementing restrictions on direct emissions from sources such as vehicular traffic, construction sites and coal-fired power plants.396,397 This resulted in significant decrease in the levels of primary traffic-related pollutants such as CO and NO2 during this source reduction period.396 Reductions in concentrations were also noted for a number of nitro-PAH and oxy-PAH compounds ranging from 15.1% to 56.6% and 24.8% to 46.6% respectively.397
The mean 2N-Flt/1N-Pyr value of 25–46 measured over the source control and non-source control periods indicates the dominance of photochemical reactions over this time. However, this ratio was shown to decrease during the source control period, which was attributed to the prevailing meteorological conditions and the decreased traffic emissions during this time.397 The relatively low 2N-Flt/2N-Pyr ratio of 3.4–4.8 calculated over this period suggested the dominance of daytime OH-initiated reactions.
It is evident that air monitoring studies in urban areas carried out before and after the implementation of pollution control measures have the potential to generate interesting observations regarding the differences in primary and secondary inputs of PAH-derivative compounds. More extensive work in this area in different urban locations and for a wider range of compounds is clearly needed.
5.5. Conclusions and recommendations for future work
Field data suggest that gas phase reactions of PAHs with OH (and NO3) radicals can contribute significantly to the observed levels of nitro- and oxy-PAHs – although for many atmospherically relevant parent PAHs this chemistry is still unknown. The mechanisms should be explored in order to identify precursors and sources, needed for emission mitigation.(i) Compounds with multiple origins. Assessment of the relative primary and secondary inputs of PAH-derivatives in a large number of the studies discussed in this section has focussed on marker compounds for either direct emissions (e.g. 1N-Pyr) or atmospheric reactions (e.g. 2N-Flt, 2N-Pyr). While this provides a tentative analysis for the relative contributions of OH- and/or NO3-initiated reactions, this approach will lead to definitive conclusion regarding source apportionment for only these specific compounds.
As can be seen in Tables S1 and S2 (ESI†), a large number of oxy- and nitro-PAH compounds identified in ambient air can result from both direct emissions and atmospheric reactions. This makes the task of assessing and potentially of quantifying the relative importance of their sources considerably more difficult. Among the wide range of PAH-derivative compounds in the atmosphere, sources in that sense have only been investigated for PQu and NM-Naps.
(ii) The role of heterogeneous PAH reactions. Heterogeneous PAH reactions play an important role in determining the levels of PAH derivative compounds in the atmosphere, but so far the kinetics data and reaction products have been elucidated with the focus on gas phase processes. Heterogeneous PAH reactions are influenced by a wide range of factors in addition to those associated with gas phase systems. Furthermore, partitioning between gas and particulate phases of both parent PAHs and derivatives is subject to ambient conditions (temperature, PM composition) and its determination is subject to artefacts (due to heterogeneous PAH chemistry on sampling media; Section 3.1.1).
To assess exposure towards these pollutants, there is also a need to study the chemical sinks, i.e. kinetics and reaction products of the PAH derivatives in the atmosphere.
Abbreviations
| Ace | Acenaphthene |
| Acy | Acenaphthylene |
| AcP | Acepyrene |
| Ant | Anthracene |
| AQu | Anthraquinone |
| BaA | Benzo[a]anthracene |
| BaP | Benzo[a]pyrene |
| BbF | Benzo[b]fluoranthene |
| BeP | Benzo[e]pyrene |
| BgF | Benzo[ghi]fluoranthene |
| BgP | Benzo[ghi]perylene |
| BkF | Benzo[k]fluoranthene |
| Chr | Chrysene |
| Cor | Coronene |
| DBA | Dibenzo[a,h]anthracene |
| DBaeP | Dibenzo[a,e]pyrene |
| DBahP | Dibenzo[a,h]pyrene |
| DBalP | Dibenzo[a,l]pyrene |
| DM-Nap | Dimethylnaphthalene |
| DM-Phe | Dimethylphenanthrene |
| E-Nap | Ethylnaphthalene |
| Flt | Fluoranthene |
| Fln | Fluorene |
| Flr | Fluorenone |
| FCA | Formycinnamaldehyde |
| IPy | Indeno[1,2,3-cd]pyrene |
| M-Nap | Methylnaphthalene |
| M-Phe | Methylphenanthrene |
| NQu | Naphthoquinone |
| NtA | Naphthalic anhydride |
| N-Nap | Nitronaphthalene |
| Phe | Phenanthrene |
| PQu | Phenanthrequinone |
| Per | Perylene |
| Pyr | Pyrene |
| TPh | Triphenylene |
References
- B. J. Finlayson-Pitts and J. N. Pitts, Chemistry of the upper and lower atmosphere, Academic Press, San Diego, USA, 2000 Search PubMed.
- J. M. Delgado-Saborit, C. Stark and R. M. Harrison, Environ. Int., 2011, 37, 383–392 CrossRef CAS PubMed.
- M. J. Wenborn, P. J. Coleman, N. R. Passant, E. Lymberidi, J. Sully and R. A. Weir, AEAT-3512/REMC/20459131/Issue 1, 1999.
- WHO, Air quality guidelines, Global update 2005, World Health Organisation, Bonn, 2006.
- European Union, Directive 2004/107/EC of the European Parliament and of the Council of 15 December 2004 23 relating to arsenic, cadmium, mercury, nickel and polycyclic aromatic hydrocarbons in ambient air, Official Journal 24 of the European Union, L23, 3–16, 2005.
- EPAQS, A recommendation for a united kingdom air quality standard for polycyclic aromatic hydrocarbons, Department of the Environment, 1999.
- R. M. Harrison, D. J. T. Smith and A. J. Kibble, Occup. Environ. Med., 2004, 61, 799–805 CrossRef CAS PubMed.
- A. J. Cohen, Environ. Health Perspect., 2000, 108, 743–750 CAS.
- K. B. Okona-Mensah, J. Battershill, A. Boobis and R. Fielder, Food Chem. Toxicol., 2005, 43, 1103–1116 CrossRef CAS PubMed.
- G. Lammel, J. Novák, L. Landlová, A. Dvorská, J. Klánová, P. Čupr, J. Kohoutek, E. Reimer and L. Škrdlíková, in Urban Airborne Particulate Matter: Origins, Chemistry, Fate and Health Impacts, ed. F. Zereini and C. L. S. Wiseman, Springer, Berlin, 2010, pp. 39–62 Search PubMed.
- T. Enya, H. Suzuki, T. Watanabe, T. Hirayama and Y. Hisamatsu, Environ. Sci. Technol., 1997, 31, 2772–2776 CrossRef CAS.
- T. Nielsen, A. Feilberg and M. L. Binderup, Environ. Sci. Pollut. Res., 1999, 6, 133–137 CrossRef CAS PubMed.
- A. Feilberg, T. Nielsen, M. L. Binderup, H. Skov and M. W. B. Poulsen, Atmos. Environ., 2002, 36, 4617–4625 CrossRef CAS.
- UNECE, United Nations Economic Commission for Europe, Convention on Long-range Transboundary Air Pollution, Protocol on Persistent Organic Pollutants, Arhus, Denmark, 1998.
- OSPAR, Oslo Paris Commission, Quality status report 2000, Chemistry, London, ch. 4, 2000, p. 108.
- EMEP, Measurement data online, European Monitoring and Evaluation Programme, Geneva, 43, http://www.nilu.no/projects/ccc/emepdata.html, 2011.
- IADN, Integrated Atmospheric Deposition Network, http://www.ec.gc.ca/rs-23 mn/default.asp?lang=En&n=BFE9D3A3-1, accessed 2.2.2012, 2011.
- USEPA, 2007 US Environmental Protection Agency. EPI Suite v4.0, Exposure assessment tools and models, http://www.epa.gov/opt/exposure/pubs/episuite, 2007.
- Y.-G. Ma, Y. D. Lei, H. Xiao, F. Wania and W.-H. Wang, J. Chem. Eng. Data, 2010, 55, 819–825 CrossRef CAS.
- T. E. M. ten Hulscher, L. E. van der Velde and W. A. Bruggeman, Environ. Toxicol. Chem., 1992, 11, 1595–1603 CrossRef CAS.
- Y. D. Lei, R. Chankalal, A. Chan and F. Wania, J. Chem. Eng. Data, 2002, 47, 801–806 CrossRef CAS.
- M. Odabasi, E. Cetin and A. Sofuoglu, Atmos. Environ., 2006, 40, 6615–6625 CrossRef CAS PubMed.
- M. F. Simcik, T. P. Franz, H. X. Zhang and S. J. Eisenreich, Environ. Sci. Technol., 1998, 32, 251–257 CrossRef CAS.
- M. Mandalakis, M. Tsapakis, A. Tsoga and E. G. Stephanou, Atmos. Environ., 2002, 36, 4023–4035 CrossRef CAS.
- M. Tsapakis and E. G. Stephanou, Environ. Pollut., 2005, 133, 147–156 CrossRef CAS PubMed.
- X. Ding, X.-M. Wang, Z.-Q. Xie, C.-H. Xiang, B.-X. Mai, L.-G. Sun, M. Zheng, G.-Y. Sheng, J.-M. Fu and U. Poeschl, Atmos. Environ., 2007, 41, 2061–2072 CrossRef CAS PubMed.
- J. He and R. Balasubramanian, Atmos. Environ., 2009, 43, 4375–4383 CrossRef CAS PubMed.
- E. Demircioglu, A. Sofuoglu and M. Odabasi, J. Hazard. Mater., 2011, 186, 328–335 CrossRef CAS PubMed.
- G. Spindler, T. Gnauk, A. Gruener, Y. Iinuma, K. Mueller, S. Scheinhardt and H. Herrmann, J. Atmos. Chem., 2012, 69, 127–157 CrossRef CAS.
- J. Paasivirta, S. Sinkkonen, P. Mikkelson, T. Rantio and F. Wania, Chemosphere, 1999, 39, 811–832 CrossRef CAS.
- Y. Zhang and S. Tao, Atmos. Environ., 2009, 43, 812–819 CrossRef CAS PubMed.
- T. Gocht, J. A. C. Barth, M. Epp, M. Jochmann, M. Blessing, T. C. Schmidt and P. Grathwohl, Appl. Geochem., 2007, 22, 2652–2663 CrossRef CAS PubMed.
- EEA, EMEP/EEA air pollutant emission inventory guidebook, European Environment Agency, Technical 28 Report No. 9/2009, Copenhagen, 2009.
- S. S. Xu, W. X. Liu and S. Tao, Environ. Sci. Technol., 2006, 40, 702–708 CrossRef CAS.
- A. Gusev, S. Dutchak, O. Rozovskaya, V. Shatalov, V. Sokovyh, N. Vulykh, W. Aas and K. Breivik, Persistent Organic Pollutants in the Environment. EMEP Status Report 3/2011, Meteorological Synthesizing 38 Centre - East, Moscow, Russian Federation, 2011, p. 108.
- G. Lammel, A. M. Sehili, T. C. Bond, J. Feichter and H. Grassl, Chemosphere, 2009, 76, 98–106 CrossRef CAS PubMed.
- J. Münch, F. Axenfeld, Historic emission data base of selected organic pollutants (POPs) in Europe (1970-42 95)-PCDD/F, B(a)P, PCB, g-HCH, HCB, DDE/DDT. Report to the European Commission (DG XII), 43 Environment and Climate Project No. ENV-CT96-0214, 1999.
- I. Bewersdorff, A. Aulinger, V. Matthias and M. Quante, Meteorol. Z., 2009, 18, 41–53 CrossRef.
- USEPA, U.S. Environmental Protection Agency. Locating and estimating air emissions from sources of 2 polycyclic organic matter. EPA-454/R-98-014. Office of Air Quality Planning and Standards, Research Triangle 3 Park, NC, USA, 1998.
- J. M. Pacyna, K. Breivik, J. Munch and J. Fudala, Atmos. Environ., 2003, 37, S119–S131 CrossRef CAS.
- H. Denier van der Gon, M. van het Bolscher, A. Visschedijk and P. Zandveld, Atmos. Environ., 2007, 41, 9245–9261 CrossRef CAS PubMed.
- A. L. Robinson, R. Subramanian, N. M. Donahue, A. Bernardo-Bricker and W. F. Rogge, Environ. Sci. Technol., 2006, 40, 7803–7810 CrossRef CAS.
- E. Galarneau, Atmos. Environ., 2008, 42, 8139–8149 CrossRef CAS PubMed.
- M. Blumer, Sci. Am., 1976, 234, 35–45 CrossRef CAS PubMed.
- B. R. T. Simoneit, Int. J. Environ. Anal. Chem., 1985, 22, 203–233 CrossRef CAS.
- M. B. Yunker, R. W. Macdonald, R. Vingarzan, R. H. Mitchell, D. Goyette and S. Sylvestre, Org. Geochem., 2002, 33, 489–515 CrossRef CAS.
- A. Dvorská, G. Lammel and J. Klánová, Atmos. Environ., 2011, 45, 420–427 CrossRef PubMed.
- M. Tobiszewski and J. Namiesnik, Environ. Pollut., 2012, 162, 110–119 CrossRef CAS PubMed.
- A. Dvorská, K. Komprdová, G. Lammel, J. Klánová and H. Plachá, Atmos. Environ., 2012, 46, 147–154 CrossRef PubMed.
- B. R. T. Simoneit, J. J. Schauer, C. G. Nolte, D. R. Oros, V. O. Elias, M. P. Fraser, W. F. Rogge and G. R. Cass, Atmos. Environ., 1999, 33, 173–182 CrossRef CAS.
- J. J. Schauer, W. F. Rogge, L. M. Hildemann, M. A. Mazurek, G. R. Cass and B. R. T. Simoneit, Atmos. Environ., 1996, 30, 3837–3855 CrossRef CAS.
- D. R. Oros and B. R. T. Simoneit, Fuel, 2000, 79, 515–536 CrossRef CAS.
- T. Nielsen, Atmos. Environ., 1988, 22, 2249–2254 CrossRef CAS.
- F. Böhme, K. Welsch-Pausch and M. S. McLachlan, Environ. Sci. Technol., 1999, 33, 1805–1813 CrossRef.
- M. S. McLachlan, Environ. Sci. Technol., 1999, 33, 1799–1804 CrossRef CAS.
- S. D. Choi, R. M. Staebler, H. Li, Y. Su, B. Gevao, T. Harner and F. Wania, Atmos. Chem. Phys., 2008, 8, 4105–4113 CrossRef CAS.
- A. D. St-Amand, P. M. Mayer and J. M. Blais, Atmos. Environ., 2009, 43, 4283–4288 CrossRef CAS PubMed.
- I. T. Cousins and K. C. Jones, Environ. Pollut., 1998, 102, 105–118 CrossRef CAS.
- W. Wilcke, J. Plant Nutr. Soil Sci., 2000, 163, 229–248 CrossRef CAS.
- A. J. Sweetman, M. Dalla Valle, K. Prevedouros and K. C. Jones, Chemosphere, 2005, 60, 959–972 CrossRef CAS PubMed.
- G. L. Daly, Y. D. Lei, L. E. Castillo, D. C. G. Muir and F. Wania, Atmos. Environ., 2007, 41, 7339–7350 CrossRef CAS PubMed.
- R. Wang, S. Tao, B. Wang, Y. Yang, C. Lang, Y. Zhang, J. Hu, J. Ma and H. Hung, Environ. Sci. Technol., 2010, 44, 1017–1022 CrossRef CAS PubMed.
- R. M. Dickhut and K. E. Gustafson, Environ. Sci. Technol., 1995, 29, 1518–1525 CrossRef CAS PubMed.
- M. Odabasi, A. Sofuoglu, N. Vardar, Y. Tasdemir and T. M. Holsen, Environ. Sci. Technol., 1999, 33, 426–434 CrossRef CAS.
- R. Balasubramanian and J. He, Fate and transfer of persistent organic pollutants in a multi-media environment, in Urban Airborne Particulate Matter: Origins, Chemistry, Fate and Health Impacts, ed. F. Zereini and C. L. S. Wiseman, Springer, Heidelberg, 2010, pp. 277–307 Search PubMed.
- J. Komprda, K. Kubosová, A. Dvorská, M. Scheringer, J. Klánová and I. Holoubek, J. Environ. Monit., 2009, 11, 269–276 RSC.
- D. M. Farmer, C. L. McNeil and B. D. Johnson, Nature, 1993, 361, 620–623 CrossRef.
- J. DeWulf, H. Van Langenhove and B. Heireman, Water Res., 1998, 32, 2106–2112 CrossRef CAS.
- L. Lim, O. Wurl, S. Karuppiah and J. P. Obbard, Mar. Pollut. Bull., 2007, 54, 1212–1219 CrossRef CAS PubMed.
- C. Guitart, N. Garcia-Flor, J. C. Miquel, S. W. Fowler and J. Albaiges, J. Marine Syst., 2010, 79, 210–217 CrossRef PubMed.
- A. Eschenbach, M. Kastner, R. Bierl, G. Schaefer and B. Mahro, Chemosphere, 1994, 28, 683–692 CrossRef CAS.
- P. B. Hatzinger and M. Alexander, Environ. Sci. Technol., 1995, 29, 537–545 CrossRef CAS PubMed.
- J. J. H. Haftka, H. A. J. Govers and J. R. Parsons, Environ. Sci. Pollut. Res., 2010, 17, 1070–1079 CrossRef CAS PubMed.
- P. Lehnik-Habrink, S. Hein, T. Win, W. Bremser and I. Nehls, J. Soils Sediments, 2010, 10, 1487–1498 CrossRef CAS PubMed.
- Y. Yang, N. Zhang, M. Xue and S. Tao, Environ. Pollut., 2010, 158, 2170–2174 CrossRef CAS PubMed.
- R. M. Allen-King, P. Grathwohl and W. P. Ball, Adv. Water Resour., 2002, 25, 985–1016 CrossRef CAS.
- S. Ribes, B. van Drooge, J. Dachs, O. Gustafsson and J. O. Grimalt, Environ. Sci. Technol., 2003, 37, 2675–2680 CrossRef CAS.
- M. Obst, P. Grathwohl, A. Kappler, O. Eibl, N. Peranio and T. Gocht, Environ. Sci. Technol., 2011, 45, 7314–7322 CrossRef CAS PubMed.
- S. Endo, P. Grathwohl, S. B. Haderlein and T. C. Schmidt, Environ. Sci. Technol., 2009, 43, 3094–3100 CrossRef CAS.
- B. Pan, S. Tao, D. Wu, D. Zhang, H. Peng and B. Xing, Chemosphere, 2011, 84, 1578–1583 CrossRef CAS PubMed.
- G. E. Schaumann, J. Plant Nutr. Soil Sci., 2006, 169, 145–156 CrossRef CAS.
- Y. Yang, N. Zhang, M. Xue, S. T. Lu and S. Tao, Environ. Pollut., 2011, 159, 591–595 CrossRef CAS PubMed.
- E. Brorstrom, P. Grennfelt and A. Lindskog, Atmos. Environ., 1983, 17, 601–605 CrossRef.
- M. Carrara, J. C. Wolf and R. Niessner, Atmos. Environ., 2010, 44, 3878–3885 CrossRef CAS PubMed.
- M. Goriaux, B. Jourdain, B. Temime, J. L. Besombes, N. Marchand, A. Albinet, E. Leoz-Garziandia and H. Wortham, Environ. Sci. Technol., 2006, 40, 6398–6404 CrossRef CAS.
- I. G. Kavouras, J. Lawrence, P. Koutrakis, E. G. Stephanou and P. Oyola, Atmos. Environ., 1999, 33, 4977–4986 CrossRef CAS.
- M. Possanzini, A. Febo and A. Liberti, Atmos. Environ., 1983, 17, 2605–2610 CrossRef CAS.
- C. Schauer, R. Niessner and U. Poschl, Environ. Sci. Technol., 2003, 37, 2861–2868 CrossRef CAS.
- M. Tsapakis and E. G. Stephanou, Atmos. Environ., 2003, 37, 4935–4944 CrossRef CAS PubMed.
- C. E. Junge, Basic considerations about trace constituents in the atmosphere as related to the fate of global 16 pollutants, in Fate of Pollutants in the Air and Water Environments, Part I, ed. I. H. Suffet, Wiley, New York, 1977, vol. 17, pp. 7–26 Search PubMed.
- J. F. Pankow, Atmos. Environ., 1987, 21, 2275–2283 CrossRef CAS.
- J. F. Pankow and T. F. Bidleman, Atmos. Environ., Part A, 1992, 26, 1071–1080 CrossRef.
- K. U. Goss and R. P. Schwarzenbach, Environ. Sci. Technol., 1998, 32, 2025–2032 CrossRef CAS.
- H. Yamasaki, K. Kuwata and H. Miyamoto, Environ. Sci. Technol., 1982, 16, 189–194 CrossRef CAS.
- J. F. Pankow, L. M. Isabelle, D. A. Buchholz, W. T. Luo and B. D. Reeves, Environ. Sci. Technol., 1994, 28, 363–363 CrossRef CAS PubMed.
- E. Galarneau, T. F. Bidleman and P. Blanchard, Atmos. Environ., 2006, 40, 182–197 CrossRef CAS PubMed.
- K. E. Gustafson and R. M. Dickhut, Environ. Sci. Technol., 1997, 31, 140–147 CrossRef CAS.
- V. Subramanyam, K. T. Valsaraj, L. J. Thibodeaux and D. D. Reible, Atmos. Environ., 1994, 28, 3083–3091 CrossRef CAS.
- S. Ozcan and M. E. Aydin, Atmos. Res., 2009, 93, 715–722 CrossRef CAS PubMed.
- K. Ravindra, L. Bencs, E. Wauters, J. de Hoog, F. Deutsch, E. Roekens, N. Bleux, P. Berghmans and R. Van Grieken, Atmos. Environ., 2006, 40, 771–785 CrossRef CAS PubMed.
- A. Finizio, D. Mackay, T. Bidleman and T. Harner, Atmos. Environ., 1997, 31, 2289–2296 CrossRef CAS.
- J. Dachs and S. J. Eisenreich, Environ. Sci. Technol., 2000, 34, 3690–3697 CrossRef CAS.
- R. Lohmann and G. Lammel, Environ. Sci. Technol., 2004, 38, 3793–3803 CrossRef CAS.
- M. T. O. Jonker and A. A. Koelmans, Environ. Sci. Technol., 2002, 36, 3725–3734 CrossRef CAS.
- B. T. Mader and J. F. Pankow, Environ. Sci. Technol., 2002, 36, 5218–5228 CrossRef CAS.
- S. Pongpiachan, K. Thamanu, K. F. Ho, S. C. Lee and P. Sompongchaiyakul, Southeast Asian J. Trop. Med. Public Health, 2009, 40, 1377–1394 CAS.
- G. Lammel, J. Klánová, P. Ilić, J. Kohoutek, B. Gasić, I. Kovacić and L. Škrdlíková, Atmos. Environ., 2010, 44, 5022–5027 CrossRef CAS PubMed.
- K. U. Goss and R. P. Schwarzenbach, Environ. Sci. Technol., 2001, 35, 1–9 CrossRef CAS.
- M. H. Abraham, J. Chromatogr., 1993, 644, 95–139 CrossRef CAS.
- S. N. Atapattu and C. F. Poole, J. Chromatogr., A, 2008, 1195, 136–145 CrossRef CAS PubMed.
- C. M. Roth, K. U. Goss and R. P. Schwarzenbach, Environ. Sci. Technol., 2005, 39, 6638–6643 CrossRef CAS.
- K. U. Goss, Crit. Rev. Environ. Sci. Technol., 2004, 34, 339–389 CrossRef CAS.
- J. A. L. Cancio, A. V. Castellano, S. S. Martin and J. F. S. Rodriguez, Water, Air, Soil Pollut., 2004, 154, 127–138 CrossRef.
- L. P. Chrysikou, P. G. Gemenetzis and C. A. Samara, Atmos. Environ., 2009, 43, 290–300 CrossRef CAS PubMed.
- G. Kiss, Z. Varga-Puchony and Z. Hlavaj, Distribution of polycyclic aromatic hydrocarbons on atmospheric aerosol particles of different size, in Nucleation and Atmospheric Aerosols, ed. M. Kulmala and P. O. Wagner, Elsevier, Kidlington, 1996, pp. 501–503 Search PubMed.
- J. Schnelle, T. Jänsch, K. Wolf, I. Gebefugi and A. Kettrup, Chemosphere, 1995, 31, 3119–3127 CrossRef CAS.
- C. Venkataraman and S. K. Friedlander, Environ. Sci. Technol., 1994, 28, 563–572 CrossRef CAS PubMed.
- Y. Kawanaka, Y. Tsuchiya, S.-J. Yun and K. Sakamoto, Environ. Sci. Technol., 2009, 43, 6851–6856 CrossRef CAS.
- Y. Kameda, J. Shirai, T. Komai, J. Nakanishi and S. Masunaga, Sci. Total Environ., 2005, 340, 71–80 CrossRef CAS PubMed.
- A. H. Miguel, T. W. Kirchstetter, R. A. Harley and S. V. Hering, Environ. Sci. Technol., 1998, 32, 450–455 CrossRef CAS.
- L. Skrdlikova, L. Landlova, J. Klanova and G. Lammel, Atmos. Environ., 2011, 45, 4305–4312 CrossRef CAS PubMed.
- T. F. Bidleman, Environ. Sci. Technol., 1988, 22, 361–367 CrossRef CAS.
- T. Gocht, O. Klemm and P. Grathwohl, Atmos. Environ., 2007, 41, 1315–1327 CrossRef CAS PubMed.
- T. P. Franz and S. J. Eisenreich, Environ. Sci. Technol., 1998, 32, 1771–1778 CrossRef CAS.
- Y. Tasdemir and F. Esen, Atmos. Environ., 2007, 41, 1288–1301 CrossRef CAS PubMed.
- M. P. Ligocki, C. Leuenberger and J. F. Pankow, Atmos. Environ., 1985, 19, 1609–1617 CrossRef CAS.
- S. K. Sahu, G. G. Pandit and S. Sadasivan, Sci. Total Environ., 2004, 318, 245–249 CrossRef CAS.
- M. F. Simcik, Atmos. Environ., 2004, 38, 491–501 CrossRef CAS PubMed.
- W. G. N. Slinn, L. Hasse, B. B. Hicks, A. W. Hogan, D. Lal, P. S. Liss, K. O. Munnich, G. A. Sehmel and O. Vittori, Atmos. Environ., 1978, 12, 2055–2087 CrossRef CAS.
- M. P. Ligocki, C. Leuenberger and J. F. Pankow, Atmos. Environ., 1985, 19, 1619–1626 CrossRef CAS.
- J. H. Offenberg and J. E. Baker, Environ. Sci. Technol., 2002, 36, 3763–3771 CrossRef CAS.
- J. T. Hoff, F. Wania, D. Mackay and R. Gillham, Environ. Sci. Technol., 1995, 29, 1982–1989 CrossRef CAS PubMed.
- F. Wania, D. Mackay and J. T. Hoff, Environ. Sci. Technol., 1999, 33, 195–197 CrossRef CAS.
- A. Albinet, E. Leoz-Garziandia, H. Budzinski and E. ViIlenave, Sci. Total Environ., 2007, 384, 280–292 CrossRef CAS PubMed.
- R. Atkinson and J. Arey, Environ. Health Perspect., 1994, 102, 117–126 CAS.
- F. Wania and D. Mackay, Environ. Sci. Technol., 1996, 30, A390–A396 CrossRef PubMed.
- S. C. Zhang, W. Zhang, K. Y. Wang, Y. T. Shen, L. W. Hu and X. J. Wang, Environ. Monit. Assess., 2009, 151, 197–207 CrossRef CAS PubMed.
- A. Birgul, Y. Tasdemir and S. S. Cindoruk, Atmos. Res., 2011, 101, 341–353 CrossRef PubMed.
- E. Terzi and C. Samara, Atmos. Environ., 2005, 39, 6261–6270 CrossRef CAS PubMed.
- W. W. Brubaker and R. A. Hites, J. Phys. Chem. A, 1998, 102, 915–921 CrossRef CAS.
- J. N. Pitts, Atmos. Environ., 1987, 21, 2531–2547 CrossRef CAS.
- J. Sasaki, J. Arey and W. P. Harger, Environ. Sci. Technol., 1995, 29, 1324–1335 CrossRef CAS PubMed.
- L. Wang, J. Arey and R. Atkinson, Environ. Sci. Technol., 2005, 39, 5302–5310 CrossRef CAS.
- R. Atkinson and S. M. Aschmann, Int. J. Chem. Kinet., 1986, 18, 569–573 CrossRef CAS.
- F. L. Eisele, G. H. Mount, D. Tanner, A. Jefferson, R. Shetter, J. W. Harder and E. J. Williams, J. Geophys. Res.: Atmos., 1997, 102, 6457–6465 CrossRef CAS.
- R. G. Prinn, J. Huang, R. F. Weiss, D. M. Cunnold, P. J. Fraser, P. G. Simmonds, A. McCulloch, P. A. L. Bernard, C. Harth, P. Salameh, S. O'Doherty, R. H. J. Wang, L. Porter and B. R. Miller, Science, 2001, 292, 1882–1888 CrossRef CAS PubMed.
- R. Atkinson, J. Phys. Chem. Ref. Data, Monogr., 1989, 1–246 Search PubMed.
- R. Atkinson and J. Arey, Chem. Rev., 2003, 103, 4605–4638 CrossRef CAS PubMed.
- M. Krol, P. J. van Leeuwen and J. Lelieveld, J. Geophys. Res.: Atmos., 1998, 103, 10697–10711 CrossRef CAS.
- J. H. Seinfeld and S. N. Pandis, Atmospheric Chemistry and Physics, John Wiley & Sons, Inc., 1998, ISBN 0-471-17815-2 Search PubMed.
- R. Atkinson and J. Arey, Polycyclic Aromat. Compd., 2007, 27, 15–40 CrossRef CAS.
- M. Krol and J. Lelieveld, J. Geophys. Res.: Atmos., 2003, 108, 4125 CrossRef.
- R. G. Prinn, J. Huang, R. F. Weiss, D. M. Cunnold, P. J. Fraser, P. G. Simmonds, A. McCulloch, C. Harth, S. Reimann, P. Salameh, S. O'Doherty, R. H. J. Wang, L. W. Porter, B. R. Miller and P. B. Krummel, Geophys. Res. Lett., 2005, 32, L07809 CrossRef.
- X. Qu, Q. Zhang and W. Wang, Chem. Phys. Lett., 2006, 429, 77–85 CrossRef CAS PubMed.
- F. Reisen and J. Arey, Environ. Sci. Technol., 2002, 36, 4302–4311 CrossRef CAS.
- K. Lorenz and R. Zellner, Ber. Bunsenges., 1983, 87, 629–636 CrossRef CAS.
- R. Ananthula, T. Yamada and P. H. Taylor, J. Phys. Chem. A, 2006, 110, 3559–3566 CrossRef CAS PubMed.
- F. Goulay, C. Rebrion-Rowe, J. L. Le Garrec, S. D. Le Picard, A. Canosa and B. R. Rowe, J. Chem. Phys., 2005, 122, 104308 CrossRef CAS PubMed.
- W. Lee, P. S. Stevens and R. A. Hites, J. Phys. Chem. A, 2003, 107, 6603–6608 CrossRef CAS.
- R. Ananthula, T. Yamada and P. H. Taylor, Int. J. Chem. Kinet., 2007, 39, 629–637 CrossRef CAS.
- R. A. Perry, R. Atkinson and J. N. Pitts, J. Phys. Chem., 1977, 81, 296–304 CrossRef CAS.
- R. Atkinson, J. Arey, B. Zielinska and S. M. Aschmann, Environ. Sci. Technol., 1987, 21, 1014–1022 CrossRef CAS PubMed.
- R. Atkinson, J. Arey, B. Zielinska and S. M. Aschmann, Int. J. Chem. Kinet., 1990, 22, 999–1014 CrossRef CAS.
- R. Atkinson, S. M. Aschmann, J. Arey, B. Zielinska and D. Schuetzle, Atmos. Environ., 1989, 23, 2679–2690 CrossRef CAS.
- R. Koch, R. Knispel, M. Elend, M. Siese and C. Zetzsch, Atmos. Chem. Phys., 2007, 7, 2057–2071 CrossRef CAS.
- N. Nishino, R. Atkinson and J. Arey, Environ. Sci. Technol., 2008, 42, 9203–9209 CrossRef CAS.
- A. Ricca and C. W. Bauschlicher, Chem. Phys. Lett., 2000, 328, 396–402 CrossRef CAS.
- R. Atkinson, S. M. Aschmann and J. N. Pitts, Environ. Sci. Technol., 1984, 18, 110–113 CrossRef CAS PubMed.
- H. W. Biermann, H. Mac Leod, R. Atkinson, A. M. Winer and J. N. Pitts, Environ. Sci. Technol., 1985, 19, 244–248 CrossRef CAS PubMed.
- W. Klöpffer, R. Frank, E. G. Kohl and F. Haag, Chem.-Ztg., 1986, 110, 57–61 Search PubMed.
- P. T. Phousongphouang and J. Arey, Environ. Sci. Technol., 2002, 36, 1947–1952 CrossRef CAS.
- A. Klamt, Chemosphere, 1993, 26, 1273–1289 CrossRef CAS.
- R. Atkinson and S. M. Aschmann, Atmos. Environ., 1987, 21, 2323–2326 CrossRef CAS.
- R. Atkinson and S. M. Aschmann, Int. J. Chem. Kinet., 1988, 20, 513–539 CrossRef CAS.
- C. E. Banceu, C. Mihele, D. A. Lane and N. J. Bunce, Polycyclic Aromat. Compd., 2001, 18, 415–425 CrossRef CAS.
- E. S. C. Kwok, W. P. Harger, J. Arey and R. Atkinson, Environ. Sci. Technol., 1994, 28, 521–527 CrossRef CAS PubMed.
- E. S. C. Kwok, R. Atkinson and J. Arey, Int. J. Chem. Kinet., 1997, 29, 299–309 CrossRef CAS.
- D. Helmig, J. Arey, R. Atkinson, W. P. Harger and P. A. McElroy, Atmos. Environ., Part A, 1992, 26, 1735–1745 CrossRef.
- D. Helmig and W. P. Harger, Sci. Total Environ., 1994, 148, 11–21 CrossRef CAS.
- J. Arey, B. Zielinska, R. Atkinson and S. M. Aschmann, Int. J. Chem. Kinet., 1989, 21, 775–799 CrossRef CAS.
- J. Y. Lee and D. A. Lane, Atmos. Environ., 2009, 43, 4886–4893 CrossRef CAS PubMed.
- J. Sasaki, S. M. Aschmann, E. S. C. Kwok, R. Atkinson and J. Arey, Environ. Sci. Technol., 1997, 31, 3173–3179 CrossRef CAS.
- N. J. Bunce, L. Liu, J. Zhu and D. A. Lane, Environ. Sci. Technol., 1997, 31, 2252–2259 CrossRef CAS.
- K. E. Kautzman, J. D. Surratt, M. N. Chan, A. W. H. Chan, S. P. Hersey, P. S. Chhabra, N. F. Dalleska, P. O. Wennberg, R. C. Flagan and J. H. Seinfeld, J. Phys. Chem. A, 2010, 114, 913–934 CrossRef CAS PubMed.
- L. Wang, R. Atkinson and J. Arey, Environ. Sci. Technol., 2007, 41, 2803–2810 CrossRef CAS.
- N. Nishino, J. Arey and R. Atkinson, Environ. Sci. Technol., 2009, 43, 1349–1353 CrossRef CAS.
- J. Lee and D. A. Lane, Atmos. Environ., 2010, 44, 2469–2477 CrossRef CAS PubMed.
- J. Arey, B. Zielinska, R. Atkinson, A. M. Winer, T. Ramdahl and J. N. Pitts, Atmos. Environ., 1986, 20, 2339–2345 CrossRef CAS.
- D. Asaf, D. Pedersen, V. Matveev, M. Peleg, C. Kern, J. Zingler, U. Platt and M. Luria, Environ. Sci. Technol., 2009, 43, 9117–9123 CrossRef CAS PubMed.
- S. S. Brown, W. P. Dube, J. Peischl, T. B. Ryerson, E. Atlas, C. Warneke, J. A. de Gouw, S. T. Hekkert, C. A. Brock, F. Flocke, M. Trainer, D. D. Parrish, F. C. Feshenfeld and A. R. Ravishankara, J. Geophys. Res.: Atmos., 2011, 116, D24305 CrossRef.
- A. Geyer, B. Alicke, S. Konrad, T. Schmitz, J. Stutz and U. Platt, J. Geophys. Res.: Atmos., 2001, 106, 8013–8025 CrossRef CAS.
- U. Platt, G. Lebras, G. Poulet, J. P. Burrows and G. Moortgat, Nature, 1990, 348, 147–149 CrossRef CAS.
- J. M. Roberts, C. J. Hahn, F. C. Fehsenfeld, J. M. Warnock, D. L. Albritton and R. E. Sievers, Environ. Sci. Technol., 1985, 19, 364–369 CrossRef CAS PubMed.
- A. M. Winer, R. Atkinson and J. N. Pitts, Science, 1984, 224, 156–159 CAS.
- C. A. Cantrell, J. A. Davidson, K. L. Busarow and J. G. Calvert, J. Geophys. Res.: Atmos., 1986, 91, 5347–5353 CrossRef CAS.
- C. A. Cantrell, W. R. Stockwell, L. G. Anderson, K. L. Busarow, D. Perner, A. Schmeltekopf, J. G. Calvert and H. S. Johnston, J. Phys. Chem., 1985, 89, 139–146 CrossRef CAS.
- W. R. Stockwell and J. G. Calvert, J. Geophys. Res., C: Oceans Atmos., 1983, 88, 6673–6682 CrossRef CAS.
- W. P. L. Carter, A. M. Winer and J. N. Pitts, Environ. Sci. Technol., 1981, 15, 829–831 CrossRef CAS.
- N. Carslaw, L. J. Carpenter, J. M. C. Plane, B. J. Allan, R. A. Burgess, K. C. Clemitshaw, H. Coe and S. A. Penkett, J. Geophys. Res.: Atmos., 1997, 102, 18917–18933 CrossRef CAS.
- D. Mihelcic, D. Klemp, P. Musgen, H. W. Patz and A. Volzthomas, J. Atmos. Chem., 1993, 16, 313–335 CrossRef CAS.
- A. Geyer, R. Ackermann, R. Dubois, B. Lohrmann, T. Muller and U. Platt, Atmos. Environ., 2001, 35, 3619–3631 CrossRef CAS.
- R. Atkinson and A. C. Lloyd, J. Phys. Chem. Ref. Data, 1984, 13, 315–444 CrossRef CAS.
- R. Atkinson, E. C. Tuazon and J. Arey, Int. J. Chem. Kinet., 1990, 22, 1071–1082 CrossRef CAS.
- R. Atkinson, A. M. Winer and J. N. J. Pitts, Atmos. Environ., 1986, 20, 331–340 CrossRef CAS.
- R. A. Graham and H. S. Johnston, J. Phys. Chem., 1978, 82, 254–268 CrossRef CAS.
- F. Magnotta and H. S. Johnston, Geophys. Res. Lett., 1980, 7, 769–772 CrossRef CAS.
- R. Atkinson, J. Phys. Chem. Ref. Data, Monogr., 1994, 2, 216 Search PubMed.
- M. W. Malko and J. Troe, Int. J. Chem. Kinet., 1982, 14, 399–416 CrossRef CAS.
- T. J. Wallington, R. Atkinson, A. M. Winer and J. N. Pitts, Int. J. Chem. Kinet., 1987, 19, 243–249 CrossRef CAS.
- R. Atkinson, J. Phys. Chem. Ref. Data, 1991, 20, 459–507 CrossRef CAS.
- J. F. Noxon, J. Geophys. Res., C: Oceans Atmos., 1983, 88, 1017–1021 Search PubMed.
- J. N. Pitts, B. Zielinska, J. A. Sweetman, R. Atkinson and A. M. Winer, Atmos. Environ., 1985, 19, 911–915 CrossRef CAS.
- R. Atkinson, E. C. Tuazon, I. Bridier and J. Arey, Int. J. Chem. Kinet., 1994, 26, 605–614 CrossRef CAS.
- P. T. Phousongphouang and J. Arey, Environ. Sci. Technol., 2003, 37, 308–313 CrossRef CAS.
- E. S. C. Kwok, R. Atkinson and J. Arey, Int. J. Chem. Kinet., 1994, 26, 511–525 CrossRef CAS.
- X. G. Qu, Q. Z. Zhang and W. X. Wang, Chem. Phys. Lett., 2006, 432, 40–49 CrossRef CAS PubMed.
- L. Wang, S. M. Aschmann, R. Atkinson and J. Arey, Environ. Sci. Technol., 2009, 43, 2766–2772 CrossRef CAS.
- B. Zielinska, J. Arey, R. Atkinson and P. A. McElroy, Environ. Sci. Technol., 1989, 23, 723–729 CrossRef CAS.
- L. Wang, R. Atkinson and J. Arey, Environ. Sci. Technol., 2010, 44, 2981–2987 CrossRef CAS PubMed.
- B. Zielinska, J. Arey, R. Atkinson, T. Ramdahl, A. M. Winer and J. N. Pitts, J. Am. Chem. Soc., 1986, 108, 4126–4132 CrossRef CAS.
- L. Wang, R. Atkinson and J. Arey, Atmos. Environ., 2007, 41, 2025–2035 CrossRef CAS PubMed.
- M. S. Alam, M. Camredon, A. R. Rickard, T. Carr, K. P. Wyche, K. E. Hornsby, P. S. Monks and W. J. Bloss, Phys. Chem. Chem. Phys., 2011, 13, 11002–11015 RSC.
- R. Atkinson, Atmos. Environ., 2000, 34, 2063–2101 CrossRef CAS.
- U. Schurath and K. H. Naumann, Pure Appl. Chem., 1998, 70, 1353–1361 CrossRef CAS.
- D. Vione, V. Maurino, C. Minero, E. Pelizzetti, M. A. J. Harrison, R. I. Olariu and C. Arsene, Chem. Soc. Rev., 2006, 35, 441–453 CAS.
- G. Andreou and S. Rapsomanikis, J. Hazard. Mater., 2009, 172, 363–373 CrossRef CAS PubMed.
- P. Di Filippo, C. Riccardi, D. Pomata and F. Buiarelli, Atmos. Environ., 2010, 44, 2742–2749 CrossRef CAS PubMed.
- Z. P. Gu, J. L. Feng, W. L. Han, L. Li, M. H. Wu, J. M. Fu and G. Y. Sheng, J. Environ. Sci., 2010, 22, 389–396 CrossRef CAS.
- S. Harrad and L. Laurie, J. Environ. Monit., 2005, 7, 722–727 RSC.
- K. van Cauwenberghe and L. van Vaeck, Mutat. Res., 1983, 116, 1–20 CrossRef CAS.
- L. van Vaeck and K. van Cauwenberghe, Atmos. Environ., 1984, 18, 323–328 CrossRef CAS.
- T. D. Behymer and R. A. Hites, Environ. Sci. Technol., 1988, 22, 1311–1319 CrossRef CAS.
- M. Jang and S. R. McDow, Environ. Sci. Technol., 1995, 29, 2654–2660 CrossRef CAS PubMed.
- M. Jang and S. R. McDow, Environ. Sci. Technol., 1997, 31, 1046–1053 CrossRef CAS.
- R. M. Kamens, Z. Guo, J. N. Fulcher and D. A. Bell, Environ. Sci. Technol., 1988, 22, 103–108 CrossRef CAS PubMed.
- S. R. McDow, M. S. Jang, Y. Hong and R. M. Kamens, J. Geophys. Res.: Atmos., 1996, 101, 19593–19600 CrossRef CAS.
- S. R. McDow, Q. R. Sun, M. Vartiainen, Y. S. Hong, Y. L. Yao, T. Fister, R. Q. Yao and R. M. Kamens, Environ. Sci. Technol., 1994, 28, 2147–2153 CrossRef CAS PubMed.
- S. R. McDow, M. Vartiainen, Q. R. Sun, Y. S. Hong, Y. L. Yao and R. M. Kamens, Atmos. Environ., 1995, 29, 791–797 CrossRef CAS.
- T. D. Behymer and R. A. Hites, Environ. Sci. Technol., 1985, 19, 1004–1006 CrossRef CAS.
- R. Dabestani, K. J. Ellis and M. E. Sigman, J. Photochem. Photobiol., A, 1995, 86, 231–239 CrossRef CAS.
- R. T. Dabestani, J. T. Barbas, K. J. Ellis and M. E. Sigman, Abs. Am. Chem. Soc., 1995, 210, 148-ENVR Search PubMed.
- D. A. Lane and M. Katz, in Fate of Pollutants in the Air and Water Environments, Part 2, ed. A. Suffet, Wiley-Interscience, New York, 1977, pp. 133–154 Search PubMed.
- M. E. Sigman, R. Arce, C. Rayes, J. T. Barbas and R. Dabestani, Abs. Am. Chem. Soc., 1997, 213, 220-ENVR Search PubMed.
- J. T. Barbas, R. Dabestani and M. E. Sigman, J. Photochem. Photobiol., A, 1994, 80, 103–111 CrossRef CAS.
- J. T. Barbas, M. E. Sigman, A. C. Buchanan and E. A. Chevis, Photochem. Photobiol., 1993, 58, 155–158 CrossRef CAS.
- J. T. Barbas, M. E. Sigman and R. Dabestani, Environ. Sci. Technol., 1996, 30, 1776–1780 CrossRef CAS.
- R. A. Yokley, A. A. Garrison, E. L. Wehry and G. Mamantov, Environ. Sci. Technol., 1986, 20, 86–90 CrossRef CAS PubMed.
- W. A. Korfmacher, D. F. S. Natusch, D. R. Taylor, G. Mamantov and E. L. Wehry, Science, 1980, 207, 763–765 CAS.
- T. F. Kahan and D. J. Donaldson, J. Phys. Chem. A, 2007, 111, 1277–1285 CrossRef CAS PubMed.
- T. F. Kahan, R. Zhao, K. B. Jumaa and D. J. Donaldson, Environ. Sci. Technol., 2010, 44, 1302–1306 CrossRef CAS PubMed.
- K. A. van Cauwenberghe, in Handbook of Polycyclic Aromatic Hydrocarbons, ed. A. Bjørseth and T. Ramdahl, Dekker, New York, 1985, pp. 351–384 Search PubMed.
- Y. Bedjanian, M. L. Nguyen and G. Le Bras, Atmos. Environ., 2010, 44, 1754–1760 CrossRef CAS PubMed.
- A. K. Bertram, A. V. Ivanov, M. Hunter, L. T. Molina and M. J. Molina, J. Phys. Chem. A, 2001, 105, 9415–9421 CrossRef CAS.
- W. Estève, H. Budzinski and E. Villenave, Polycyclic Aromat. Compd., 2003, 23, 441–456 CrossRef.
- W. Estève, H. Budzinski and E. Villenave, Atmos. Environ., 2004, 38, 6063–6072 CrossRef PubMed.
- W. Estève, H. Budzinski and E. Villenave, Atmos. Environ., 2006, 40, 201–211 CrossRef PubMed.
- K. Miet, H. Budzinski and E. Villenave, Polycyclic Aromat. Compd., 2009, 29, 267–281 CrossRef CAS.
- J. Ringuet, A. Albinet, E. Leoz-Garziandia, H. Budzinski and E. Villenave, Atmos. Environ., 2012, 61, 15–22 CrossRef CAS PubMed.
- Y. Zhang, B. Yang, J. Gan, C. Liu, X. Shu and J. Shu, Atmos. Environ., 2011, 45, 2515–2521 CrossRef CAS PubMed.
- C. Liu, P. Zhang, B. Yang, Y. Wang and J. Shu, Environ. Sci. Technol., 2012, 46, 7575–7580 CrossRef CAS PubMed.
- J. N. Pitts, J. A. Sweetman, B. Zielinska, R. Atkinson, A. M. Winer and W. P. Harger, Environ. Sci. Technol., 1985, 19, 1115–1121 CrossRef CAS PubMed.
- R. M. Kamens, J. Guo, Z. Guo and S. R. McDow, Atmos. Environ., Part A, 1990, 24, 1161–1173 CrossRef.
- J. Mak, S. Gross and A. K. Bertram, Geophys. Res. Lett., 2007, 34, L10804 CrossRef.
- F. Karagulian and M. J. Rossi, J. Phys. Chem. A, 2007, 111, 1914–1926 CrossRef CAS PubMed.
- S. Gross and A. K. Bertram, J. Phys. Chem. A, 2008, 112, 3104–3113 CrossRef CAS PubMed.
- N. O. A. Kwamena and J. P. D. Abbatt, Atmos. Environ., 2008, 42, 8309–8314 CrossRef CAS PubMed.
- J. N. Pitts, K. A. van Cauwenberghe, D. Grosjean, J. P. Schmid, D. R. Fitz, W. L. Belser, G. B. Knudson and P. M. Hynds, Science, 1978, 202, 515–519 Search PubMed.
- H. Tokiwa, R. Nakagawa, K. Morita and Y. Ohnishi, Mutat. Res., 1981, 85, 195–205 CrossRef CAS.
- Z. Guo and R. M. Kamens, J. Atmos. Chem., 1991, 12, 137–151 CrossRef CAS.
- J. D. Butler and P. Crossley, Atmos. Environ., 1981, 15, 91–94 CrossRef CAS.
- E. Brorstrom-Lunden and A. Lindskog, Environ. Sci. Technol., 1985, 19, 313–316 CrossRef PubMed.
- M. M. Hughes, D. F. S. Natusch, D. R. Taylor and M. V. Zeller, in Polynuclear Aromatic Hydrocarbons: Chemistry and Biological Effects, ed. A. Bjørseth and A. J. Dennis, Battelle Press, Columbus, 1980 Search PubMed.
- C. H. Wu and H. Niki, Environ. Sci. Technol., 1985, 19, 1089–1094 CrossRef CAS PubMed.
- K. Inazu, T. Kobayashi and Y. Hisamatsu, Chemosphere, 1997, 35, 607–622 CrossRef CAS.
- M. L. Nguyen, Y. Bedjanian and A. Guilloteau, J. Atmos. Chem., 2009, 62, 139–150 CrossRef CAS.
- E. Perraudin, H. Budzinski and E. Villenave, Atmos. Environ., 2005, 39, 6557–6567 CrossRef CAS PubMed.
- K. Miet, K. Le Menach, P. M. Flaud, H. Budzinski and E. Villenave, Atmos. Environ., 2009, 43, 837–843 CrossRef CAS PubMed.
- J. Ma, Y. Liu and H. He, Atmos. Environ., 2011, 45, 917–924 CrossRef CAS PubMed.
- T. Ramdahl, A. Bjorseth, D. M. Lokensgard and J. N. Pitts, Chemosphere, 1984, 13, 527–534 CrossRef CAS.
- H. M. Wang, K. Hasegawa and S. Kagaya, Chemosphere, 1999, 39, 1923–1936 CrossRef CAS.
- D. Grosjean, Atmos. Environ., 1983, 17, 2112–2114 CrossRef CAS.
- A. Lindskog, E. Brorström-Lundén and A. Sjödin, Environ. Int., 1985, 11, 125–130 CrossRef CAS.
- R. A. Yokley, A. A. Garrison, G. Mamantov and E. L. Wehry, Chemosphere, 1985, 14, 1771–1778 CrossRef CAS.
- H. M. Wang, K. Hasegawa and S. Kagaya, Chemosphere, 2000, 41, 1479–1484 CrossRef CAS.
- H. M. Wang, K. Hasegawa and S. Kagaya, J. Environ. Sci. Health, Part A: Toxic/Hazard. Subst. Environ. Eng., 2000, 35, 765–773 CrossRef.
- M. Katz, C. Chan, H. Tosine and T. Sakuma, in Polynuclear Aromatic Hydrocarbons, ed. P. W. Jones and P. Leber, Ann Arbor Science Publishers, Ann Arbor, MI, 1979, pp. 171–189 Search PubMed.
- J. N. Pitts, D. M. Lokensgard, P. S. Ripley, K. A. van Cauwenberghe, L. van Vaeck, S. D. Shaffer, A. J. Thill and W. L. Belser, Science, 1980, 210, 1347–1349 CAS.
- J. N. Pitts, H. R. Paur, B. Zielinska, J. Arey, A. M. Winer, T. Ramdahl and V. Mejia, Chemosphere, 1986, 15, 675–685 CrossRef CAS.
- S. Lelievre, Y. Bedjanian, N. Pouvesle, J. L. Delfau, C. Vovelle and G. Le Bras, Phys. Chem. Chem. Phys., 2004, 6, 1181–1191 RSC.
- U. Pöschl, T. Letzel, C. Schauer and R. Niessner, J. Phys. Chem. A, 2001, 105, 4029–4041 CrossRef.
- N. O. A. Kwamena, J. A. Thornton and J. P. D. Abbatt, J. Phys. Chem. A, 2004, 108, 11626–11634 CrossRef CAS.
- N. O. A. Kwamena, M. E. Earp, C. J. Young and J. P. D. Abbatt, J. Phys. Chem. A, 2006, 110, 3638–3646 CrossRef CAS PubMed.
- B. T. Mmereki and D. J. Donaldson, J. Phys. Chem. A, 2003, 107, 11038–11042 CrossRef CAS.
- B. T. Mmereki, D. J. Donaldson, J. B. Gilman, T. L. Eliason and V. Vaida, Atmos. Environ., 2004, 38, 6091–6103 CrossRef CAS PubMed.
- S. Raja and K. T. Valsaraj, J. Air Waste Manage. Assoc., 2005, 55, 1345–1355 CAS.
- T. F. Kahan, N. O. A. Kwamena and D. J. Donaldson, Atmos. Environ., 2006, 40, 3448–3459 CrossRef CAS PubMed.
- K. Miet, K. Le Menach, P. M. Flaud, H. Budzinski and E. Villenave, Atmos. Environ., 2009, 43, 3699–3707 CrossRef CAS PubMed.
- E. Perraudin, H. Budzinski and E. Villenave, J. Atmos. Chem., 2007, 56, 57–82 CrossRef CAS.
- C. H. Wu, I. Salmeen and H. Niki, Environ. Sci. Technol., 1984, 18, 603–607 CrossRef CAS PubMed.
- R. M. Kamens, J. M. Perry, D. A. Saucy, D. A. Bell, D. L. Newton and B. Brand, Environ. Int., 1985, 11, 131–136 CrossRef CAS.
- N. O. A. Kwamena, M. G. Staikova, D. J. Donaldson, I. J. George and J. P. D. Abbatt, J. Phys. Chem. A, 2007, 111, 11050–11058 CrossRef CAS PubMed.
- A. Alebic-Juretic, T. Cvitas and L. Klasinc, Environ. Sci. Technol., 1990, 24, 62–66 CrossRef CAS.
- E. Perraudin, H. Budzinski and E. Villenave, Atmos. Environ., 2007, 41, 6005–6017 CrossRef CAS PubMed.
- P. S. Bailey, Ozonation in Organic Chemistry: Vol. II, Nonolefinic Compounds, Academic Press, New York, 1982, pp. 82–84 Search PubMed.
- T. Letzel, E. Rosenberg, R. Wissiack, M. Grasserbauer and R. Niessner, J. Chromatogr., A, 1999, 855, 501–514 CrossRef CAS.
- J. Jäger and V. Hanus, J. Hyg., Epidemiol., Microbiol., Immunol., 1980, 24, 1–15 Search PubMed.
- H. Y. Chen, Y. G. Teng and J. S. Wang, Sci. Total Environ., 2012, 414, 293–300 CrossRef CAS PubMed.
- S. Zhou, A. K. Y. Lee, R. D. McWhinney and J. P. D. Abbatt, J. Phys. Chem. A, 2012, 116, 7050–7056 CrossRef CAS PubMed.
- R. W. Coutant, L. Brown, J. C. Chuang, R. M. Riggin and R. G. Lewis, Atmos. Environ., 1988, 22, 403–409 CrossRef CAS.
- K. Zimmermann, N. Jariyasopit, S. L. Massey Simonich, S. Tao, R. Atkinson and J. Arey, Environ. Sci. Technol., 2013, 47, 8434–8442 CAS.
- F. M. Jaward, N. J. Farrar, T. Harner, A. J. Sweetman and K. C. Jones, Environ. Toxicol. Chem., 2004, 23, 1355–1364 CrossRef CAS.
- J. Klánová, P. Čupr, I. Holoubek, J. Borůvková, P. Přibylová, R. Kareš, T. Tomsej and T. Ocelka, J. Environ. Monit., 2009, 11, 1952–1963 RSC.
- L. Nizzetto, R. Lohmann, R. Gioia, A. Jahnke, C. Temme, J. Dachs, P. Herckes, A. Di Guardo and K. C. Jones, Environ. Sci. Technol., 2008, 42, 1580–1585 CrossRef CAS.
- S. A. Genualdi, R. K. Killin, J. Woods, G. Wilson, D. Schmedding and S. L. M. Simonich, Environ. Sci. Technol., 2009, 43, 1061–1066 CrossRef CAS.
- T. Primbs, A. Piekarz, G. Wilson, D. Schmedding, C. Higginbotham, J. Field and S. M. Simonich, Environ. Sci. Technol., 2008, 42, 6385–6391 CrossRef CAS.
- J. M. Daisey, R. J. McCaffrey and R. A. Gallagher, Atmos. Environ., 1981, 15, 1353–1363 CrossRef CAS.
- P. Fernández, J. O. Grimalt and R. M. Vilanova, Environ. Sci. Technol., 2002, 36, 1162–1168 CrossRef.
- C. J. Halsall, L. A. Barrie, P. Fellin, D. C. G. Muir, B. N. Billeck, A. R. White, L. Lockhart, F. Y. Rovinsky, E. Y. Kononov and B. Pastukhov, Environ. Sci. Technol., 1997, 31, 3593–3599 CrossRef CAS.
- A. K. Halse, M. Schlabach, S. Eckhardt, A. Sweetman, K. C. Jones and K. Breivik, Atmos. Chem. Phys., 2011, 11, 1549–1564 CrossRef CAS.
- H. Hung, P. Blanchard, C. J. Halsall, T. F. Bidleman, G. A. Stern, P. Fellin, D. C. G. Muir, L. A. Barrie, L. M. Jantunen, P. A. Helm, J. Ma and A. Konoplev, Sci. Total Environ., 2005, 342, 119–144 CrossRef CAS PubMed.
- J. L. Jaffrézo, P. Masclet, M. P. Clain, H. Wortham, S. Beyne and H. Cachier, Atmos. Environ., Part A, 1993, 27, 2781–2785 CrossRef.
- G. Lammel, J. Klánová, J. Kohoutek, R. Prokeš, L. Ries and A. Stohl, Environ. Pollut., 2009, 157, 3264–3271 CrossRef CAS PubMed.
- L. Melymuk, M. Robson, P. A. Helm and M. L. Diamond, Atmos. Environ., 2011, 45, 1867–1875 CrossRef CAS PubMed.
- G. W. Patton, M. D. Walla, T. F. Bidleman and L. A. Barrie, J. Geophys. Res.: Atmos., 1991, 96, 10867–10877 CrossRef.
- B. L. van Drooge, P. Fernandez, J. O. Grimalt, E. Stuchlik, C. J. Torres Garcia and E. Cuevas, Environ. Sci. Pollut. Res., 2010, 17, 1207–1216 CrossRef PubMed.
- H. Xiao, S. Kang, Q. Zhang, W. Han, M. Loewen, F. Wong, H. Hung, Y. D. Lei and F. Wania, J. Geophys. Res.: Atmos., 2010, 115, D16310 CrossRef.
- J. Gabrieli, P. Vallelonga, G. Cozzi, P. Gabrielli, A. Gambaro, M. Sigl, F. Decet, M. Schwikowski, H. Gäggeler, C. Boutron, P. Cescon and C. Barbante, Environ. Sci. Technol., 2010, 44, 3260–3266 CrossRef CAS PubMed.
- S. Usenko, D. H. Landers, P. G. Appleby and S. L. Simonich, Environ. Sci. Technol., 2007, 41, 7235–7241 CrossRef CAS.
- T. Gocht, K. M. Moldenhauer and W. Puttmann, Appl. Geochem., 2001, 16, 1707–1721 CrossRef CAS.
- L. K. Ackerman, A. R. Schwindt, S. L. M. Simonich, D. C. Koch, T. F. Blett, C. B. Schreck, M. L. Kent and D. H. Landers, Environ. Sci. Technol., 2008, 42, 2334–2341 CrossRef CAS.
- X. Wang, T. Yao, Z. Cong, X. Yan, S. Kang and Y. Zhang, Chin. Sci. Bull., 2007, 52, 1405–1413 CrossRef CAS PubMed.
- A. J. Peters, D. J. Gregor, C. F. Teixeira, N. P. Jones and C. Spencer, Sci. Total Environ., 1995, 160–161, 167–179 CrossRef.
- J. L. Jaffrézo, M. P. Clain and P. Masclet, Atmos. Environ., 1994, 28, 1139–1145 CrossRef.
- V. Hoyau, J. L. Jaffrézo, P. H. Garrigues, M. P. Clain and P. Masclet, Polycyclic Aromat. Compd., 1996, 8, 35–44 CrossRef CAS.
- P. Kukučka, G. Lammel, A. Dvorská, J. Klánová, A. Möller and E. Fries, Environ. Chem., 2010, 7, 504–513 CrossRef.
- P. G. Desideri, L. Lepri, L. Checchini and D. Santianni, Int. J. Environ. Anal. Chem., 1994, 55, 33–46 CrossRef CAS.
- R. Lohmann, R. Gioia, K. C. Jones, L. Nizzetto, C. Temme, Z. Xie, D. Schulz-Bull, I. Hand, D. M. Griffin, E. Morgan and L. Jantunen, Environ. Sci. Technol., 2009, 43, 5633–5639 CrossRef CAS.
- C. J. Halsall, A. J. Sweetman, L. A. Barrie and K. C. Jones, Atmos. Environ., 2001, 35, 255–267 CrossRef CAS.
- W. D. Hafner and R. A. Hites, Environ. Sci. Technol., 2003, 37, 3764–3773 CrossRef CAS.
- C. Lang, S. Tao, W. Liu, Y. Zhang and S. Simonich, Environ. Sci. Technol., 2008, 42, 5196–5201 CrossRef CAS.
- U. M. Sofowote, H. Hung, A. K. Rastogi, J. N. Westgate, P. F. Deluca, Y. Su and B. E. McCarry, Atmos. Environ., 2011, 45, 967–976 CrossRef CAS PubMed.
- D. Yaffe, Y. Cohen, J. Arey and A. J. Grosovsky, Risk Anal., 2001, 21, 275–294 CAS.
- K. Prevedouros, E. Brorström-Lundén, C. J. Halsall, K. C. Jones, R. G. M. Lee and A. J. Sweetman, Environ. Pollut., 2004, 128, 17–27 CrossRef CAS PubMed.
- A. Aulinger, V. Matthias and M. Quante, J. Appl. Meteo. Climatol., 2007, 46, 1718–1730 CrossRef.
- A. Gusev, O. Rozovskaya, V. Shatalov, V. Sokovyh, W. Aas and K. Breivik, Persistent Organic Pollutants in the Environment. EMEP Status Report 3/2009, Meteorological Synthesizing Centre – East, Moscow, Russian Federation, 2009, p. 84.
- V. Matthias, A. Aulinger and M. Quante, Atmos. Environ., 2009, 43, 4078–4086 CrossRef CAS PubMed.
- V. Shatalov, A. Gusev, S. Dutchak, O. Rozovskaya, V. Sokovykh, N. Vulykh, W. Aas and K. Breivik, Persistent organic pollutants in the environment. EMEP Status Report 3/2010, Geneva, 2010, p. 100.
- C. Silibello, G. Calori, M. P. Costa, M. G. Dirodi, M. Mircea, P. Radice, L. Vitali and G. Zanini, Atmos. Pollut. Res., 2012, 3, 399–407 CrossRef CAS.
- Y. Zhang, H. Shen, S. Tao and J. Ma, Atmos. Environ., 2011, 45, 2820–2827 CrossRef CAS PubMed.
- Y. Zhang, S. Tao, J. Ma and S. Simonich, Atmos. Chem. Phys., 2011, 11, 11993–12006 CrossRef CAS.
- A. M. Sehili and G. Lammel, Atmos. Environ., 2007, 41, 8301–8315 CrossRef CAS PubMed.
- C. L. Friedman and N. E. Selin, Environ. Sci. Technol., 2012, 46, 9501–9510 CrossRef CAS PubMed.
- G. Lammel, W. Klöpffer, V. S. Semeena, E. Schmidt and A. Leip, Environ. Sci. Pollut. Res., 2007, 14, 153–165 CrossRef CAS.
- M. Hauck, M. A. J. Huijbregts, J. M. Armitage, I. T. Cousins, A. M. J. Ragas and D. van de Meent, Chemosphere, 2008, 72, 959–967 CrossRef CAS PubMed.
- P. Ciccioli, A. Cecinato, E. Brancaleoni, M. Frattoni, P. Zacchei, A. H. Miguel and P. D. Vasconcellos, J. Geophys. Res.: Atmos., 1996, 101, 19567–19581 CrossRef CAS.
- E. Alonso, N. Tapie, H. Budzinski, K. Lemenach, L. Peluhet and J. V. Tarazona, Environ. Sci. Pollut. Res., 2008, 15, 31–40 CrossRef.
- D. Marinov, S. Dueri, I. Puillat, R. Carafa, E. Jurado, N. Berrojalbiz, J. Dachs and J. M. Zaldivar, Mar. Pollut. Bull., 2009, 58, 1554–1561 CrossRef CAS PubMed.
- C. Walgraeve, K. Demeestere, J. Dewulf, R. Zimmermann and H. Van Langenhove, Atmos. Environ., 2010, 44, 1831–1846 CrossRef CAS PubMed.
- T. Nielsen, Environ. Sci. Technol., 1984, 18, 157–163 CrossRef CAS PubMed.
- A. Liberti and P. Ciccioli, HRC & CC, J. High Resolut. Chromatogr. Chromatogr. Commun., 1986, 9, 492–501 CAS.
- J. Arey, B. Zielinska, R. Atkinson and A. M. Winer, Atmos. Environ., 1987, 21, 1437–1444 CrossRef CAS.
- J. P. Zhu, X. L. Cao, R. Pigeon and K. Mitchell, J. Air Waste Manage. Assoc., 2003, 53, 67–76 CAS.
- R. Atkinson, J. Arey, B. Zielinska, J. N. Pitts and A. M. Winer, Atmos. Environ., 1987, 21, 2261–2262 CrossRef CAS.
- H. A. Bamford and J. E. Baker, Atmos. Environ., 2003, 37, 2077–2091 CrossRef CAS.
- P. Ciccioli, A. Cecinato, E. Brancaleoni, R. Draisci and A. Liberti, Aerosol Sci. Technol., 1989, 10, 296–310 CrossRef CAS.
- P. Ciccioli, A. Cecinato, R. Cabella, E. Brancaleoni and P. Buttini, Atmos. Environ., Part A, 1993, 27, 1261–1270 CrossRef.
- T. T. Hien, L. T. Thanh, T. Kameda, N. Takenaka and H. Bandow, Atmos. Environ., 2007, 41, 7715–7725 CrossRef CAS PubMed.
- T. Nielsen, B. Seitz and T. Ramdahl, Atmos. Environ., 1984, 18, 2159–2165 CrossRef CAS.
- J. N. Pitts, J. A. Sweetman, B. Zielinska, A. M. Winer and R. Atkinson, Atmos. Environ., 1985, 19, 1601–1608 CrossRef CAS.
- T. Ramdahl, B. Zielinska, J. Arey, R. Atkinson, A. M. Winer and J. N. Pitts, Nature, 1986, 321, 425–427 CrossRef CAS PubMed.
- F. Reisen and J. Arey, Environ. Sci. Technol., 2005, 39, 64–73 CrossRef CAS.
- W. Wang, N. Jariyasopit, J. Schrlau, Y. Jia, S. Tao, T.-W. Yu, R. H. Dashwood, W. Zhang, X. Wang and S. L. M. Simonich, Environ. Sci. Technol., 2011, 45, 6887–6895 CrossRef CAS PubMed.
- J. A. Sweetman, B. Zielinska, R. Atkinson, T. Ramdahl, A. M. Winer and J. N. Pitts, Atmos. Environ., 1986, 20, 235–238 CrossRef CAS.
- A. Feilberg, M. W. B. Poulsen, T. Nielsen and H. Skov, Atmos. Environ., 2001, 35, 353–366 CrossRef CAS.
- F. Marino, A. Cecinato and P. A. Siskos, Chemosphere, 2000, 40, 533–537 CrossRef CAS.
- A. Albinet, E. Leoz-Garziandia, H. Budzinski, E. Villenave and J. L. Jaffrezo, Atmos. Environ., 2008, 42, 43–54 CrossRef CAS PubMed.
- M. Tsapakis and E. G. Stephanou, Environ. Sci. Technol., 2007, 41, 8011–8017 CrossRef CAS.
- F. Reisen, S. Wheeler and J. Arey, Atmos. Environ., 2003, 37, 3653–3657 CrossRef CAS.
- M. Dimashki, S. Harrad and R. M. Harrison, Atmos. Environ., 2000, 34, 2459–2469 CrossRef CAS.
- T. Murahashi and K. Hayakawa, Anal. Chim. Acta, 1997, 343, 251–257 CrossRef CAS.
- J. M. Bayona, M. Casellas, P. Fernandez, A. M. Solanas and J. Albaiges, Chemosphere, 1994, 29, 441–450 CrossRef CAS.
- A. Cecinato, J. Sep. Sci., 2003, 26, 402–408 CrossRef CAS.
- J. C. Chuang, G. A. Mack, M. R. Kuhlman and N. K. Wilson, Atmos. Environ., Part B, 1991, 25, 369–380 CrossRef.
- N. K. Wilson and T. R. McCurdy, Atmos. Environ., 1995, 29, 2575–2584 CrossRef CAS.
- P. Gupta, W. P. Harger and J. Arey, Atmos. Environ., 1996, 30, 3157–3166 CrossRef CAS.
- T. Kameda, J. Health Sci., 2011, 57, 504–511 CrossRef CAS.
- Y. Kojima, K. Inazu, Y. Hisamatsu, H. Okochi, T. Baba and T. Nagoya, Atmos. Environ., 2010, 44, 2873–2880 CrossRef CAS PubMed.
- A. Albinet, E. Leoz-Garziandia, H. Budzinski, E. Villenave and J. L. Jaffrezo, Atmos. Environ., 2008, 42, 55–64 CrossRef CAS PubMed.
- R. M. Kamens, H. Karam, J. H. Guo, J. M. Perry and L. Stockburger, Environ. Sci. Technol., 1989, 23, 801–806 CrossRef CAS.
- A. Eiguren-Fernandez, A. H. Miguel, R. Lu, K. Purvis, B. Grant, P. Mayo, E. Di Stefano, A. K. Cho and J. Froines, Atmos. Environ., 2008, 42, 2312–2319 CrossRef CAS PubMed.
- J. Arey, R. Atkinson, B. Zielinska and P. A. McElroy, Environ. Sci. Technol., 1989, 23, 321–327 CrossRef CAS.
- J. Arey, R. Atkinson, S. M. Aschmann and D. Schuetzle, Polycyclic Aromat. Compd., 1990, 1, 33–50 CrossRef.
- Y. Kojima, K. Inazu, Y. Hisamatsu, H. Okochi, T. Baba and T. Nagoya, Asian J. Atmos. Environ., 2010, 4, 1–8 CrossRef.
- A. Pozzer, P. Zimmermann, U. M. Doering, J. van Aardenne, H. Tost, F. Dentener, G. Janssens-Maenhout and J. Lelieveld, Atmos. Chem. Phys., 2012, 12, 6915–6937 CrossRef CAS.
- M. Giannouli, E.-A. Kalognomou, G. Mellios, N. Moussiopoulos, Z. Samaras and J. Fiala, Atmos. Environ., 2011, 45, 4753–4762 CrossRef CAS PubMed.
- H. Cai and S. Xie, Sci. Total Environ., 2011, 409, 1935–1948 CrossRef CAS PubMed.
- W. Wang, S. Simonich, B. Giri, Y. Chang, Y. Zhang, Y. Jia, S. Tao, R. Wang, B. Wang, W. Li, J. Cao and X. Lu, Sci. Total Environ., 2011, 409, 2942–2950 CrossRef CAS PubMed.
- Ref. 398–472 are cited in the ESI†; J. O. Allen, N. M. Dookeran, K. Taghizadeh, A. L. Lafleur, K. A. Smith and A. F. Sarofim, Environ. Sci. Technol., 1997, 31, 2064–2070 CrossRef CAS.
- C. A. Alves and C. A. Pio, J. Braz. Chem. Soc., 2005, 16, 1017–1029 CrossRef CAS PubMed.
- P. Castells, F. J. Santos and M. T. Gaiceran, J. Chromatogr., A, 2003, 1010, 141–151 CrossRef CAS.
- A. K. Cho, E. Di Stefano, Y. You, C. E. Rodriguez, D. A. Schmitz, Y. Kumagai, A. H. Miguel, A. Eiguren-Fernandez, T. Kobayashi, E. Avol and J. R. Froines, Aerosol Sci. Technol., 2004, 38, 68–81 CrossRef CAS.
- M. Y. Chung, R. A. Lazaro, D. Lim, J. Jackson, J. Lyon, D. Rendulic and A. S. Hasson, Environ. Sci. Technol., 2006, 40, 4880–4886 CrossRef CAS.
- O. Delhomme, M. Millet and P. Herckes, Talanta, 2008, 74, 703–710 CrossRef CAS PubMed.
- A. Eiguren-Fernandez, A. H. Miguel, E. Di Stefano, D. A. Schmitz, A. K. Cho, S. Thurairatnam, E. L. Avol and J. R. Froines, Aerosol Sci. Technol., 2008, 42, 854–861 CrossRef CAS.
- N. Kishikawa, M. Nakao, Y. Ohba, K. Nakashima and N. Kuroda, Chemosphere, 2006, 64, 834–838 CrossRef CAS PubMed.
- R. Koeber, J. M. Bayona and R. Niessner, Environ. Sci. Technol., 1999, 33, 1552–1558 CrossRef CAS.
- J. Konig, E. Balfanz, W. Funcke and T. Romanowski, Anal. Chem., 1983, 55, 599–603 CrossRef.
- J. Lintelmann, K. Fischer, E. Karg and A. Schroppel, Anal. Bioanal. Chem., 2005, 381, 508–519 CrossRef CAS PubMed.
- J. Lintelmann, K. Fischer and G. Matuschek, J. Chromatogr., A, 2006, 1133, 241–247 CrossRef CAS PubMed.
- Y. Liu, M. Sklorz, J. Schnelle-Kreis, J. Orasche, T. Ferge, A. Kettrup and R. Zimmermann, Chemosphere, 2006, 62, 1889–1898 CrossRef CAS PubMed.
- J. D. McDonald, B. Zielinska, J. C. Sagebiel and M. R. McDaniel, Aerosol Sci. Technol., 2002, 36, 1033–1044 CrossRef CAS.
- C. Neususs, M. Pelzing, A. Plewka and H. Herrmann, J. Geophys. Res.: Atmos., 2000, 105, 4513–4527 CrossRef CAS.
- S. Nicol, J. Dugay and M. C. Hennion, Chromatographia, 2001, 53, S464–S469 CAS.
- E.-J. Park, D.-S. Kim and K. Park, Environ. Monit. Assess., 2008, 137, 441–449 CrossRef CAS PubMed.
- N. Re-Poppi and M. Santiago-Silva, Atmos. Environ., 2005, 39, 2839–2850 CrossRef CAS PubMed.
- E. Schnelle-Kreis, M. Sklorz, A. Peters, J. Cyrys and R. Zimmermann, Atmos. Environ., 2005, 39, 7702–7714 Search PubMed.
- J. Schnelle-Kreis, I. Gebefugi, G. Welzl, T. Jaensch and A. Kettrup, Atmos. Environ., 2001, 35, S71–S81 CrossRef CAS.
- M. D. Sienra, Atmos. Environ., 2006, 40, 2374–2384 CrossRef CAS PubMed.
- B. R. T. Simoneit, X. Bi, D. R. Oros, P. M. Medeiros, G. Sheng and J. Fu, Environ. Sci. Technol., 2007, 41, 7294–7302 CrossRef CAS.
- M. Sklorz, J.-J. Briede, J. Schnelle-Kreis, Y. Liu, J. Cyrys, T. M. de Kok and R. Zimmermann, J. Toxicol. Environ. Health, Part A, 2007, 70, 1866–1869 CrossRef CAS PubMed.
- M. Strandell, S. Zakrisson, T. Alsberg, R. Westerholm, L. Winquist and U. Rannug, Environ. Health Perspect., 1994, 102, 85–92 CAS.
- M. Tsapakis, E. Lagoudaki, E. G. Stephanou, I. G. Kavouras, P. Koutrakis, P. Oyola and D. von Baer, Atmos. Environ., 2002, 36, 3851–3863 CrossRef CAS.
- A. Valavanidis, K. Fiotakis, T. Vlahogianni, V. Papadimitriou and V. Pantikaki, Environ. Chem., 2006, 3, 118–123 CrossRef CAS.
- N. Yassaa, B. Y. Meklati, A. Cecinato and F. Marino, Environ. Sci. Technol., 2001, 35, 306–311 CrossRef CAS.
- T. Kameda, T. Goto, A. Toriba, N. Tang and K. Hayakawa, J. Chromatogr., A, 2009, 1216, 6758–6761 CrossRef CAS PubMed.
- M. P. Ligocki and J. F. Pankow, Environ. Sci. Technol., 1989, 23, 75–83 CrossRef CAS.
- P. M. Fine, G. R. Cass and B. R. T. Simoneit, Environ. Sci. Technol., 2002, 36, 1442–1451 CrossRef CAS.
- E. M. Fitzpatrick, A. B. Ross, J. Bates, G. Andrews, J. M. Jones, J. Aspden, H. Phylaktou, M. Pourkashanian and A. Williams, Process Saf. Environ. Prot., 2007, 85, 430–440 CrossRef CAS.
- M. P. Fraser, G. R. Cass and B. R. T. Simoneit, Environ. Sci. Technol., 1998, 32, 2051–2060 CrossRef CAS.
- M. D. Hays, P. M. Fine, C. D. Geron, M. J. Kleeman and B. K. Gullett, Atmos. Environ., 2005, 39, 6747–6764 CrossRef CAS PubMed.
- Y. Iinuma, E. Brüggemann, T. Gnauk, K. Müller, M. O. Andreae, G. Helas, R. Parmar and H. Herrmann, J. Geophys. Res.: Atmos., 2007, 112, D08209 CrossRef.
- C. A. Jakober, S. G. Riddle, M. A. Robert, H. Destaillats, M. J. Charles, P. G. Green and M. J. Kleeman, Environ. Sci. Technol., 2007, 41, 4548–4554 CrossRef CAS.
- C. A. Jakober, M. A. Robert, S. G. Riddle, H. Destaillats, M. J. Charles, P. G. Green and M. J. Kleeman, Environ. Sci. Technol., 2008, 42, 4697–4703 CrossRef CAS.
- J. Oda, I. Maeda, T. Mori, A. Yasuhara and Y. Saito, Environ. Technol., 1998, 19, 961–976 CrossRef CAS.
- J. Oda, S. Nomura, A. Yasuhara and T. Shibamoto, Atmos. Environ., 2001, 35, 4819–4827 CrossRef CAS.
- X. Rao, R. Kobayashi, R. White-Morris, R. Spaulding, P. Frazey and M. J. Charles, J. AOAC Int., 2001, 84, 699–705 CAS.
- N. Re-Poppi and M. R. Santiago-Silva, Chromatographia, 2002, 55, 475–481 CAS.
- W. F. Rogge, L. M. Hildemann, M. A. Mazurek, G. R. Cass and B. R. T. Simoneit, Environ. Sci. Technol., 1993, 27, 2736–2744 CrossRef CAS.
- W. F. Rogge, L. M. Hildemann, M. A. Mazurek, G. R. Cass and B. R. T. Simoneit, Environ. Sci. Technol., 1993, 27, 1892–1904 CrossRef CAS.
- W. F. Rogge, L. M. Hildemann, M. A. Mazurek, G. R. Cass and B. R. T. Simoneit, Environ. Sci. Technol., 1993, 27, 636–651 CrossRef CAS.
- W. F. Rogge, L. M. Hildemann, M. A. Mazurek, G. R. Cass and B. R. T. Simoneit, Environ. Sci. Technol., 1997, 31, 2731–2737 CrossRef CAS.
- W. F. Rogge, L. M. Hildemann, M. A. Mazurek, G. R. Cass and B. R. T. Simoneit, Environ. Sci. Technol., 1998, 32, 13–22 CrossRef CAS.
- G. Shen, S. Wei, Y. Zhang, R. Wang, B. Wang, W. Li, H. Shen, Y. Huang, Y. Chen, H. Chen, W. Wei and S. Tao, Atmos. Environ., 2012, 60, 234–237 CrossRef CAS PubMed.
- S. Sidhu, B. Gullett, R. Striebich, J. Klosterman, J. Contreras and M. de Vito, Atmos. Environ., 2005, 39, 801–811 CrossRef CAS PubMed.
- M. Stefanova, S. P. Marinov, A. M. Mastral, M. S. Callen and T. Garcia, Fuel Process. Technol., 2002, 77, 89–94 CrossRef.
- B. Zielinska, J. Sagebiel, J. D. McDonald, K. Whitney and D. R. Lawson, J. Air Waste Manage. Assoc., 2004, 54, 1138–1150 CAS.
- H. A. Bamford, D. Z. Bezabeh, M. M. Schantz, S. A. Wise and J. E. Baker, Chemosphere, 2003, 50, 575–587 CrossRef CAS.
- K. Hayakawa, T. Murahashi, M. Butoh and M. Miyazaki, Environ. Sci. Technol., 1995, 29, 928–932 CrossRef CAS PubMed.
- H. Kakimoto, M. Kitamura, Y. Matsumoto, S. Sakai, F. Kanoh, T. Murahashi, K. Akutsu, R. Kizu and K. Hayakawa, J. Health Sci., 2000, 46, 5–15 CrossRef CAS.
- H. Kakimoto, H. Yokoe, Y. Matsumoto, S. Sakai, F. Kanoh, T. Murahashi, K. Akutsu, A. Toriba, R. Kizu and K. Hayakawa, J. Health Sci., 2001, 47, 385–393 CrossRef CAS.
- L. C. Marr, K. Dzepina, J. L. Jimenez, F. Reisen, H. L. Bethel, J. Arey, J. S. Gaffney, N. A. Marley, L. T. Molina and M. J. Molina, Atmos. Chem. Phys., 2006, 6, 1733–1745 CrossRef CAS.
- H. F. Nassar, N. Tang, T. Kameda, A. Toriba, M. I. Khoder and K. Hayakawa, Atmos. Environ., 2011, 45, 7352–7359 CAS.
- M. D. Sienra and N. G. Rosazza, Atmos. Res., 2006, 81, 265–276 CrossRef CAS PubMed.
- N. Tang, T. Hattori, R. Taga, K. Igarashi, X. Y. Yang, K. Tamura, H. Kakimoto, V. F. Mishukov, A. Toriba, R. Kizu and K. Hayakawa, Atmos. Environ., 2005, 39, 5817–5826 CrossRef CAS PubMed.
- N. Tang, M. Tabata, V. F. Mishukov, V. Sergineko, A. Toriba, R. Kizu and K. Hayakawa, J. Health Sci., 2002, 48, 30–36 CrossRef CAS.
- B. L. Valle-Hernandez, V. Mugica-Alvarez, E. Salinas-Talavera, O. Amador-Munoz, M. A. Murillo-Tovar, R. Villalobos-Pietrini and A. De Vizcaya-Ruiz, Sci. Total Environ., 2010, 408, 5429–5438 CrossRef CAS PubMed.
- B. Zielinska, J. Arey, R. Atkinson and A. M. Winer, Atmos. Environ., 1989, 23, 223–229 CrossRef CAS.
- J. C. Ball and W. C. Young, Environ. Sci. Technol., 1992, 26, 2181–2186 CrossRef CAS.
- R. M. Campbell and M. L. Lee, Anal. Chem., 1984, 56, 1026–1030 CrossRef CAS.
- W. M. Draper, Chemosphere, 1986, 15, 437–447 CrossRef CAS.
- T. L. Gibson, Atmos. Environ., 1982, 16, 2037–2040 CrossRef CAS.
- K. Hayakawa, M. Butoh, Y. Hirabayashi and M. Miyazaki, Jpn. J. Toxicol. Environ. Health, 1994, 40, 20–25 CrossRef CAS.
- K. Hayakawa, M. Butoh and M. Miyazaki, Anal. Chim. Acta, 1992, 266, 251–256 CrossRef CAS.
- IARC, International Agency for Research on Cancer, Monographs on the Evaluation of Carcinogenic Risks to Humans, Volume 46: Diesel and Gasoline Engine Exhausts and Some Nitroarenes, http://monographs.iarc.fr/ENG/Monographs/vol46/volume46.pdf, 1989.
- G. Karavalakis, S. Stournas and E. Bakeas, Sci. Total Environ., 2009, 407, 3338–3346 CrossRef CAS PubMed.
- T. Murahashi, R. Kizu, H. Kakimoto, A. Toriba and K. Hayakawa, J. Health Sci., 1999, 45, 244–250 CrossRef CAS.
- M. C. Paputa-Peck, R. S. Marano, D. Schuetzle, T. L. Riley, C. V. Hampton, T. J. Prater, L. M. Skewes, T. E. Jensen, P. H. Ruehle, L. C. Bosch and W. P. Duncan, Anal. Chem., 1983, 55, 1946–1954 CrossRef CAS.
- S. M. Rappaport, Z. L. Jin and X. B. Xu, J. Chromatogr., 1982, 240, 145–154 CrossRef CAS.
- M. A. Ratcliff, A. J. Dane, A. Williams, J. Ireland, J. Luecke, R. L. McCormick and K. J. Voorhees, Environ. Sci. Technol., 2010, 44, 8343–8349 CrossRef CAS PubMed.
- D. Schuetzle, Environ. Health Perspect., 1983, 47, 65–80 CrossRef CAS.
- D. Schuetzle, T. L. Riley, T. J. Prater, T. M. Harvey and D. F. Hunt, Anal. Chem., 1982, 54, 265–271 CrossRef CAS.
- R. Westerholm and K. E. Egebäck, Environ. Health Perspect., 1994, 102, 13–23 CAS.
Footnotes |
| † Electronic supplementary information (ESI) available. See DOI: 10.1039/c3cs60147a |
| ‡ Also at: Department of Environmental Sciences/Center of Excellence in Environmental Studies, King Abdulaziz University, PO Box 80203, Jeddah, 21589, Saudi Arabia. |
| This journal is © The Royal Society of Chemistry 2013 |