 Open Access Article
Creative Commons Attribution 3.0 Unported Licence
The exciton dynamics in tetracene thin films†
Murad J. Y. Tayebjee‡, Raphaël G. C. R. Clady§ and Timothy W. Schmidt*
School of Chemistry, The University of Sydney, New South Wales 2006, Australia. E-mail: timothy.schmidt@sydney.edu.au; Fax: +61 2 9351 3329; Tel: +61 2 9351 2781
First published on 19th July 2013
Abstract
Tetracene thin films are investigated by time-resolved photoluminescence on picosecond to nanosecond time-scales. The picosecond luminescence decay dynamics is confirmed to be independent of temperature, but the nanosecond timescale luminescence dynamics is highly temperature dependent. This is interpretted in terms of motion along an intermolecular coordinate which couples the S1 state to the multiexciton (ME) state, arising from frustrated photodimerization, and giving rise to exciton dimming through adiabatic coupling. Dull excitons persist at low temperatures, but can thermally access separated triplet states at higher temperatures, quenching the delayed fluorescence. The effects of exciton density on both the picosecond and nanosecond luminescence dynamics are investigated, and a rate constant of (1.70 ± 0.08) × 10−8 cm3 s−1 is determined for singlet–singlet annihilation.
1 Introduction
Organic photovoltaics (OPV) are an emerging technology which have the potential to provide cheap and versatile solar energy conversion devices. However, at present, these cells are far less efficient than their inorganic counterparts. In principle, a single threshold device can achieve an energy conversion efficiency of 33.7% under one-sun – the Shockley–Queisser limit.1,2 But, a bulk-heterojunction device which requires a free-energy sacrifice to dissociate tightly bound Frenkel excitons is limited to 30% (24%) for a sacrifice of 0.3 eV (0.5 eV).3 Furthermore, the broad radiation spectrum of organic molecules generates entropy which further limits the efficiency.4 However, the highest efficiency reported for an organic solar cell is just 12.3%.5One way to achieve a higher efficiency is by creating multiple excitons with high energy photons. In organic materials this may be achieved by singlet fission, whereby an optically prepared singlet dissociates into two triplet excitons with (anti)-correlated spin (see ref. 6 and 7, and references therein). Singlet fission and the details of its mechanism have received significant attention due to its potential to circumvent the Shockley–Queisser limit.8–14 When singlet fission is optimally harnessed, the detailed balance efficiency limit is raised to 45.9% under standard illumination.15 Indeed, the solid polyacenes, tetracene (Tc) and pentacene, are known to exhibit singlet fission, and have recently been incorporated into solar cells.10,16–19
In pentacene, singlet fission occurs within a picosecond.18,20–23 From 2-photon photoemission (2PPE) experiments, a state with multiple exciton character is formed immediately after excitation, and then dissociates exothermically into separated triplets.23 This process has been satisfactorily explained by various theoretical models.
But, in tetracene, there are several aspects of the exciton dynamics which remain unclear although its photophysical and magnetic properties have been studied for decades.20,24–56 Notably, it would appear that the singlet state decays with an ≈80 ps lifetime irrespective of temperature, implying the involvement of a dark state, the nature of which is yet to be elucidated.20,53,54,56 While these dynamics are usually ascribed to singlet fission, all evidence points to the energy of separated triplets being higher than the lowest optically accessible singlet state.33 And yet, 2PPE experiments reveal the appearance of triplet character within the temporal width of a 100 fs laser pulse.56
At longer times, the emission from tetracene crystals and films at low temperatures is shifted to longer wavelengths, a phenomenon associated with “traps”.51,53–55 But, at extremely low temperatures (≈4 K), this behaviour is lost. The traps have variously been attributed to impurites,36 and self-trapped excitons.48 The exact nature remains unclear.
In this contribution, we reinvestigate the exciton dynamics of a tetracene thin film on time scales from 100 fs to 100 ns. We interpret our findings within a model which implies the existence of a dull (rather than dark) intermediate state. Our dynamical investigations allow us to unite several unresolved aspects of the ultrafast dynamics and trapping under a single model. The scheme to be consolidated in the following is illustrated in Fig. 1.
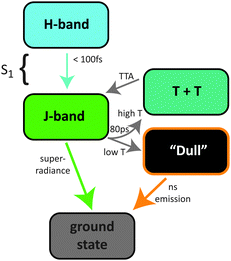 | ||
| Fig. 1 A cartoon representation of the exciton states and processes involved in the luminescence dynamics of tetracene thin films. | ||
2 Experimental
Tc thin films (∼100 nm thick, estimated from the absorption spectrum and extinction coefficient) were prepared by thermal evaporation of solid Tc (98% Sigma Aldrich) under vacuum. Samples were cooled in an Oxford Instruments Optistat DN and held at temperature for 10 minutes before performing experiments. A Clark MXR CPA 2210 delivered a 1 kHz stream of 150 fs, 780 nm pulses that pumped an OPA (TOPAS-C, Light Conversion), which output the 500 nm excitation source. Ultrafast time-resolved photoluminescence (TRPL) spectroscopy was performed in a fluorescence upconversion spectrometer (Halcyone, Ultrafast Systems), and nanosecond TRPL was performed using a spectrograph (Acton SpectraPro 2300, Princeton Instruments) and iCCD (7397-0005, Princeton Instruments). The reported exciton densities are estimated from the pump power, absorption spectrum, beam profile and thickness of the sample. (All reported exciton densities refer to the initial value – that is, not the transient value.)3 Results and discussion
3.1 Absorption spectra
The absorption spectrum of our Tc film is shown in Fig. 2. The S1 ← S0 transition occurs over a wavelength range of 400–550 nm and vibrational structure is clearly observed. The two lowest-energy transitions, observed at 524 and 505 nm, correspond to Davydov splitting of the 0–0 transition.57,58 The oscillator strength is shared between the two transitions and their relative contributions depend on the orientation of the crystallites. Indeed, different reports of Tc thin films display different trends. The spectrum in Fig. 2 is similar to that presented in ref. 50 and 53 where the peak at 505 nm dominates. However, the feature at 524 nm dominates the absorption spectrum presented in ref. 51. In the following, we refer to the higher energy origin as the H-band, and the lower energy band as the J-band. The H-band is an energy maximum in k-space, while the J-band is a minimum (see inset to Fig. 2).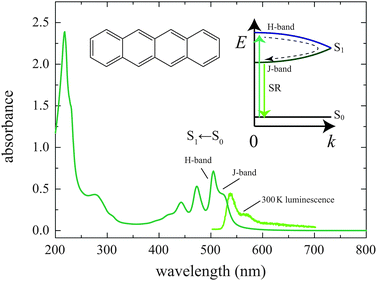 | ||
| Fig. 2 The absorption and emission spectra of our thermally evaporated 100 nm Tc thin film. The emission shown is from the low k-vector states in the lower energy J-type exciton band, as illustrated. Excitonic coupling gives rise to the Davydov splitting of an H-like band (bright at the top), and a J-like band (bright at the bottom). Population of the bottom of the J-band at low temperature gives rise to superradiance (SR). | ||
3.2 Ultrafast time-resolved photoluminescence
The ultrafast TRPL transients are shown in Fig. 3 at various temperatures when an exciton density of 2 × 1018 cm−3 was achieved after pumping at 500 nm. Absolute photoluminescence (PL) intensity at 530 nm (corresponding to the 0–0 transition) is highly temperature dependent, whereas there appears to be no temperature dependence at 575 nm (0–1). This behaviour is interpretted in terms of superradiance (SR), and is consistent with previous reports.51 SR occurs due to population of the bottom of the J-band, with small k-vector, following Kasha's Law. At higher temperatures, the darker exciton states away from band centre are populated, leading to a lower transition moment for the 0–0 transition.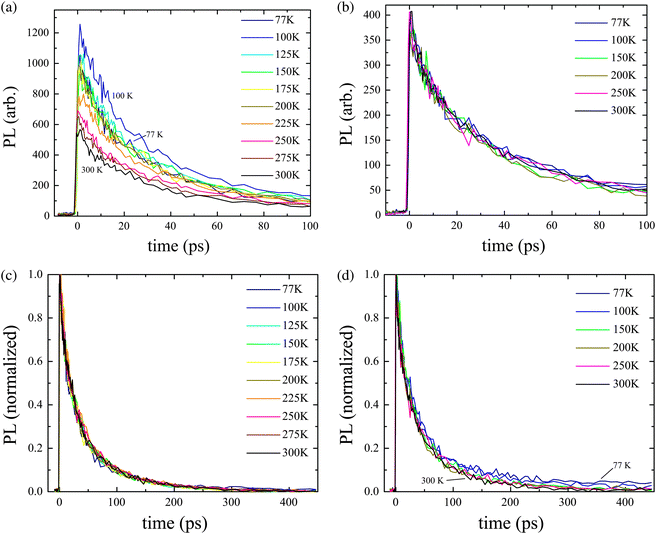 | ||
| Fig. 3 Picosecond TRPL transients after pumping at 500 nm for an exciton density of 2 × 1018 cm−3 at (a) 530 nm and (b) 575 nm. The respective normalized transients are shown in (c) and (d) over the entire temporal range measured. | ||
The normalized spectra in Fig. 3c and d show that the early dynamics are not significantly affected by temperature on this timescale. However, in the 575 nm case a long tail is observed, suggesting that there is a slower process giving rise to emission at this wavelength. Ultrafast TRPL at 575 nm was also measured with an exciton density of 4 × 1017 cm−3 over the entire range of temperatures considered. Similarly, the dynamics were found to be essentially independent of temperature (ESI†).
Upon photoexcitation, Tc has a population in the first excited singlet state, S1. These singlets may decay via several processes, including singlet fission (SF) and singlet–singlet annihilation (SSA). The first process is first order, whereas the latter has a quadratic dependence on exciton density. Since SF has been shown to be the dominant relaxation process in electron paramagnetic resonance,59 magnetic field dependent optical,41 and optical spectroscopy20,21,53 studies, we ignore (intramolecular) internal conversion, intersystem crossing and radiative decay pathways when modelling the ultrafast dynamics. Burdett et al. have suggested that SSA is negligible at an exciton density of 2 × 1017 cm−3.54 But, our PL at 560 nm with an exciton density of ∼8 × 1017 cm−3 at 77 K was not well fit using a single exponential decay function,
| I(t) = A exp(−k1t), | (1) |
Including SSA, since the rate of SF is much faster than radiative decay, the intensity of the ultrafast TRPL is given by, I ∝ [S1]t, and
 | (2) |
 | (3) |
Eqn (3) was used to fit transients measured over a range of exciton densities at 100 K. This mixed first/second-order kinetic model provided a far superior fit to the use of a single exponential. Using a value of 1/k1 = 80 ps in all fits, 1/βssa is plotted as a function of the inverse initial exciton density, 1/[S1]0, in Fig. 4. From the slope of this plot we arrive at an SSA rate of k2 = 1.70 ± 0.08 × 10⁻⁸ cm3 s−1. Reports of this value have varied over two orders of magnitude in crystalline Tc (5 × 10⁻⁹ cm3 s−1 and 1 × 10⁻⁷ cm3 s−1 in ref. 39 and 40 respectively). However, ours is in good agreement with a recent study of thin film Tc (∼10−8 cm3 s−1 at 298 K in ref. 54). The SSA process might explain the behavior observed by Chan et al., where a biexponential fit was used to fit 2PPE transients of the decay of the S1.56 Using parameters of β = 0.545 and 1/k1 = 80 ps, we are able to fit the S1 decay data shown in Figure 1d of ref. 56. This corresponds to an initial exciton density of 8.8 × 1017 cm−3, whereas the authors estimate an exciton density of 3 × 1017 cm−3.
![The value of 1/βssa as a function of the reciprocal of the initial exciton density, [S1]0. These values were obtained by fitting picosecond PL data collected at 560 nm and a temperature of 100 K after excitation at 500 nm. The equation of the line is 1/βssa = k1/(k2[S1]0) + 1.](/image/article/2013/CP/c3cp52609g/c3cp52609g-f4.gif) | ||
| Fig. 4 The value of 1/βssa as a function of the reciprocal of the initial exciton density, [S1]0. These values were obtained by fitting picosecond PL data collected at 560 nm and a temperature of 100 K after excitation at 500 nm. The equation of the line is 1/βssa = k1/(k2[S1]0) + 1. | ||
3.3 Nanosecond time-resolved PL
Fig. 5 shows the quasi-steady-state PL spectra of Tc with exciton densities of 4 × 1017 cm−3 and 2 × 1018 cm−3 after excitation with a 500 nm pump. The spectra were taken at a number of different temperatures ranging from 77 to 300 K, and are quasi-steady-state since they are integrated for a period of ∼100 ns after an initial photoexcitation. Indeed, in a recent study of Tc thin films, PL was only observed to persist for approximately 100 ns.54 This does not contradict the picosecond PL results shown in Fig. 3. Although the signal appears to drop to zero in these plots, this is because each point corresponds to the integrated PL over a temporal width that is limited by the laser pulse width (∼150 fs). Nevertheless, the optically prepared film is clearly brighter in the first 100 ps than the subsequent 100 ns.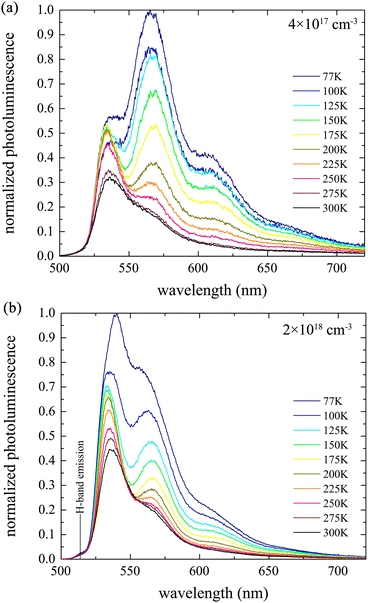 | ||
| Fig. 5 The quasi-steady state PL spectra of Tc thin films with exciton densities of (a) 4 × 1017 cm−3 and (b) 2 × 1018 cm−3. The pump wavelength was 500 nm and the data is normalized to the peak of the 77 K spectrum in both cases. | ||
Three peaks are observed at around 530–540, 565 and 610 nm at both exciton densities. At higher temperatures the relative intensities of these peaks are independent of exciton density. However, at low temperatures, the relative intensities of the peaks at 530 and 560 nm differ significantly as exciton density is changed.
The dynamics of the photoluminescence are vividly illustrated in Fig. 6 at two exciton densities and 100 K (other temperatures are included in the ESI†). At the lower density of 4 × 1017 cm−3, the peak emission moves from 535 nm to 560 nm in about 1 ns. This lower energy peak then relaxes further and remains for tens of ns. The time resolution of the plot in Fig. 6 is only about 2 ns, and so one must consider the plots in Fig. 3 simultaneously. The 535 nm emission relaxes on an 80 ps timescale, with the excitons evolving over into states which luminesce with a lower radiative rate. At this stage, without a clear identity, we will refer to the excitons that emit at 565 nm at low temperature as “dull”.
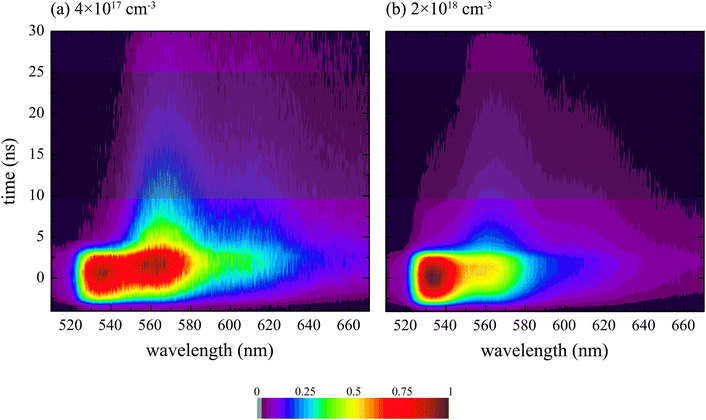 | ||
| Fig. 6 Contour map of nanosecond resolved PL spectra after pumping with a 500 nm laser pulse at 100 K for two exciton densities. The shaded region corresponds to the delayed fluorescence shown in Fig. 7. Other temperatures are shown in the ESI.† | ||
At higher exciton densities, one might expect a similar behaviour at identical temperature. After all, a higher exciton density must visit the lower exciton density during its dynamics, providing the excitons are indeed decaying, and not just dimming. But, there is a clear difference. As also shown in Fig. 5, the higher exciton density (Fig. 6b) yields much more emission from the J-band minimum. This also persists for some time as delayed fluorescence.
The shaded time-slice in Fig. 6 is integrated and shown in Fig. 7. The delayed fluorescence for temperatures below 200 K at an exciton density of 4 × 1017 cm−3 has little emission from the J-band minimum. Instead, the emission is dominated by the peak at 565 nm. The delayed fluorescence observed with an initial exciton density of 2 × 1018 cm−3 still contains significant emission that can be attributed to the J-band 0–0 transition.
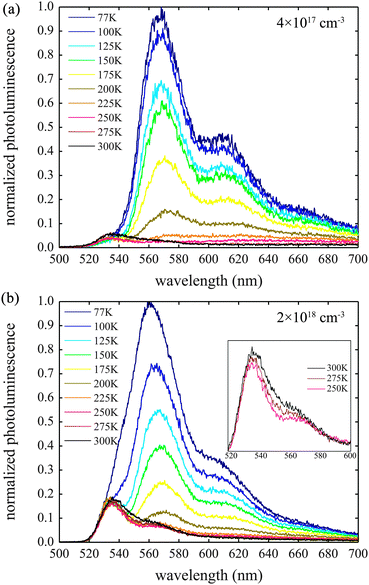 | ||
| Fig. 7 The delayed fluorescence (10–25 ns) spectra of Tc thin films with exciton densities of (a) 4 × 1017 cm−3 and (b) 2 × 1018 cm−3. The inset in (b) is a zoomed image of the delayed fluorescence at higher temperatures. The pump wavelength was 500 nm and the data is normalized to the peak of the 77 K spectrum in both cases. | ||
In order to further elucidate this trend, a series of measurements were carried out at 100 K at various initial exciton densities. The delayed fluorescence is shown in Fig. 8. At low excitation densities the emission corresponds solely to dull state emission. At higher exciton densities, the dull state emission remains, but emission also occurs from the J-band.
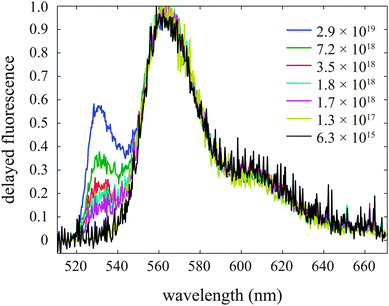 | ||
| Fig. 8 Delayed fluorescence (10–25 ns after excitation) of tetracene thin films at 100 K for several exciton densities (in units of cm−3). At low densities the peak in the range 530–540 nm is absent; as the initial exciton density exceeds ∼1018 cm−3 the peak is observed. | ||
3.4 Summary of observations
We are confronted with evidence that the picosecond decay constant of Tc is independent of temperature, and yet the optically prepared S1 state clearly dims on an 80 ps time scale. Whatever the nature of the dull state, access to it is not thermally activated, except at very low temperatures (∼4 K).54 This state remains populated at low temperature, but does not give rise to luminescence at higher temperatures. Further, at high exciton densities, where SSA was shown to operate, J-band emission is seen to persist, even at low temperatures. In the following, our results are discussed in the light of germane studies, notably those of Bardeen and co-workers,53–55 Zhu and co-workers (ref. 11 and 56), and the theoretical work of Zimmerman and co-workers.14,62,63 We put forward a hypothesis to explain the observations within a single conceptual framework.3.5 The identity of the dull state
It has been previously assumed that the state accessed after the 80 ps luminescence decay is a correlated singlet–triplet pair, and yet the energy of two triplets is unambiguously higher than the energy of the singlet.33 Nevertheless, several considerations suggest a relaxation of the singlet to a dull state with multiexciton (ME) character. Bardeen and co-workers have suggested the existence of a dark intermediate state previously.54,55Zhu and co-workers have shown in 2PPE emission experiments that the wavefunction prepared by a 100 fs laser pulse contains ME character.11,56 This indicates significant coupling between the crude Born–Oppenheimer single molecule basis, and hints at the mechanism for the dimming of S1.
Tetracene and anthracene are known to photodimerize in solution.64–69 This occurs on an excited singlet surface, and is known to be photoreversible. Furthermore, anthracene is known to dimerize in the crystalline phase, though it is believed to be initiated at the surface.70,71 Saltiel and co-workers considered the role of triplet–triplet annihilation in anthracene dimerization, and concluded that the singlet potential energy surface which gives rise to dimerization correlates to separated triplets.72 Indeed, following their S1 + S0 potential (Fig. 1 of ref. 72), a curve crossing occurs with T1 + T1 prior to formation of a bound pair and subsequent dimerization. This curve crossing, in solution, is essentially a singlet fission event. Clearly, motion along this path must couple the S1 + S0 and T1 + T1 diabatic states, as indicated in Fig. 9.
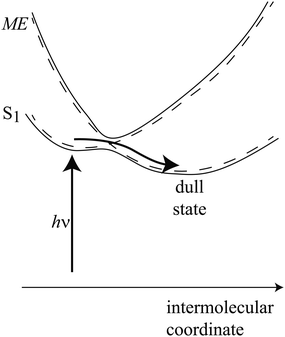 | ||
| Fig. 9 A cartoon representation of the adiabatic path from S1 to the dull state. The diabatic states are indicated with dashed lines. | ||
Zimmerman and co-workers have investigated the excited states of tetracene and pentacene clusters embedded in a crystal lattice, using ab initio techniques.14,62,63 They find a curve crossing between the excited singlet and ME states in pentacene which is accessed through an intermolecular coordinate which brings two acene units closer together. Non-adiabatic coupling on the two surfaces satisfactorily explains the ultrafast singlet fission in pentacene. These researchers also find that the S1 state of tetracene is stabilized along this coordinate.
Now, considering the potential energy curves of anthracene and its ability to dimerize (at least at the surface) in the crystalline phase, it can be reasonably hypothesized that crystalline tetracene moves along a coordinate towards (frustrated) dimerization, since tetracene also photodimerizes in solution. Along this coordinate, the S1 will couple to the ME state, and become dimmer. We suggest that it is this dimming, by aqcuiring ME character, that is responsible for the 80 ps decay of photoluminescence. This is consistent with the observations of Chan et al., where peaks in the 2PPE spectrum corresponding to leaving a triplet-plus-hole behind in the crystal are observed immediately after fs laser excitation.56 Put simply, the prepared S1 state has ME character, formally arising through configuration interaction. In Fig. 9, we illustrate how the two adiabatic curves can be brought about by the interaction of two adiabats, in a similar way to Fig. 1 of ref. 14. The optically accessed region is “bright” (but contains ME character), and there is a very small barrier to accessing the “dull” region, which contains a smaller amount of S1 character. The difference between the thermal behaviour of the picosecond luminescence decay lifetime in single crystals, as compared to noncrystalline films as observed by Bardeen and coworkers,55 is consistent with this picture, if small defects or crystallite surfaces suppress barriers along the intermolecular coordinate.
At high temperatures, the acquired ME character allows the system to access states where the triplets are spatially separated (entropically driven56), but remain spin-coherent and coupled to S1, exhibiting quantum beats in the photoluminescence arising from triplet–triplet annihilation.55 At lower temperatures, quantum beats are not observed as the system relaxes into the dull state, and subsequently emits slow, red-shifted light. At very low temperatures (∼4 K) motion along this coordinate is frozen out, implying a small barrier.54
At high exciton densities, SSA has been shown to operate, and this excites some higher singlet excitons which could lead to population of the ME and separated triplet states, even at low temperature. Subsequent annihilation of these triplets gives rise to J-band emission, explaining the behaviour observed in Fig. 8. This delayed J-band emission increases with temperature, as shown in the inset to Fig. 7b, which is likely due to increased mobility of the free triplets at higher temperatures, giving rise to a higher probability for annihilation.
It is not immediately clear why the annihilation does not simply feed S1 and the dull state at low temperatures. One explanation is that the annihilating triplet pair states possess S1 character through configurational mixing. This would lend oscillator strength to the emission, occuring at approximately the same geometry as the ground state. But, the energy of this emission should then be higher than the J-band, since the energy of two triplets is higher than the S1 state. A geometry shift could explain the lower energy emission, but then its appearance would be different to that of the J-band emission. Fig. 8 indeed suggests that at low temperature, only the band at 530 nm grows in at high exciton density, and the shape of the dull state emission is unchanged. At this stage, the details of the process giving rise to J-band emission through triplet–triplet annihilation are unresolved.
3.6 The mechanism of singlet fission in tetracene
The observation of quantum beats in the delayed fluorescence of Tc at high temperatures indicates a direct pathway from vibrationally excited S1 levels to separated triplets.55 However, the ultrafast dynamics implies this to be a minor pathway for fission, since the decay of the brightness of S1 is temperature independent. Instead, the initial motion is along the intermolecular coordinate identified by Head-Gordon and coworkers.14,62 Adiabatically, the ME character increases along this coordinate and the state dims. The increased ME character increases the rate of thermally activated accession of the separated triplets.Zhu and co-workers claim that the energy barrier for singlet fission in tetracene is overcome by coherent coupling, and put forward a phenomenological density matrix model to justify their case.56 Their 3 × 3 Hamiltonian contains energies of three states, S0, S1 and ME (multiple exciton) on the diagonal, with time dependent coupling −μE(t) between S0 and S1, and a time-independent coupling, −W23 between S1 and ME. Decoherence rates Γ22 and Γ33 are included for the S1 and ME states, to take account of radiative and non-radiative decay of S1, and depopulation of ME into triplets which are uncoupled to S1. Γ33 is set to zero in the model. A pure dephasing time is also included, with a rate of Γ* = 20 ps−1, which decoheres the superposition of S1 and ME.
Numerically integrating the Liouville equations, one arrives at the not surprising finding that the resonance position for population of the S1 and ME is shifted to lower energies than the supposed energy of the S1 state. This is because the bright eigenstate of the Hamiltonian is not S1, but rather a mixture of S1 and ME. Further, at times long after the application of a laser pulse, one finds equal populations in S1 and ME, which suggests that monochromatic radiation can bring about a state of higher energy than the incident photons. Also, this model predicts that a higher energy resonance is optically accessible, populating the ME state directly.
Using the formalism and notation of Zhu and coworkers (see the supplementary information in ref. 56), the expectation value of the energy in a two level system of S1 and ME (|2〉 and |3〉) is given by
| 〈ε〉 = 〈Ψ|Ĥ|Ψ〉 = ρ22〈2|Ĥ|2〉 + ρ33〈3|Ĥ|3〉 + ρ23〈2|Ĥ|3〉 + ρ32〈3|Ĥ|2〉 = ρ22ε2 + ρ33ε3 + 2ℜ(ρ32)H32. | (4) |
In Zhu and co-worker's model, the S1 and ME states are populated by optical excitation from S0, but the pure dephasing term causes an exponential decay of ρ32 and ρ23, in the absence of changes to ρ22 and ρ33 (a small Γ22 is implemented). Inspection of eqn (4) reveals that such a term does not conserve energy, and in this case must draw energy from a bath. However, the argument of Zhu and co-workers is that barriers are overcome due to quantum coherence, and not temperature.56 One concludes that the density matrix model is unphysical.
Zhu and co-workers have recently updated their density matrix formulation to include a charge transfer intermediate.11 In this report they explicitly point out that the “energy change is accomplished through coupling to the environment via the dephasing term”. The microscopic explanation of this decoherence in terms of vibrational relaxation explains the SF mechanism in pentacene, but in tetracene it is lacking.
4 Conclusions
The model proposed in this paper unites several key pieces of information which were hitherto seemingly contradictory. Considering the evidence, we agree that the energy of two separated triplets in tetracene is higher than the S1 state. That the picosecond dynamics, showing decay of the S1 photoluminescence, is temperature independent means that it must access a much darker state that is lower in energy. Because there are no basis functions available lower in energy than S1 (except T1, which is much, much lower), one is forced to conclude that the motion is along the adiabatic curve identified by Head-Gordon and co-workers.14,62 Since Zhu and co-workers observe ME character in this state, the S1 and ME diabats must be coupled.11,56 An avoided crossing between the adiabatic S1 and ME potential energy curves would lead to the observed dimming of the singlet exciton, and we propose that this explains the initial 80 ps decay. This is in accord with considerations of the propensity of acences towards photodimerization. At low temperatures, red shifted emission persists due to residual S1 character in the electronic wavefunction. But, at higher temperatures, separated triplet states are accessed thermally and photoluminescence is largely quenched. These separated triplets are only weakly coupled, as inferred from the quantum beats observed by Bardeen and co-workers.55 That the quantum beats are quenched at 200 K accords with the present model, as the exciton is trapped on the dull part of the S1 adiabat.As exciton density increases, SSA cannot be ignored; we report a rate constant of 1.70 ± 0.08 × 10⁻⁸ cm3 s−1 at 100 K. Furthermore, SSA can give rise to free triplets, which subsequently annihilate, generating delayed fluorescence at the energy of the J-band emission, the detailed explanation of which remains to be elucidated.
Acknowledgements
We are indebted to the Australian National Fabrication Facility for performing the thermal deposition of the tetracene thin films. M.J.Y.T. acknowledges the receipt of an Australian Postgraduate Award. R.G.C.R.C. thanks the Australian Solar Institute for a research fellowship. This work was supported by The University of Sydney (RIMS 2009-02619-Molecular materials for 3rd generation photovoltaics). This research was supported under Australian Research Council's Discovery Projects funding scheme (project number DP110103300). We thank Dane McCamey and Jeff Reimers for stimulating discussion.References
- W. Shockley and H. J. Queisser, J. Appl. Phys., 1961, 32, 510–519 CrossRef CAS.
- M. C. Hanna and A. J. Nozik, J. Appl. Phys., 2006, 100, 074510 CrossRef.
- N. C. Giebink, G. P. Wiederrecht, M. R. Wasielewski and S. R. Forrest, Phys. Rev. B: Condens. Matter Mater. Phys., 2011, 83, 195326 CrossRef.
- M. J. Y. Tayebjee, L. C. Hirst, N. Ekins-Daukes and T. W. Schmidt, J. Appl. Phys., 2010, 108, 124506 CrossRef.
- M. D. McGehee, Science, 2011, 334, 607–608 CrossRef CAS.
- M. B. Smith and J. Michl, Chem. Rev., 2010, 110, 6891–6936 CrossRef CAS.
- M. B. Smith and J. Michl, Annu. Rev. Phys. Chem., 2013, 64, 361–386 CrossRef CAS.
- T. C. Berkelbach, M. S. Hybertsen and D. R. Reichman, J. Chem. Phys., 2013, 138, 114102 CrossRef.
- T. C. Berkelbach, M. S. Hybertsen and D. R. Reichman, J. Chem. Phys., 2013, 138, 114103 CrossRef.
- J. Lee, P. Jadhav, P. D. Reusswig, S. R. Yost, N. J. Thompson, D. N. Congreve, E. Hontz, T. Van Voorhis and M. A. Baldo, Acc. Chem. Res., 2013, 46, 1300–1311 CrossRef CAS.
- W.-L. Chan, T. C. Berkelbach, M. R. Provorse, N. R. Monahan, J. R. Tritsch, M. S. Hybertsen, D. R. Reichman, J. Gao and X. Y. Zhu, Acc. Chem. Res., 2013, 46, 1321–1329 CrossRef CAS.
- J. C. Johnson, A. J. Nozik and J. Michl, Acc. Chem. Res., 2013, 1290–1299 CrossRef CAS.
- J. J. Burdett and C. J. Bardeen, Acc. Chem. Res., 2013, 46, 1312–1320 CrossRef CAS.
- P. M. Zimmerman, C. B. Musgrave and M. Head-Gordon, Acc. Chem. Res., 2013, 46, 1339–1347 CrossRef CAS.
- M. J. Y. Tayebjee, A. A. Gray-Weale and T. W. Schmidt, J. Phys. Chem. Lett., 2012, 3, 2749–2754 CrossRef CAS.
- P. J. Jadhav, A. Mohanty, J. Sussman, J. Lee and M. A. Baldo, Nano Lett., 2011, 11, 1495–1498 CrossRef CAS.
- B. Ehrler, M. W. B. Wilson, A. Rao, R. H. Friend and N. C. Greenham, Nano Lett., 2012, 12, 1053–1057 CrossRef CAS.
- A. Rao, M. W. B. Wilson, J. M. Hodgkiss, S. Albert-Seifried, H. Bässler and R. H. Friend, J. Am. Chem. Soc., 2010, 132, 12698–12703 CrossRef CAS.
- D. N. Congreve, J. Lee, N. J. Thompson, E. Hontz, S. R. Yost, P. D. Reusswig, M. E. Bahlke, S. Reineke, T. Van Voorhis and M. A. Baldo, Science, 2013, 340, 334–337 CrossRef CAS.
- V. K. Thorsmølle, R. D. Averitt, J. Demsar, D. L. Smith, S. Tretiak, R. L. Martin, X. Chi, B. K. Crone, A. P. Ramirez and A. J. Taylor, Phys. Rev. Lett., 2009, 102, 017401 CrossRef.
- V. K. Thorsmølle, R. D. Averitt, J. Demsar, D. L. Smith, S. Tretiak, R. L. Martin, X. Chi, B. K. Crone, A. P. Ramirez and A. J. Taylor, Physica B, 2009, 404, 3127–3130 CrossRef.
- A. Rao, M. W. B. Wilson, S. Albert-Seifried, R. Di Pietro and R. H. Friend, Phys. Rev. B: Condens. Matter Mater. Phys., 2011, 84, 195411 CrossRef.
- W. L. Chan, M. Ligges, A. Jailaubekov, L. Kaake, L. Miaja-Avila and X. Y. Zhu, Science, 2011, 334, 1541–1545 CrossRef CAS.
- S. P. McGlynn, M. R. Padhye and M. Kasha, J. Chem. Phys., 1955, 23, 593–594 CAS.
- S. P. McGlynn, M. Kasha and T. Azumi, J. Chem. Phys., 1964, 40, 507 CrossRef CAS.
- A. A. Kazzaz and A. B. Zahlan, J. Chem. Phys., 1968, 48, 1242 CrossRef CAS.
- M. Pope, N. Geacintov and F. Vogel, Mol. Cryst. Liq. Cryst., 1969, 6, 83 CrossRef CAS.
- G. Vaubel and H. Baessler, Phys. Status Solidi B, 1970, 37, K31–K34 CrossRef CAS.
- G. Vaubel and H. Baessler, Mol. Cryst. Liq. Cryst., 1970, 12, 39 CrossRef CAS.
- R. P. Groff, P. Avakian and R. E. Merrifield, Phys. Rev. B: Solid State, 1970, 1, 815–817 CrossRef.
- R. P. Groff, P. Avakian and R. E. Merrifield, J. Lumin., 1970, 1–2, 218–223 CrossRef.
- V. Ern, J. L. Saint-Clair, M. Schott and G. Delacote, Chem. Phys. Lett., 1971, 10, 287–290 CrossRef CAS.
- Y. Tomkiewicz, R. P. Groff and P. Avakian, J. Chem. Phys., 1971, 54, 4504 CrossRef CAS.
- Y. H. Meyer, R. Astier and J. M. Leclercq, J. Chem. Phys., 1972, 56, 801 CrossRef CAS.
- T. G. Pavlopoulos, J. Chem. Phys., 1972, 56, 227–232 CrossRef CAS.
- P. Delannoy and M. Schott, Phys. Status Solidi B, 1975, 70, 119–131 CrossRef CAS.
- W. Hofberger, Phys. Status Solidi A, 1975, 30, 271–278 CrossRef CAS.
- M. Chopp, L. Yarmus, J. Rosenthal and C. E. Swenberg, Bull. Am. Phys. Soc., 1976, 21, 74 Search PubMed.
- G. Fleming, D. Millar, G. Morris, J. Morris and G. Robinson, Aust. J. Chem., 1977, 30, 2353–2359 CrossRef CAS.
- A. J. Campillo, R. C. Hyer, S. L. Shapiro and C. E. Swenberg, Chem. Phys. Lett., 1977, 48, 495–500 CrossRef CAS.
- N. F. Berk, J. Rosenthal, L. Yarmus and C. E. Swenberg, Phys. Status Solidi B, 1977, 83, K1–K6 CrossRef CAS.
- R. Jankowiak, J. Kalinowski, M. Konys and J. Buchert, Chem. Phys. Lett., 1979, 65, 549–553 CrossRef CAS.
- D. D. Kolendritskii, M. V. Kurik and Y. P. Piryatinskii, Phys. Status Solidi B, 1979, 91, 741–751 CrossRef CAS.
- R. Hesse, W. Hofberger and H. Bassler, Chem. Phys., 1980, 49, 201–211 CrossRef CAS.
- G. Peter and H. Bassler, Chem. Phys., 1980, 49, 9–16 CrossRef CAS.
- W. Bizzaro, L. Yarmus, J. Rosenthal and N. F. Berk, Phys. Rev. B: Condens. Matter Mater. Phys., 1981, 23, 5673–5675 CrossRef CAS.
- S. Arnold and W. B. Whitten, J. Chem. Phys., 1981, 75, 1166–1169 CrossRef CAS.
- H. Nishimura, T. Yamaoka, A. Matsui, K. Mizuno and G. J. Sloan, J. Phys. Soc. Jpn., 1985, 54, 1627–1633 CrossRef CAS.
- F. Lewitzka and H. G. Lohmannsroben, Z. Phys. Chem., Neue Folge, 1986, 150, 69–86 CrossRef CAS.
- A. Wappelt, A. Bergmann, A. Napiwotzki, H. J. Eichler, H. J. Jupner, A. Kummrow, A. Lau and S. Woggon, J. Appl. Phys., 1995, 78, 5192–5194 CrossRef CAS.
- S.-H. Lim, T. G. Bjorklund, F. C. Spano and C. J. Bardeen, Phys. Rev. Lett., 2004, 92, 107402 CrossRef.
- M. Voigt, A. Langner, P. Schouwink, J. M. Lupton, R. F. Mahrt and M. Sokolowski, J. Chem. Phys., 2007, 127, 4705 CrossRef.
- J. J. Burdett, A. M. Muller, D. Gosztola and C. J. Bardeen, J. Chem. Phys., 2010, 133, 4506 CrossRef.
- J. J. Burdett, D. Gosztola and C. J. Bardeen, J. Chem. Phys., 2011, 135, 4508 CrossRef.
- J. J. Burdett and C. J. Bardeen, J. Am. Chem. Soc., 2012, 134, 8597–8607 CrossRef CAS.
- W. L. Chan, M. Ligges and X. Y. Zhu, Nat. Chem., 2012, 4, 840–845 CrossRef CAS.
- H. Ohigashi, I. Shirotani, H. Inokuchi and S. Minomura, J. Chem. Phys., 1965, 43, 314 CrossRef CAS.
- A. S. Davydov, Theory of molecular excitons, Plenum Press, New York, 1961 Search PubMed.
- L. Yarmus, J. Rosentha and M. Chopp, Chem. Phys. Lett., 1972, 16, 477 CrossRef CAS.
- S. M. Bachilo and R. B. Weisman, J. Phys. Chem. A, 2000, 104, 7711–7714 CrossRef CAS.
- E. M. Grumstrup, J. C. Johnson and N. H. Damrauer, Phys. Rev. Lett., 2010, 105, 7403 CrossRef.
- P. M. Zimmerman, F. Bell, D. Casanova and M. Head-Gordon, J. Am. Chem. Soc., 2011, 133, 19944–19952 CrossRef CAS.
- P. M. Zimmerman, Z. Y. Zhang and C. B. Musgrave, Nat. Chem., 2010, 2, 648–652 CrossRef CAS.
- F. D. Greene, S. L. Misrock and J. R. Wolfe, J. Am. Chem. Soc., 1955, 77, 3852–3855 CrossRef CAS.
- J. B. Birks, J. H. Appleyard and R. Pope, Photochem. Photobiol., 1963, 2, 493–495 CrossRef CAS.
- E. A. Chandross and J. Ferguson, J. Chem. Phys., 1966, 45, 397–398 CrossRef CAS.
- J. A. Katul and A. B. Zahlan, J. Chem. Phys., 1967, 47, 1012–1014 CrossRef CAS.
- K. S. Wei and R. Livingston, Photochem. Photobiol., 1967, 6, 229–232 CrossRef CAS.
- G. W. Breton and X. Vang, J. Chem. Educ., 1998, 75, 81–82 CrossRef CAS.
- E. A. Chandross and J. Ferguson, J. Chem. Phys., 1966, 45, 3564–3567 CrossRef CAS.
- M. Odonnell, Nature, 1968, 218, 460–461 CrossRef CAS.
- J. L. Charlton, R. Dabestani and J. Saltiel, J. Am. Chem. Soc., 1983, 105, 3473–3476 CrossRef CAS.
Footnotes |
| † Electronic supplementary information (ESI) available. See DOI: 10.1039/c3cp52609g |
| ‡ Present address: School of Photovoltaic and Renewable Energy Engineering, The University of New South Wales, Kensington, New South Wales 2052, Australia. |
| § Present address: Laboratoire LP3, Parc Scientifique et Technologique de Luminy, 163, Avenue de Luminy, FR-13288 Marseille Cedex 9, France. |
| This journal is © the Owner Societies 2013 |
