 Open Access Article
 This Open Access Article is licensed under a
 Creative Commons Attribution 3.0 Unported Licence
Chemically synthesised atomically precise gold clusters deposited and activated on titania. Part II†
David P.
Anderson
a,
Rohul H.
Adnan
ab,
Jason F.
Alvino
c,
Oliver
Shipper‡
c,
Baira
Donoeva
a,
Jan-Yves
Ruzicka
a,
Hassan
Al Qahtani
d,
Hugh H.
Harris
c,
Bruce
Cowie
e,
Jade B.
Aitken
f,
Vladimir B.
Golovko
*a,
Gregory F.
Metha
*c and
Gunther G.
Andersson
*d
aThe MacDiarmid Institute for Advanced Materials and Nanotechnology, and Department of Chemistry, University of Canterbury, Christchurch 8140, New Zealand. E-mail: vladimir.golovko@canterbury.ac.nz
bChemistry Department, University of Malaya, 50603 Kuala Lumpur, Malaysia
cSchool of Chemistry and Physics, The University of Adelaide, Adelaide, SA 5005, Australia. E-mail: greg.metha@adelaide.edu.au
dFlinders Centre for NanoScale Science and Technology, Flinders University, Adelaide, SA 5001, Australia. E-mail: gunther.andersson@flinders.edu.au
eAustralian Synchrotron, 800 Blackburn Road, Clayton Vic-3168, Australia
fSchool of Chemistry, The University of Sydney, Sydney 2006, Australia
First published on 24th July 2013
Abstract
Synchrotron XPS was used to investigate a series of chemically synthesised, atomically precise gold clusters Aun(PPh3)y (n = 8, 9 and 101, y depending on the cluster size) immobilized on anatase (titania) nanoparticles. Effects of post-deposition treatments were investigated by comparison of untreated samples with analogues that have been heat treated at 200 °C in O2, or in O2 followed by H2 atmosphere. XPS data shows that the phosphine ligands are oxidised upon heat treatment in O2. From the position of the Au 4f7/2 peak it can be concluded that the clusters partially agglomerate immediately upon deposition. Heating in oxygen, and subsequently in hydrogen, leads to further agglomeration of the gold clusters. It is found that the pre-treatment plays a crucial role in the removal of ligands and agglomeration of the clusters.
Introduction
Gold particles with a size reduced below 5 nanometres are known to be catalytically active.1–3 Moreover, it has been demonstrated that the onset of catalytic activity of gold often coincides with the loss of metallic properties of Au nanoparticles at around 1.5–2 nm. This size-threshold is established for both naked clusters prepared under UHV conditions4 and chemically-synthesised5,6 well-defined metal nanoparticles immobilized onto inert supports. Metal clusters can be deposited from the gas phase as size selected clusters7–15 or through electrospray ionisation6 or from the liquid phase when using chemically synthesised nanoparticles.16,17 The latter route offers the huge benefit of easy scale-up. Removal of ligands is often postulated as a necessary step for making the adsorption sites at the surface of the clusters catalytically active.We have previously studied the properties of a series of chemically made atomically precise clusters deposited on the popular P-25 Aeroxide, a mixture of nanosized anatase and rutile, which was pre-treated with acid prior to deposition of clusters. We have shown that calcination (heat-treatment in vacuum) and washing in hot toluene results in the removal of some clusters from the P-25 surface.16 Of the clusters remaining on the titania surface, one fraction is virtually unchanged (from the untreated form), whereas another fraction shows formation of Au–O bonds, most likely to the oxygen of the titania surface. No significant agglomeration nor complete removal of phosphine ligands from the clusters could be inferred from the observed XPS spectra. Heating of the support-immobilised clusters under vacuum at 200 °C has two effects. First, the ultra-small clusters aggregate to form slightly larger gold particles that are still protected by phosphine ligands. The average size of the aggregated clusters was estimated to be marginally smaller than that of the untreated Au101. Second, a fraction of gold clusters exhibit Au–O bonds, most likely to the oxygen of the titania surface, which coincides with the loss of phosphine ligands and formation of oxidised phosphorous species.
Similar heat treatment has been used in other studies for fabricating catalysts based on chemically synthesised clusters and colloids.5,18,19 Zanella et al. focused on the parameters of thermal treatment that influence the gold particle size in Au/TiO2 samples prepared by different methods.20 It has been previously shown that the type of chemical atmosphere during heat treatment of the Au–TiO2 catalysts also has a pronounced effect on the evolution of particle size. Heat-treatment of ligand stabilised clusters has been performed in an oxygen rich atmosphere, which facilitates ligand removal due to their partial or even complete oxidation,21 while in other cases oxygen plasma was used for ligand removal.22 Finally, removal of protecting thiol ligands was recently achieved using strong oxidants (KMnO4 and K2MnO4), although post-treatment calcination was still required to “burn off” residual organic species.23 Activation in an oxidative atmosphere is suggested to be more efficient compared to activation under a purely reducing (H2) atmosphere, which failed to remove thiol ligands completely from support-immobilised chemically-made clusters even after 8 hours at 563 K.24
The aim of the present work is an investigation of the influence of oxidative treatments on the size and environment of gold clusters deposited on untreated titania. Similar to our previous study,16 we apply X-ray photoelectron spectroscopy (XPS) of Au and P to analyse the chemical state and possible agglomeration of the gold clusters deposited onto titania. The Au peak position is influenced by the size of the clusters through the final state effect,25 which has been used by many others to relate XPS binding energy to size of a metal cluster.8,9,17,26–30 In particular, we focus on the question of whether the employed treatments remove the ligands and if it impacts on the agglomeration of the metal cores.
Experimental
A. Materials
Anatase nanoparticles (99.8%) with a particle size of about 10 nm and surface area of ca. 50 m2 g−1, were supplied by SkySpring Nanomaterials, Inc., USA and used for immobilisation of clusters without any pre-treatment. Chemically synthesised, atomically precise gold clusters Aun(PPh3)y (n = 8, 9, 11 and 101, with y depending on cluster size) were prepared and purified using the same procedure reported by us and others.16 Instrument grade O2 (99.2% with <10 ppm H2O, Southern Gas Services Ltd) and H2 (99.98% with <20 ppm H2O, BOC) gases were used for the post-treatments.B. Deposition of clusters onto support
The clusters were deposited onto the support using the method reported by Zhu et al.31 First, the calculated amount of support was dried in the Schlenk tube under vacuum at 200 °C with stirring overnight (12 h). Upon cooling to room temperature the support was suspended in dichloromethane (AR grade, 50 mL) using vigorous stirring (750 rpm, magnetic stirrer bar). A solution of calculated amount of metal cluster in dichloromethane (20 mL) was added to the suspension of titania under vigorous stirring at room temperature and the mixture was left stirring overnight (12 h). The mixture was then dried in vacuum at room temperature and stored under refrigeration. For the purpose of this study we focused on materials with 0.17 weight (wt)% Au (i.e. ratio of the weight of the Au due to presence of clusters relative to the titania particles). This specific level of loading with clusters was chosen to minimise aggregation and still be able to study these materials using synchrotron XPS. In selected cases, cluster loading on anatase was reduced two-fold to 0.08 wt% Au in order to investigate the effect of loading.C. Treatments of support-immobilised clusters
In this study, we investigated two heat treatments of support-immobilised clusters: (a) calcination under pure O2 atmosphere at 200 °C for 2 h and (b) calcination under pure O2 at 200 °C for 2 h followed by calcination in H2 at 200 °C for 2 h. In all cases atmospheric pressure of the corresponding gas was used.Typically, a Schlenk tube containing ca. 500 mg of anatase with supported cluster at 0.17 or 0.08 wt% Au and a magnetic stirrer bar was wrapped in foil to prevent exposure to light and connected to the Schlenk line which was connected to a pure O2 cylinder. The Schlenk tube was evacuated and refilled with oxygen while at room temperature. This vacuum–O2 cycle was repeated at least three times to ensure pure oxygen atmosphere. The Schlenk tube was then placed into a preheated oil bath on a hotplate-stirrer maintained at 200 °C via a direct thermocouple-controlled feedback loop. Oxygen flow through the Schlenk line to which the Schlenk flask was attached was maintained at the rate of ca. 1 bubble per second. Heating at 200 °C with magnetic stirring continued for 2 hours. After this period the Schlenk tube was pulled from the oil bath and allowed to cool to room temperature.
In the case of O2 activation followed by H2 treatment, the Schlenk tube was subsequently attached to another Schlenk line connected to a H2 cylinder. A cycle of evacuation followed by filling with H2 was repeated at least three times at room temperature to ensure pure H2 atmosphere. After filling the Schlenk tube with H2 the heat-treatment was performed using pre-heated oil bath as described above. All the treated catalysts were stored in the dark at 4 °C.
D. Synchrotron XPS beamline and sample preparation
A suspension of the support-immobilised cluster was made up in dichloromethane at a concentration of ca. 1 mg mL−1. A 10 μL drop of each sample was deposited onto a clean 6 × 6 mm silicon (Si) wafer and dried in air. Each sample was then fixed by double-sided copper tape onto a gold-plated holder; up to 6 samples were affixed onto each plate for XPS analysis.Photoelectron spectra were recorded at the Soft X-ray Beamline at the Australian Synchrotron (AS) using a SPECS Phoibos 150 hemispherical electron analyser with the photon energy set to 690 eV. The beam was adjusted to an irradiation spot size of ∼600 × 600 μm, providing an X-ray photon flux of approximately 1012 photons mm−2 s−1, conditions that we have recently shown not to induce thermal damage to samples of NaAuCl4.32 High resolution XPS spectra of C, O, Si, P, Ti and Au were recorded at a pass energy of 10 eV, yielding an instrumental resolution of 295 meV.33 Scans were repeated several times to ensure that no photon-induced changes occurred in the samples. The stability of the X-ray energy was monitored using a bulk gold reference.
For all XPS spectra, a Shirley background was first applied to remove the electron-scattering background and maintain the intrinsic line shape from the raw data.34,35 A pseudo-Voigt function composed of the sum of Gaussian (30%) and Lorentzian (70%) functions was used to fit all peaks and all peak positions were allowed to vary using nonlinear least-squares minimization.36 For the Au 4f doublet, splitting was fixed at 3.67 eV while for the P 2p doublet a splitting of 0.84 eV was used.37 All spectra where fitted with the least number of peaks allowing a variation of the FWHM, although the FWHM of a single contributing species was kept constant. For example, in the case of a gold spectrum fitted with two sets of 4f7/2 and 4f5/2 doublets, the FWHM within a single doublet was kept constant but was allowed to differ between the doublets. In order to illustrate the fitting procedure, the fits to the Au8 spectra are shown in the ESI.†
Cross sections were calculated according to Yeh and Lindau using the photoionization cross section and the asymmetry parameter.38 The angle between the sample normal and the analyser was 10° which means that the angle between the incident horizontal linearly polarised synchrotron beam and the sample surface was 45°.
E. X-ray absorption spectroscopy (XAS)
Au LIII-edge X-ray absorption spectra were recorded at the Australian National Beamline Facility (ANBF, beamline 20B) at the Photon Factory, Tsukuba, Japan. Harmonic rejection was achieved by detuning a channel-cut Si[111] monochromator by 50%. Unsupported clusters were recorded in transmission mode as pressed pellets with a 1![[thin space (1/6-em)]](https://www.rsc.org/images/entities/char_2009.gif) :5 dilution in cellulose. Supported cluster samples were recorded neat in fluorescence mode with the sample suspended in a 1 × 5 mm aluminium sample holder secured between Kapton tape, measured using a 36-pixel Ge-monolith fluorescence detector (Canberra/Unisys) at 90° to the incident beam. All data was collected at ∼15 K using a closed-cycle He cryostat. The following energy ranges were used for X-ray absorption near-edge structure (XANES) data collection: pre-edge region from 11700 to 11900 eV (10 eV steps), XANES region from 11900 to 11960 eV (0.5 eV steps), and post-edge region from 11960 to 13145 eV (0.05 Å−1 steps in k-space). An Au(s) foil standard was used to calibrate the energy scale to the first peak of the first derivative of the Au LIII edge (assumed to be 11920 eV). Data analysis, including calibration, averaging, background subtraction of all spectra and linear regression analysis of selected XANES spectra were performed using EXAFSPAK (G. N. George, SSRL).
:5 dilution in cellulose. Supported cluster samples were recorded neat in fluorescence mode with the sample suspended in a 1 × 5 mm aluminium sample holder secured between Kapton tape, measured using a 36-pixel Ge-monolith fluorescence detector (Canberra/Unisys) at 90° to the incident beam. All data was collected at ∼15 K using a closed-cycle He cryostat. The following energy ranges were used for X-ray absorption near-edge structure (XANES) data collection: pre-edge region from 11700 to 11900 eV (10 eV steps), XANES region from 11900 to 11960 eV (0.5 eV steps), and post-edge region from 11960 to 13145 eV (0.05 Å−1 steps in k-space). An Au(s) foil standard was used to calibrate the energy scale to the first peak of the first derivative of the Au LIII edge (assumed to be 11920 eV). Data analysis, including calibration, averaging, background subtraction of all spectra and linear regression analysis of selected XANES spectra were performed using EXAFSPAK (G. N. George, SSRL).
Results and discussion
A. XPS results
XPS spectra were recorded at the Au 4f, P 2p, Si 2p, Ti 2p, C 1s and O 1s regions for all samples of Aun clusters deposited on titania nanoparticles, and also from a gold reference sample. The majority of carbon signal arises from either the triphenylphosphine ligands or adventitious hydrocarbons. In either case, we fix the C 1s peak to 285 eV and use it for calibrating the peak positions of other elements. This is justified because adventitious hydrocarbons display a very constant C 1s peak position that is present in all samples exposed to air (and not cleaned by sputtering prior to XPS measurements).41 The titanium signal measured is exclusively due to the titania nanoparticles and found at 459.1 ± 0.1 eV. The silicon signal is due to the silicon wafer used as substrate and found at 98.9 ± 0.2 eV (Si) and 102.6 ± 0.3 eV (SiO2). The oxygen signal is mostly due to titanium dioxide (530.4 ± 0.2 eV) and silicon dioxide (531.9 ± 0.3 eV). Gold and phosphorous signals from the clusters are found in the regions 83.6–85.6 eV and 131.9–133.4 eV, respectively, and are used for quantitative analysis. Using the energy calibration described above, Au 4f7/2 of bulk gold is usually found at a binding energy of 84.0 eV. This value is used to determine the shift between the Au 4f7/2 signal of the gold clusters and the bulk gold binding energy. The variation of the silicon signals relative to the gold reference is less than 0.1 eV, and that of the titanium signal less than 0.25 eV, indicating that there is no significant charging of the samples or instability in the X-ray energy.
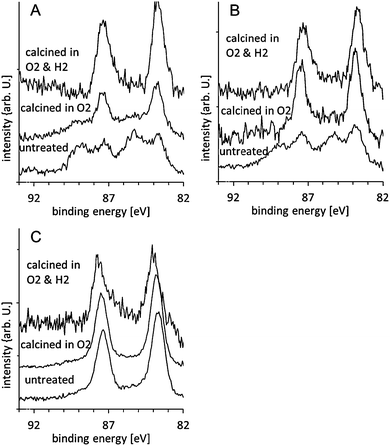 | ||
| Fig. 1 Au XPS spectra of gold clusters supported on anatase nanoparticles untreated, calcined in O2 at 200 °C, and calcined in O2 and subsequently in H2 at 200 °C: (A) Au8, (B) Au9 and, (C) Au101. The spectra are normalised such that the total Au intensity is the same for all spectra. | ||
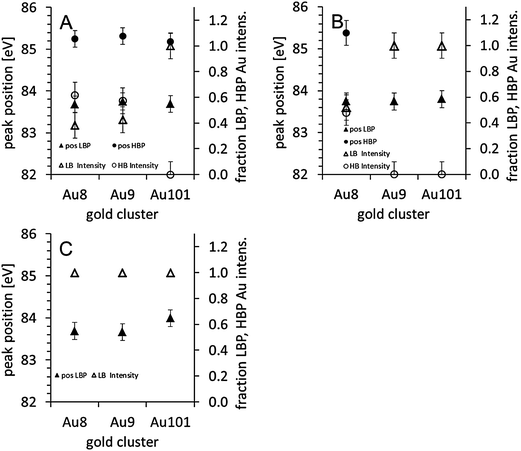 | ||
| Fig. 2 Position of the LBP-Au and HBP-Au and the fraction of the LBP and HBP Au peak as part of the total Au intensity: (A) as deposited, (B) after calcination in O2 at 200 °C, and (C) after calcination in O2 and subsequently in H2 at 200 °C. | ||
| Untreated | O2 treatment | O2 and H2 treatment | ||||||||
|---|---|---|---|---|---|---|---|---|---|---|
| Energy [eV] | FWHM [eV] | Int. ratio HBP/LBP | Energy [eV] | FWHM [eV] | Int. ratio HBP/LBP | Energy [eV] | FWHM [eV] | Int. ratio HBP/LBP | ||
| Au8 | LBP | 83.7 ± 0.1 | 1.1 ± 0.2 | 83.7 ± 0.1 | 1.0 ± 0.2 | 83.7 ± 0.1 | 1.0 ± 0.2 | |||
| HBP | 85.3 ± 0.2 | 1.5 ± 0.2 | 85.4 ± 0.2 | 2.2 ± 0.1 | — | — | ||||
| 1.6 ± 0.3 | 0.9 ± 0.2 | 0 ± 0.2 | ||||||||
| Au9 | LBP | 83.7 ± 0.1 | 1.1 ± 0.2 | 83.7 ± 0.1 | 1.0 ± 0.2 | 83.7 ± 0.1 | 1.0 ± 0.2 | |||
| HBP | 85.3 ± 0.2 | 1.9 ± 0.2 | — | — | — | — | ||||
| 1.3 ± 0.3 | 0 ± 0.2 | 0 ± 0.2 | ||||||||
| Au101 | LBP | 83.7 ± 0.1 | 1.0 ± 0.2 | 83.8 ± 0.1 | 1.0 ± 0.2 | 84.0 ± 0.1 | 1.0 ± 0.2 | |||
| HBP | — | — | — | — | — | — | ||||
| 0 ± 0.2 | 0 ± 0.2 | 0 ± 0.2 | ||||||||
The P 2p spectra for the Au8, Au9, and Au101 clusters of the untreated samples are shown in the lower traces of Fig. 3A–C. The spectra are fitted with two peaks, one at 131.9 ± 0.2 eV, which we refer to as the phosphorous low binding energy peak (P-LBP), and another at 133.1 ± 0.2 eV, which we refer to as the high binding energy peak (P-HBP). The P-LBP is assigned to phosphine ligands bonded to the gold cluster core, whereas the P-HBP is assigned to a phosphorous oxide-like chemical species formed by phosphine ligands dislodging from the cluster metal core and oxidising by interaction with the oxide support.16Fig. 3 and 4A show that for all clusters the P-HBP is the dominant peak. This is quantified in Table 1, which shows that the ratio of both Au-HBP/P-LBP and total-Au/P-LBP is much larger than the stoichiometric ratio of Au/P in the pristine clusters (Au/P = 1:1 in Au8, 1.1:1 in Au9 and 5:1 in Au101) while the P intensity is mainly found in the P-HBP. In contrast, the ratio of total-Au/total-P is smaller than the stoichiometric ratio Au/P in the pristine clusters. Dislodging the phosphine ligands from the gold cluster cores yet keeping these dislodged ligands on the titania surface to form partially oxidised species can explain the high Au-HBP/P-LBP and total-Au/P-LBP ratios. The large amount of phosphorous oxide-like species can be explained by strong binding of the phosphorous to the oxygen of the metal oxide surface. The small Au/total P ratio shows that the gold clusters agglomerate and form larger particles. Due to the limited electron mean free path of the emitted electrons, the total gold intensity for larger particles will be lower than that of small clusters given the same total gold loading on the surface. These findings are very different to our previous work when the clusters are deposited on acid pre-treated P-25 Aeroxide titania, where the majority of the phosphorous intensity was found in the P-LBP.16 Acidic pretreatment changes the termination of the surface and thus influences the interaction of the clusters with the surface which is the likely reason for the difference in agglomeration of the clusters between our present and the previous work.
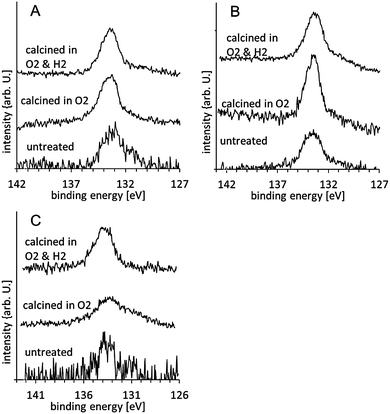 | ||
| Fig. 3 P XPS spectra of gold clusters supported on anatase nanoparticles untreated, in O2 at 200 °C, and calcined in O2 and subsequently in H2 at 200 °C: (A) Au8, (B) Au9 and, (C) Au101. The spectra are normalised such that the total P intensity is the same for all spectra. | ||
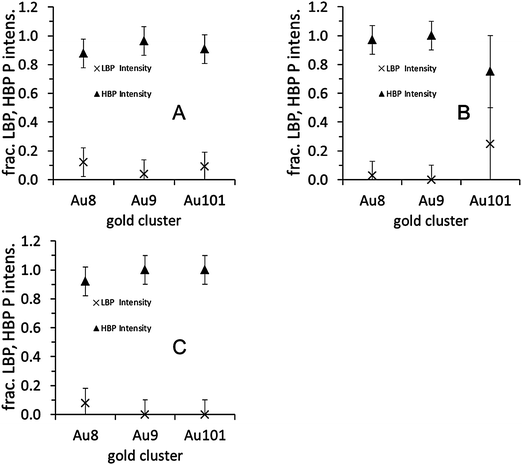 | ||
| Fig. 4 Fraction of the LBP and HBP phosphorous intensity: (A) as deposited, (B) after calcination in O2 at 200 °C, (C) after calcination in O2 and subsequently in H2 at 200 °C. | ||
In summary, the deposition of Au8, Au9 and Au101 on the untreated anatase nanoparticles results in the removal of some triphenylphosphine ligands. A considerable fraction of the Au8 and Au9 clusters maintain their size and the remainder undergo some form of partial agglomeration. The XPS results do not permit conclusions to be drawn about aggregation of Au101, since the binding energy position of the pristine clusters is already close to the value for bulk gold.
The P 2p spectra for the Au8, Au9, and Au101 clusters are shown in the middle traces of Fig. 3A–C. The spectra can be mostly fitted with a single P-HBP but the Au8 and Au101 spectra require a small component of P-LBP to fit the spectrum albeit with large uncertainty (see Fig. 4B and Table 2). Table 2 shows similar ratios of Au-HBP/P-LBP and total-Au/P-LBP for Au8 relative to the untreated clusters (also with large uncertainty). Table 2 also shows that the ratio of total-Au/total-P is smaller than the stoichiometric ratio of Au/P in the pristine Au8 clusters. It is not possible to draw any conclusions about Au101 since the binding energy does not change upon treatment.
| Au-HBP/P-LBP | Total Au/P-LBP | Total Au/total P | |
|---|---|---|---|
| a P-LBP intensity ≈ 0. | |||
| Au8 untreated | 2.2 ± 0.5 | 3.6 ± 0.5 | 0.4 ± 0.1 |
| Au9 untreated | 5.7 ± 1 | 8.6 ± 1 | 0.5 ± 0.1 |
| Au101 untreated | 5.2 ± 1 | 27.3 ± 3 | 2.5 ± 0.5 |
| Au8 calcined O2 | 2.6 ± 2 | 5.4 ± 4 | 0.2 ± 0.1 |
| Au9 calcined O2 | ∞a | ∞a | 0.1 ± 0.1 |
| Au101 calcined O2 | 0.3 ± 0.3 | 1.9 ± 2 | 0.5 ± 0.2 |
| Au8 calcined O2 and H2 | 0 ± 0.2 | 0.9 ± 1 | 0.1 ± 0.1 |
| Au9 calcined O2 and H2 | ∞a | ∞a | 0.1 ± 0.1 |
| Au101 calcined O2 and H2 | ∞a | ∞a | 0.1 ± 0.1 |
The interpretation of these findings is similar to that observed for the untreated samples. The phosphorous ligands are removed from the clusters and deposited on the titania surface while the gold cluster cores either partially or fully agglomerate. The only difference is that the removal and oxidation of ligands, and the agglomeration of the cluster cores has progressed further compared to the untreated samples. In comparison to our earlier study using clusters deposited onto acid pre-washed P-25 titania, we observe more pronounced cluster core aggregation in the case of clusters deposited on untreated anatase titania and heat-treated (at the same temperature and duration) under O2 atmosphere. This shows that the acidic pretreatment not only influences the deposition of the pristine clusters but also the agglomeration of the clusters during heat treatment. Acidic pretreatment changes the termination of the surface and thus influences the interaction of the clusters with the surface which is the likely reason for the difference in agglomeration of the clusters between our present and the previous work.
In summary, the deposition of Au8, Au9 and Au101 on the untreated anatase nanoparticles results in the almost complete removal of the ligands after calcination in O2. Maintaining the size of the pristine cluster core is successful for a considerable fraction of the Au8 clusters, but not for Au9. This finding is difficult to rationalise given the similarity of these clusters (i.e. similar metal cluster cores, both protected by triphenylphosphine ligands and with similar nitrate counter-ions) and we are undertaking other experiments, as well as detailed modelling studies, to identify any possible reasons for the observed difference.
The P 2p spectra for the Au8, Au9, and Au101 clusters are shown in the top traces of Fig. 3A–C. The spectra can be fitted mostly with a single P-HBP (see Fig. 4C) but a small peak at the P-LBP is required to fit the Au8 spectrum, again with large uncertainty (see Table 2). Table 1 shows that the Au-HBP/P-LBP and total-Au/P-LBP ratios for Au8 have decreased significantly (with large uncertainty). Table 2 also shows that the ratio of total-Au/total-P is much smaller than the stoichiometric ratio of Au/P in the pristine clusters and slightly less than the samples calcined in only O2. The combined interpretation of these results for the case of calcination in O2 and H2, is that the phosphorous ligands are now completely detached from the gold and re-deposited onto the titania surface while the gold cluster cores fully agglomerate. The more pronounced aggregation of gold cluster cores, even for Au8, during this treatment is rationalised as being due to the extended period of exposure (twice as long) at elevated temperature, with the H2 atmosphere also possibly contributing to increased aggregation.
In summary, the deposition of Au8 and Au9 on the untreated anatase nanoparticles results in the almost complete removal of the ligands from gold metal cores after calcination in O2 and subsequently in H2. However, the size of the gold cluster core for Au8 and Au9 is not maintained in this case but no conclusions can be drawn for Au101.
B. XAS results
Fig. 5 shows Au LIII-edge XANES spectra for unsupported and supported Au9 clusters, bulk gold metal, as well as for Au9 clusters supported on anatase and calcined in O2 alone or O2 followed by H2. It is evident by inspection that a significant modulation of the spectrum occurs when the clusters are deposited on the anatase substrate with the peak at ∼11925 eV diminishing, while broader peaks at ∼11947 eV and ∼11970 eV become more intense. These effects are magnified when the anatase supported clusters are calcined under either set of conditions reported above, and the XANES spectra from these two samples are visually identical to each other and to the spectrum of bulk gold. A linear regression fit of the spectra of the calcined anatase-supported clusters with a simple combination of the bulk metal and pure Au9 cluster spectra (fitted over the range 11880–11980 eV) reinforces the result that these samples contain agglomerated gold that is chemically equivalent to the bulk gold standard (see Fig. S2 and S3 (ESI†) for comparisons of these spectra). A similar fit to the anatase-deposited Au9 cluster spectrum yields a best fit of 61(±3)% pure Au9 and 39(±3) bulk gold (a comparison of the data and the fit, including a residual, is shown in Fig. S4, ESI†).
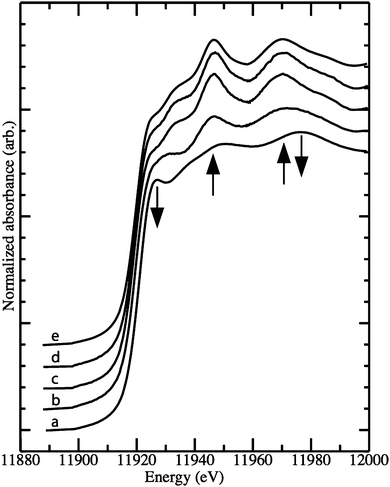 | ||
| Fig. 5 Au LIII-edge X-ray absorption spectra of Au9 clusters (a) diluted in cellulose, (b) supported on anatase nanoparticles – untreated, (c) after calcination in O2 at 200 °C, (d) after calcination in O2 and subsequently in H2 at 200 °C, (e) bulk metal standard. The arrows indicate features that are observed to change as the samples progress from clusters to agglomerated species. | ||
The interpretations from the XAS results for the Au9 clusters are in agreement with those from the XPS data described above, i.e. that deposition of the clusters on anatase results in partial loss of phosphine ligands and concomitant agglomeration, and that subsequent calcination results in complete loss of phosphine ligands and agglomeration. This validates the conclusions from XPS for the Au9 clusters, and by extension, the conclusions for the Au8 clusters for which XAS data is not available.
Conclusions
Synchrotron-XPS measurements show that the deposition of phosphine-protected Au8, Au9 and Au101 clusters on untreated titania (anatase) leads to the partial removal of the ligands and their subsequent binding and oxidation to the metal oxide substrate surface. XAS data confirms these results for the Au9 clusters. The removal of ligands and the agglomeration of gold cluster cores without treatment is different to that observed by us previously,16 when the titania substrate was pre-treated with acid.Acknowledgements
This work was supported by grants of the Australian Synchrotron and NZ Synchrotron Group (AS121/SXR/4641a&b and AS121/ANBF/4438), the MacDiarmid Institute and the College of Science at the University of Canterbury, NZ. The XPS measurements were undertaken on the soft X-ray beamline at the Australian Synchrotron, Victoria, Australia. XAS data collection was undertaken at the Australian National Beamline Facility at the Photon Factory in Japan, operated by the Australian Synchrotron. We acknowledge the Australian Research Council for financial support and the High Energy Accelerator Research Organisation (KEK) in Tsukuba, Japan, for operations support.References
- M. Haruta, S. Tsubota, T. Kobayashi, H. Kageyama, M. J. Genet and B. Delmon, J. Catal., 1993, 144, 175–192 CrossRef CAS.
- R. Meyer, C. Lemire, S. Shaikhutdinov and H. Freund, Gold Bull., 2004, 37, 72–124 CrossRef CAS.
- A. A. Herzing, C. J. Kiely, A. F. Carley, P. Landon and G. J. Hutchings, Science, 2008, 321, 1331–1335 CrossRef CAS.
- M. Valden, X. Lai and D. W. Goodman, Science, 1998, 281, 1647–1650 CrossRef CAS.
- M. Turner, V. B. Golovko, O. P. H. Vaughan, P. Abdulkin, A. Berenguer-Murcia, M. S. Tikhov, B. F. G. Johnson and R. M. Lambert, Nature, 2008, 454, 981–983 CrossRef CAS.
- G. E. Johnson, C. Wang, T. Priest and J. Laskin, Anal. Chem., 2011, 83, 8069–8072 CrossRef CAS.
- M. Büttner and P. Oelhafen, Surf. Sci., 2006, 600, 1170–1177 CrossRef.
- Y. Kitsudo, A. Iwamoto, H. Matsumoto, K. Mitsuhara, T. Nishimura, M. Takizawa, T. Akita, Y. Maeda and Y. Kido, Surf. Sci., 2009, 603, 2108–2114 CrossRef CAS.
- D.-C. Lim, C.-C. Hwang, G. Gantefor and Y. D. Kim, Phys. Chem. Chem. Phys., 2010, 12, 15172–15180 RSC.
- L. Benz, X. Tong, P. Kemper, H. Metiu, M. T. Bowers and S. K. Buratto, J. Phys. Chem. B, 2005, 110, 663–666 CrossRef.
- S. Lee, C. Fan, T. Wu and S. L. Anderson, J. Am. Chem. Soc., 2004, 126, 5682–5683 CrossRef CAS.
- Y. Lei, F. Mehmood, S. Lee, J. Greeley, B. Lee, S. Seifert, R. E. Winans, J. W. Elam, R. J. Meyer, P. C. Redfern, D. Teschner, R. Schlögl, M. J. Pellin, L. A. Curtiss and S. Vajda, Science, 2010, 328, 224–228 CrossRef CAS.
- U. Heiz and W.-D. Schneider, Crit. Rev. Solid State Mater. Sci., 2001, 26, 251–290 CrossRef CAS.
- S. Kunz, K. Hartl, M. Nesselberger, F. F. Schweinberger, G. Kwon, M. Hanzlik, K. J. J. Mayrhofer, U. Heiz and M. Arenz, Phys. Chem. Chem. Phys., 2010, 12, 10288–10291 RSC.
- B. Yoon, H. Häkkinen, U. Landman, A. S. Wörz, J.-M. Antonietti, S. Abbet, K. Judai and U. Heiz, Science, 2005, 307, 403–407 CrossRef CAS.
- D. P. Anderson, J. F. Alvino, A. Gentleman, H. A. Qahtani, L. Thomsen, M. I. J. Polson, G. F. Metha, V. B. Golovko and G. G. Andersson, Phys. Chem. Chem. Phys., 2013, 15, 3917–3929 RSC.
- C. C. Chusuei, X. Lai, K. A. Davis, E. K. Bowers, J. P. Fackler and D. W. Goodman, Langmuir, 2001, 17, 4113–4117 CrossRef CAS.
- A. B. Hungria, R. Raja, R. D. Adams, B. Captain, J. M. Thomas, P. A. Midgley, V. Golovko and B. F. G. Johnson, Angew. Chem., Int. Ed., 2006, 45, 4782–4785 CrossRef CAS.
- R. Raja, V. B. Golovko, J. M. Thomas, A. Berenguer-Murcia, W. Zhou, S. Xie and B. F. G. Johnson, Chem. Commun., 2005, 2026–2028 RSC.
- R. Zanella and C. Louis, Catal. Today, 2005, 107–108, 768–777 CrossRef CAS.
- Y. Yuan, K. Asakura, H. Wan, K. Tsai and Y. Iwasawa, Chem. Lett., 1996, 755 CrossRef CAS.
- H. G. Boyen, A. Ethirajan, G. Kästle, F. Weigl, P. Ziemann, G. Schmid, M. G. Garnier, M. Büttner and P. Oelhafen, Phys. Rev. Lett., 2005, 94, 016804 CrossRef.
- H. Yin, Z. Ma, M. Chi and S. Dai, Catal. Lett., 2010, 136, 209–221 CrossRef CAS.
- C. G. Long, J. D. Gilbertson, G. Vijayaraghavan, K. J. Stevenson, C. J. Pursell and B. D. Chandler, J. Am. Chem. Soc., 2008, 130, 10103–10115 CrossRef CAS.
- V. Borman, M. Pushkin, V. Tronin and V. Troyan, J. Exp. Theor. Phys., 2010, 110, 1005–1025 CrossRef CAS.
- C. Battistoni, G. Mattogno, F. Cariati, L. Naldini and A. Sgamellotti, Inorg. Chim. Acta, 1977, 24, 207–210 CrossRef CAS.
- D. M. Cox, W. Eberhardt, P. Fayet, Z. Fu, B. Kessler, R. D. Sherwood, D. Sondericker and A. Kaldor, Z. Phys. D: At., Mol. Clusters, 1991, 20, 385–386 CrossRef CAS.
- S. B. DiCenzo, S. D. Berry and E. H. Hartford, Jr., Phys. Rev. B: Condens. Matter Mater. Phys., 1988, 38, 8465–8468 CrossRef.
- Y. Lykhach, J. Plšek, I. Spirovová and Z. Bastl, Collect. Czech. Chem. Commun., 2003, 68, 1791–1804 CrossRef CAS.
- Y. Yuan, K. Asakura, A. P. Kozlova, H. Wan, K. Tsai and Y. Iwasawa, Catal. Today, 1998, 44, 333–342 CrossRef CAS.
- Y. Zhu, H. Qian and R. Jin, Chem.–Eur. J., 2010, 16, 11455–11462 CrossRef CAS.
- Y.-Y. Fong, B. R. Visser, J. R. Gascooke, B. C. C. Cowie, L. Thomsen, G. F. Metha, M. A. Buntine and H. H. Harris, Langmuir, 2011, 27, 8099–8104 CrossRef CAS.
- B. C. C. Cowie, A. Tadich and L. Thomsen, AIP Conf. Proc., 2010, 1234, 307–310 CrossRef.
- D. A. Shirley, Phys. Rev. B: Condens. Matter Mater. Phys., 1972, 5, 4709–4714 CrossRef.
- J. Végh, J. Electron Spectrosc. Relat. Phenom., 2006, 151, 159–164 CrossRef.
- H. P. Hughes and J. A. Scarfe, J. Phys.: Condens. Matter, 1996, 8, 1421 CrossRef CAS.
- J. F. Moulder, W. F. Stickle, P. E. Sobol and K. D. Bomben, Handbook of X-ray Photoelectron Spectroscopy, Physical Electronics, Inc., Eden Prairie, 1995 Search PubMed.
- J. J. Yeh and I. Lindau, At. Data Nucl. Data Tables, 1985, 32, 1–155 CrossRef CAS.
- R. I. Derby, W. S. Hutchinson, T. H. Dexter and J. M. Naughton, Inorganic Syntheses, John Wiley & Sons, Inc., 2007, pp. 152–158 Search PubMed.
- W. W. Weare, S. M. Reed, M. G. Warner and J. E. Hutchison, J. Am. Chem. Soc., 2000, 122, 12890–12891 CrossRef CAS.
- D. Briggs and M. P. Seah, Practical surface analysis, Wiley, Chichester, New York, Aarau, 1990 Search PubMed.
Footnotes |
| † Electronic supplementary information (ESI) available: Fitting of the gold Au8 measurements and XANES fitting plots. See DOI: 10.1039/c3cp52497c |
| ‡ Current address: School of Chemistry, Bielefeld University, Bielefeld, Germany. |
| This journal is © the Owner Societies 2013 |