 Open Access Article
 This Open Access Article is licensed under a
 Creative Commons Attribution 3.0 Unported Licence
A step towards the a priori design of ionic liquids
Heiko
Niedermeyer
ab,
Claire
Ashworth
a,
Agnieszka
Brandt
ac,
Tom
Welton
a and
Patricia A.
Hunt
*a
aChemistry Department, Imperial College London, London, SW7 2AZ, UK. E-mail: p.hunt@imperial.ac.uk
bChemtura Organometallics GmbH, Ernst-Schering-Str. 14, 59192 Bergkamen, Germany
cChristian-Doppler-Laboratory, Department of Chemistry, University of Natural Resources and Life Sciences, A-1190 Vienna, Austria
First published on 10th June 2013
Abstract
A range of methods for the computational prediction of experimentally derived α and β Kamlet–Taft parameters, indicators of hydrogen bond (H-bond) acidity and basicity for ionic liquids (ILs) have been explored. Most usefully, a good correlation has been established between several simple and easily computed quantities which allow for a “quick bench-top” evaluation. More accurate, but also more sophisticated methods employing TD-DFT calculations involving the Kamlet–Taft dyes have been examined and evaluated. Importantly, these techniques open up the opportunity for pre-screening and a priori prediction of properties for ILs not yet synthesised. A key fundamental insight into IL H-bonds has been the determination of an estimate for the energy associated with replacing both neutral molecules in a H-bond with ionic molecules, thus forming the “doubly ionic” H-bond found in ILs.
1 Introduction
Ionic liquids (ILs), liquids composed solely of ions, have attracted a considerable amount of interest in recent years as solvents for synthesis and electrochemical applications.1–5 Much of this interest has rested on the concept of ionic liquids as “designer solvents”.6 In theory, ions with specific characteristics can be combined to provide a solvent with the desired physical and chemical attributes, however, practical implementation of this has been problematic.For existing ILs the selection of ions is hampered by the lack of a quantitative link between the structure of the constituent ions and the properties of the IL. The situation is exacerbated by the wide variety of ions that can be combined. Ion selection therefore typically becomes a process of trial and error. For new ILs not yet synthesised there is no accurate mechanism for predicting characteristics. This gives rise to a need for pre-screening methods which will predict the characteristics of ILs, particularly those conceived of but, not yet synthesised. Herein we report a method which allows for the prediction of IL properties based on simple calculations of the isolated ions, which advances us on the path towards a priori design of ILs.
Methods for characterising the H-bond acceptor and H-bond donor capabilities of a solvent exist; one such methodology determines Linear Solvation Energy Relationships (LSER), which correlate an experimentally measurable property (XYZ) with solute (a, b, c) and solvent (A, B, C) parameters, eqn (1).
| XYZ = XYZ0 + aA + bB + sC +⋯ | (1) |
Kamlet and Taft developed a method for numerically characterising the H-bond acceptor and H-bond donor capabilities of a solvent based on solvatochromic polarity scales, represented by β and α respectively.7–11 Abraham developed another method based on sampling a range of solutes (acids and bases) for a given solvent (typically tetrachloromethane).12–14 In the case of the pKHB scale only a single acid 4-fluorophenol is employed.15–17 Raevsky uses similar descriptors to predict Gibbs free energies.18
For example, the H-bond acceptor parameters for pyridine as a solvent (β) can be determined by dissolving a selection of Kamlet–Taft dyes in pyridine. Whereas the parameters for pyridine as a solute (βH2) can be obtained by measuring the partition coefficient of pyridine between two phases (such as water and octanol) or by dissolving pyridine in tetrachloromethane and determining the equilibrium constant for association of pyridine with a range of acids.
Previously we have extended the Kamlet and Taft approach to IL solvents,19,20 where α and β have proven useful in predicting and interpreting chemical kinetics in ILs via a LSER, which correlates an energy property (XYZ) with solvent parameters, eqn (2).21,22
| XYZ = XYZ0 + aα + bβ + cπ* | (2) |
Finding simple computational tools to predict the α, β and π* of an IL based on the individual constituent ions offers significant advantages. The COSMO-RS based approach by Palomar et al. already exists for the prediction of ETN which implicitly includes π*.23 Platts et al. have explored different computed descriptors for predicting parameters from Abraham's linear free energy approach which uses αH2 and βH2 as a scale for H-bond acidity and basicity.24,25αH2 and βH2 are obtained from equilibrium constants for complexation of the molecular solvent with a reference base or acid in dilute CCl4 solutions.26,27 Abraham's αH2 and βH2 parameters are not fully equivalent to the Kamlet–Taft parameters, α, β, however, they do show a good qualitative correlation. We have therefore selected computed descriptors, guided by the work of Platts et al. on Abraham's parameters for molecular solvents, and applied a similar process to develop a correlation for IL solvents based on the Kamlet–Taft parameter scheme.
A range of different ILs (Fig. 1) have been synthesised, the solvatochromic Kamlet–Taft α and β parameters have been both computationally predicted and experimentally determined. Criteria for choosing predictive parameters have included simplicity and speed; the calculations required should be accessible to those not expert in computational chemistry, and they should be achievable using a standard desktop or laptop computer. We have had significant success in applying these computed descriptors to predict the experimental solvatochromic Kamlet–Taft α and β parameters for these ILs. Simple instructions for calculating these parameters are available on-line.28 In addition, a range of more computationally demanding methods have also been investigated which bear a more direct relevance to the quantities determined from experiment.
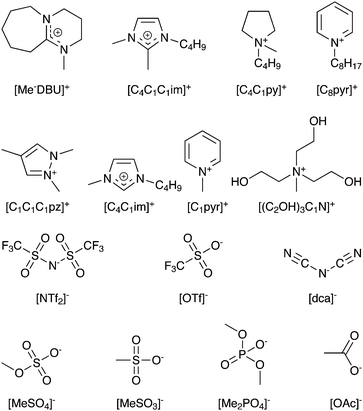 | ||
| Fig. 1 Cations and anions studied and nomenclature employed. | ||
In the following we first present all the data, and then the best fit predictions for α and β. Each parametrisation is discussed individually in greater detail, and specific ions which show outlier behaviour are investigated in greater depth.
2 Results and discussion
2.1 Results
In an IL, H-bond acidity α is primarily associated with the cation, the H-bond donor. The exact experimental value of α varies slightly, depending upon the anion of the IL. Computationally a predicted α value for the isolated cation is easily established. However, experimental values for an isolated cation are not directly accessible due to the presence of the anion. Thus, in order to obtain a largely unperturbed value for alpha, the very weakly interacting anions [NTf2]− and [OTf]− have been employed for all measurements. It is well established that the difference in α between these two anions is smaller than the experimental error for [C4C1im]+ and [C4C1py]+.20,21 The electrostatic potential at the acidic proton EPnuc and ΔE(NCH) the energy of H-bond formation with NCH of the cation have been computed and related to the H-bond donor capability α.The H-bond basicity β depends almost exclusively on the anion, and variation of β for different cations is small. However, while no systematic influence of the cation on the β value for an IL is known, all experimental values have been reported with the same cation [C4C1im]+ to ensure consistency. For the H-bond acceptor capability β, ΔE(HF) the energy of H-bond formation of the anion with HF and the change in HF bond length Δr(HF) have been computed.
A more computationally demanding analysis has also been undertaken which more closely emulates the experimental procedure. The energy of association for each cation with the dye used to determine α experimentally, Reichardt's dye ΔE(RD), has been evaluated. In addition, the energy of association for each anion with the dye used to determine β, 4-nitroaniline ΔE(NA), has also been evaluated. Experimentally the UV-Vis spectrum of Reichardt's dye or 4-nitroaniline in the solvent under study are obtained and the observed peak maximum (of the longest wavelength absorption) determined. In analogy, time dependent DFT calculations (TD-DFT) for the optical excitation of the respective complexes with Reichardt's dye or 4-nitroaniline have been carried out and the relevant electronic excitation wavelengths determined, λ(RD) and λ(NA) respectively.
The data for α are presented in Table 1 and Fig. 2. The data for β are presented in Table 2 and Fig. 3. The experimental α and β are denoted by αexp and βexp respectively. The values for ΔE(NCH), EPnuc, λ(RD) and ΔE(RD) and the corresponding best fit predictions for α; αΔE(NCH), αEP, αλ(RD) and αΔE(RD) are provided. The values for ΔE(HF), Δr(HF), λ(NA) and ΔE(NA) and the corresponding best fit predictions for β; βΔE(HF), βΔr(HF), βλ(NA) and βΔE(NA) are also given. A consensus value taken as the simple arithmetic mean and an associated standard deviation (sd) has also been determined. The values for αaverage and βaverage (Tables 1 and 2) could be used to identify problematic cations or anions and to reject predictions that are clearly wrong.
| Cation | ΔE(NCH) | EPnuc | λ(RD) | ΔE(RD) | α ΔE(HCN) | α EP | α λ(RD) | α ΔE(RD) | α average | sd | α exp |
|---|---|---|---|---|---|---|---|---|---|---|---|
| a [OTf]−. b [NTf2]−. c 75 °C. | |||||||||||
[Me-DBU]+![[thin space (1/6-em)]](https://www.rsc.org/images/entities/char_2009.gif) a a |
−28.66 | −0.956 | 809.07 | −118.47 | 0.21 | 0.21 | 0.27 | 0.21 | 0.23 | 0.03 | 0.22 |
| [C4C1C1im]+b20 |
−34.66 | −0.912 | 801.05 | −137.23 | 0.39 | 0.43 | 0.34 | 0.37 | 0.38 | 0.04 | 0.38 |
| [C4C1py]+b20 |
−36.71 | −0.931 | 782.28 | −150.15 | 0.45 | 0.34 | 0.50 | 0.48 | 0.44 | 0.07 | 0.43 |
| [C8pyr]+b29 |
−37.97 | −0.898 | 780.29 | −154.50 | 0.49 | 0.51 | 0.51 | 0.51 | 0.51 | 0.01 | 0.51 |
| [C1C1C1pz]+a |
−38.87 | −0.898 | 785.67 | −153.34 | 0.52 | 0.51 | 0.47 | 0.50 | 0.50 | 0.02 | 0.51 |
| [C4C1im]+b |
−41.40 | −0.873 | 772.41 | −163.98 | 0.60 | 0.64 | 0.58 | 0.59 | 0.60 | 0.03 | 0.61 |
| [C1pyr]+a,c |
−41.86 | −0.888 | 771.51 | −166.24 | 0.61 | 0.56 | 0.59 | 0.61 | 0.59 | 0.02 | 0.62 |
| [(HOC2)3C1N]+a |
−46.95 | −0.828 | 710.89 | −168.63 | 0.77 | 0.87 | 1.10 | 0.63 | 0.84 | 0.20 | 1.08 |
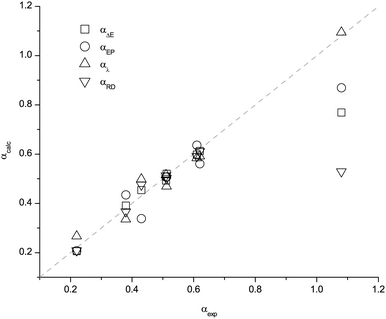 | ||
| Fig. 2 Plot of the predicted α values versus the experimental results for the different descriptors. | ||
| Anion | ΔE(HF) | Δr(HF) | λ(NA) | ΔE(NA) | β ΔE(HF) | β Δr(HF) | β λ(NA) | β ΔE(NA) | β average | sd | β exp |
|---|---|---|---|---|---|---|---|---|---|---|---|
| a 75 °C. | |||||||||||
| [PF6]−20 | −59.47 | 0.021 | 348.15 | −77.33 | 0.19 | 0.15 | 0.13 | 0.19 | 0.17 | 0.03 | 0.21 |
| [NTf2]− | −58.87 | 0.029 | 349.43 | −80.00 | 0.18 | 0.30 | 0.26 | 0.24 | 0.25 | 0.05 | 0.25 |
| [BF4]−20 | −74.29 | 0.031 | 350.84 | −92.16 | 0.44 | 0.34 | 0.40 | 0.47 | 0.41 | 0.06 | 0.47 |
| [OTf]− | −77.86 | 0.037 | 351.68 | −90.76 | 0.49 | 0.46 | 0.48 | 0.44 | 0.46 | 0.02 | 0.47 |
| [dca]−30 | −91.00 | 0.053 | 350.25 | −86.26 | 0.71 | 0.75 | 0.34 | 0.36 | 0.54 | 0.22 | 0.60 |
| [MeSO4]− | −87.64 | 0.048 | 353.77 | −100.27 | 0.65 | 0.66 | 0.69 | 0.61 | 0.65 | 0.03 | 0.65 |
| [MeSO3]−a |
−95.21 | 0.056 | 355.83 | −109.72 | 0.78 | 0.82 | 0.90 | 0.79 | 0.82 | 0.05 | 0.77 |
| Cl−a30 |
−100.00 | 0.058 | 355.69 | −113.67 | 0.86 | 0.85 | 0.88 | 0.86 | 0.86 | 0.01 | 0.83 |
| [Me2PO4]− | −106.56 | 0.064 | 357.29 | −124.44 | 0.96 | 0.98 | 1.04 | 1.06 | 1.01 | 0.05 | 1.15 |
| [OAc]−30 | −123.49 | 0.119 | 358.14 | −134.53 | 1.24 | 2.02 | 1.13 | 1.24 | 1.41 | 0.41 | 1.20 |
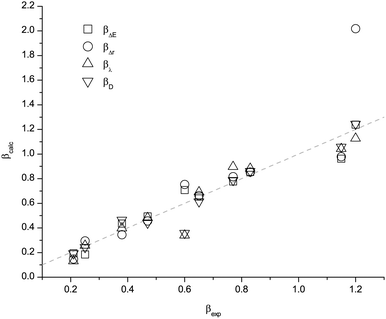 | ||
| Fig. 3 Plot of the predicted β values versus the experimental results for the different descriptors. | ||
The dotted lines in Fig. 2 and 3 indicate where a perfect match between the predicted and experimental values would occur. The small deviations from the perfect fit lines indicate that these methods perform well overall. However, immediately obvious are two outliers; α for [(HOC2)3C1N]+ and β for the acetate anion. The origins of these discrepancies have been investigated, and we are able to provide rationalisations for this interesting behaviour.
The best fit obtained for each parameter investigated is given in eqn (3)–(10). To use these relationships, one could compute EPnuc for a “new” cation, this value is then entered into eqn (3) to give a first estimate of α for that cation, and hence an IL created using that cation. An analogous process can be followed for the other parameters. The computational details section outlines the general method employed, and precise instructions for obtaining the simple parameters are provided on-line.28
Ideally a larger sample size would be desirable, however the advantage we have is that accurate experimental data for every (very pure) IL studied has been obtained from within the same laboratory. Moreover being able to perform the calculations in tandem has been highly beneficial (as will be explained further shortly).
| αEP = 5.153 × EPnuc + 5.136 R2 = 0.92 | (3) |
| αΔE(NCH) = −0.0308 × ΔE(NCH) − 0.677 R2 = 0.99 | (4) |
| αλ(RD) = −0.00842 × λ(RD) + 7.084 R2 = 0.97 | (5) |
| αΔE(RD) = −0.00843 × ΔE(RD) − 0.790 R2 = 0.97 | (6) |
| βΔE(HF) = −0.0163 × ΔE(HF) − 0.777 R2 = 0.94 | (7) |
| βΔr(HF) = 19.08 × Δr(HF) − 0.251 R2 = 0.90 | (8) |
| βλ(NA) = 0.09982 × λ(NA) − 34.622 R2 = 0.95 | (9) |
| βΔE(NA) = −0.01836 × ΔE(NA) − 1.226 R2 = 0.98 | (10) |
2.2 H-bond acidity: the electrostatic potential
The electrostatic potential at the position of an atom, neglecting the charge of the atom itself has been computed. For a system of N nuclei with the atomic number ZN, the electrostatic potential of atom K in atomic units is defined as:31,32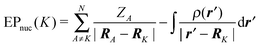 | (11) |
A smaller value of |EPnuc| corresponds to a higher H-bond acidity, and is consistent with a more strongly polarised X–H bond (more charge is pulled away from the hydrogen atom, giving a larger Δr and making |EPnuc| smaller). An assumption inherent to this method, is that the weakly interacting anion does not inhibit access of the dye to the most acidic (least negative EPnuc) proton of the cation.
The electrostatic potential shows a good linear correlation with the H-bond acidity α (Table 3 and Fig. 4). These results are consistent with the findings of Platts et al. for the Abraham's parameter of molecular solvents.24 Here, Kamlet–Taft parameters are used and the method applied to ionic solvents.
![[R with combining macron]](https://www.rsc.org/images/entities/i_char_0052_0304.gif) 2 is the squared correlation coefficient and sd is the standard deviation
2 is the squared correlation coefficient and sd is the standard deviation
| I | S | n |
2
|
sd | |
|---|---|---|---|---|---|
| EP1 | 6.194 | 6.289 | 8 | 0.908 | 0.077 |
| EP2 | 4.744 | 4.707 | 7 | 0.861 | 0.052 |
| EP3 | 5.136 | 5.153 | 6 | 0.921 | 0.042 |
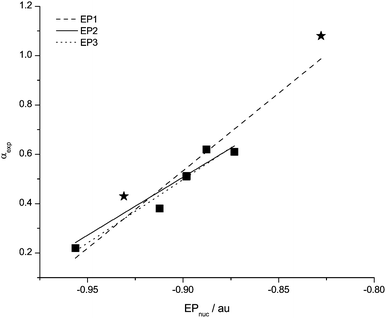 | ||
| Fig. 4 Data points and correlation functions EP1, EP2 and EP3 for EPnuc with the H-bond acidity α. Problematic data points are starred. | ||
The first correlation function EP1 (Table 3), includes all data points in the study and shows a good qualitative agreement between the calculated and the experimental property. The data point for [(HOC2)3C1N]+ looks to be an outlier, and when this is removed the correlation yields function EP2.
EP2 shows a markedly weaker 2 value compared to the initial correlation involving all data points due to the way 2 is calculated (eqn (12), where yi is the experimental value and fi is the predicted value). Removal of a data point far from the arithmetic mean for the small sample size used here has a large affect on the denominator. The standard deviation shows a significant improvement.
 | (12) |
While the single most acidic proton as predicted by the electrostatic potential can be unambiguously assigned, the [C4C1py]+ cation is an interesting case. In this cation the methyl protons have the lowest (just) |EPnuc|. However, calculations with a probe NCH molecule show that the energetically most favourable interaction (of a H-bond acceptor) with the pyrrolidinium cation is through three hydrogen atoms on the opposite side of the molecule, Fig. 5. These H-bonds are all of a similar length, and shorter than the sum of van-der-Waals radii.33
![Bonding pattern in the [C4C1py]+⋯NCH complex.](/image/article/2013/CP/c3cp50521a/c3cp50521a-f5.gif) | ||
| Fig. 5 Bonding pattern in the [C4C1py]+⋯NCH complex. | ||
The implicit assumption made in using EPnuc is that there is one primary H-bonding (acidic) proton which dominates the overall H-bonding behaviour of the molecule or ion. This assumption breaks down when a more stable interaction exists, such as this one, where the anion interacts with a group of protons. Over a number of studies we have noticed that the H-bonding to cations is strongest with the methylene groups closest to the primary positive charge carrier (N atoms in this case). Hence, an outlier case could be predicted prior to evaluation of α by noticing that the smallest |EPnuc| is for the methyl proton and not a ring or methylene proton. This could then be followed up by calculations on the stable complexes formed with NCH. In this case evaluating α based on ΔE(NCH) would be more reliable. Excluding the [C4C1py]+ data point yields correlation EP3 for α with 2 = 0.92.
The computationally predicted α values can be used to help assess the purity of an IL. For example, if the simple method of using |EPnuc| to predict α does not match an experimental determination of α, this may mean that the experimental sample is not contaminant free. We have used this mechanism ourselves, the mismatch of the computed and experimentally determined α for [Me-DBU]+ (N-Methyl-1,8-diazabicyclo[5.4.0]undec-7-ene), initially at 0.7, drove further efforts to purify this sample resulting in a final value close to 0.2 which does match the computationally predicted value.
Experimentally the α scale is arbitrarily referenced to zero for alkanes like hexane, these mark the non H-bonding end of the scale. Thus, ideally the computed EPnuc for alkanes should give an α value of 0. All three correlation functions predict an α very close to 0 for EPnuc = −1.0. However, a calculation on methane gives an electrostatic potential of EPnuc = −1.123 corresponding to α = −0.65. This difference in α (or in EPnuc) can be rationalised as originating in the overall positive charge of the system creating a net systematic shift.
A cation in an IL could be expected to have a slightly reduced charge (due to charge transfer from the anion) and be stabilised by the electrostatic potential of the surrounding anions.34 This means that the gas phase ion will be slightly more “ionic” therefore providing a slightly elevated α. This “correction” is expected to be fairly uniform and taken into account by the fitting procedure. Treating neutral and ionic solvents as separate solvent groups each with their own equation appears to be a sensible approach.
It is also unclear to what extent the experimental α values are influenced by the ionic nature of the IL. H-bonds are mostly ionic in nature, and most H-bonds occur between molecules that are neutral such as water or alcohols. Where the H-bond donor is neutral the charge on the H-atom is often less extreme. When the H-atom is part of an overall positively charged cation, the H-bond can be strengthened because the H-atom is charge enhanced.
Reichardt's dye (used experimentally to determine α) has a strongly dipolar character in the ground state that is less pronounced in the excited state.35 Thus, there is also an additional effect due to the environment of Reichardt's dye; in a neutral solvent the polarisation of the ground state will not be favoured, while in an ionic solvent this polarisation will be better stablised. These generalised environmental effects will be reflected in the solvatochromic shift and do not relate to the specific H-bonding characteristics of the solvent. In traditional polar but neutral solvents this effect is not extreme, however in ILs, which are composed of ions, the extent of this effect is not known. The “zero” for the system is referenced to a non-polar neutral molecule and thus will not account for these generalised background effects. This effect is partly accounted for in that the polarity and polarisability parameter π* is included in the determination of α. Nevertheless, it is possible that the H-bond acidities measured using Reichardt's dye in ILs are partly due to interactions that are not a property of the H-bond acidic proton or the R–H group, but of the cation as a charged entity. The important point here is that Reichardt's dye may overemphasise the H-bonding ability of the IL cations relative to neutral species. This has also been noted in a previous experimental study.36
2.3 H-bond acidity: complex with NCH
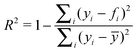
H-bonds typically involve two molecules, thus it makes sense to “mimic” the H-bond formed with the dye or another solute using a probe molecule. The energy ΔE(NCH) of H-bond formation with NCH has been analysed as a potential descriptor for α. ΔE(NCH) produces an excellent correlation with H-bond acidity (Table 4). However, the [(HOC2)3C1N]+ data point is an outlier (Fig. 6). In Table 4, ΔE1 includes all data points, and ΔE2 excludes the value for [(HOC2)3C1N]+. The [(HOC2)3C1N]+ cation will be discussed in more detail in a following section.2 is the squared correlation coefficient and sd is the standard deviation
| I | S | n |
2
|
sd | |
|---|---|---|---|---|---|
| ΔE1 | −1.131 | −0.044 | 8 | 0.866 | 0.092 |
| ΔE2 | −0.677 | −0.031 | 7 | 0.985 | 0.017 |
 | ||
| Fig. 6 Data points and correlation functions ΔE1 and ΔE2 for ΔE(NCH) with the H-bond acidity α, together with the function established for molecular solvents. Problematic data points are starred. | ||
Analysing the lower end of the α scale, residual energy values of −25.90 kJ mol−1 and −21.95 kJ mol−1 respectively correspond to α = 0, the situation with no H-bonding present. The deviation from zero will have contributions from the charged nature of the cation, in addition there may be smaller contributions from basis set superposition error,37 and dispersive interactions that are not recovered at this level of theory.38 Platts et al. found a “zero” of −7.32 kJ mol−1 for neutral systems.25 However, the point-charge of the cation can interact with the dipole of the NCH or dye molecule, leading to a larger “zero” for the cationic system. The difference at the “zero” point for neutral vs. ionic solvents indicates that it is unlikely that a simple linear scale based on H-bond formation energies could span the whole range of solvents from molecular to ionic, separate equations will be required for the two different solvent types. More importantly this number provides a “reference” value for the cationic contribution to the ionic character of ionic liquids, with specific H-bonding interactions providing the remaining contributions.
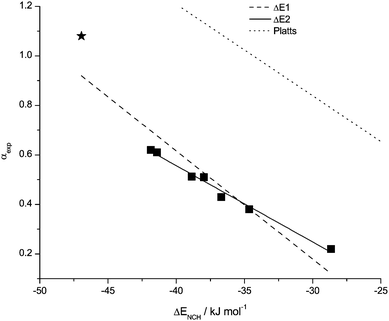
To explore the relationship between α and probe molecule distance and orientation further, a positive point charge was positioned (on a 51 × 51 grid) around a NCH molecule and the energy difference with respect to the neutral molecule evaluated. The positive point charge represents the proton of a H-bond donor. ΔE(NCH) was converted to α using eqn (4) and Fig. 7 generated. This analysis shows that the predicted H-bond acidity is highly orientation and distance dependent, making NCH a sensitive probe.
 | ||
| Fig. 7 Change in predicted α for a positive point-charge at varying positions around the NCH molecule. | ||
NCH as a linear molecule reorientates in response to the complex electronic structure of, and electrostatic field produced by, the IL cation, perhaps more so than a spherical probe. The good correlations obtained using NCH indicate that orientation dependance is important. The excellent correlation of ΔE(NCH) with the experimentally determined α also indicates that this probe molecule is a good “model” for the real dye in IL measurements. However, in some cases the steric constraints imposed by the dye, or cation, may impact upon the measurement of α.
2.4 H-bond acidity: calculations using Reichardt's dye
A third approach to the prediction of the H-bond acidity is to calculate a complex with Reichardt's dye. In direct analogy with the experimental measurements in which the lowest energy absorption of Reichardt's dye is measured by means of UV-Vis spectroscopy, time dependent DFT calculations can be employed to determine a wavelength λ for the first electronic excitation of Reichardt's dye. One key obstacle in the wide application of this method is the computational expense and technical knowledge required to carry out calculations on Reichardt's dye.
λ(RD) correlates very well with the H-bond acidity parameter α, Fig. 8 and Table 5. TD-DFT1 includes all data points, and TD-DFT2 excludes the data point for the [(HOC2)3C1N]+ cation. Removing this data point from the correlation does not change the linear function significantly, however due to the way 2 is calculated and the small sample size this value drops. λ(RD) is the only parameter examined so far that provides an accurate prediction of α for the [(HOC2)3C1N]+ cation.
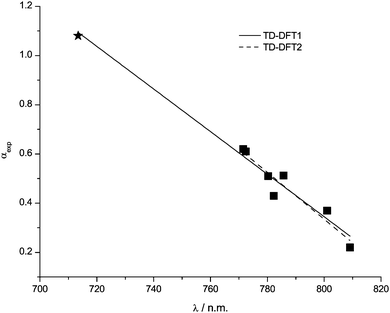 | ||
| Fig. 8 Data points and correlation functions TD-DFT1 and TD-DFT2 for λ(RD) with H-bond acidity α. The star indicates that the second excitation wavelength is more appropriate and has been used. | ||
2 is the squared correlation coefficient and sd is the standard deviation
| I | S | n |
2
|
sd | |
|---|---|---|---|---|---|
| TD-DFT1 | 7.084 | −0.00842 | 8 | 0.968 | 0.045 |
| TD-DFT2 | 7.963 | −0.00954 | 7 | 0.895 | 0.046 |
| ΔER1 | −1.321 | −0.01231 | 8 | 0.612 | 0.157 |
| ΔER2 | −0.790 | −0.00843 | 7 | 0.973 | 0.023 |
Initial calculations on the octyl and methyl substituted pyridinium cations yielded a first excitation at uncharacteristically long wavelengths 962.52 nm and 898.97 nm respectively. Closer analysis revealed that the first excitation was not from a dye based orbital into a higher unoccupied orbital on the same molecule, but into a molecular orbital of the cation. For these systems the second excitation wavelength, which relates to an internal excitation within Reichardt's dye is the appropriate wavelength to use.
In analogy to the prediction using a probe molecule NCH, the energy of complex formation with Reichardt's dye has been determined ΔE(RD) and correlated with the H-bond acidity α (Fig. 9, Table 5). ΔER1, includes all data points and ΔER2 excludes the value for [(HOC2)3C1N]+. The success of λ(RD) is in contrast to the poor performance of ΔER for the prediction of α for the [(HOC2)3C1N]+ cation.
![Data points and correlation functions for ER1 and ER2 for ΔE(RD) with the H-bond acidity α. Star indicates the outlier [(HOC2)3C1N]+ cation.](/image/article/2013/CP/c3cp50521a/c3cp50521a-f9.gif) | ||
| Fig. 9 Data points and correlation functions for ER1 and ER2 for ΔE(RD) with the H-bond acidity α. Star indicates the outlier [(HOC2)3C1N]+ cation. | ||
A key feature from this analysis is that ΔER2 based upon Reichardt's dye performs similarly well to ΔE2 based upon NCH, indicating that the probe molecule recovers key features of the interaction (at a substantially reduced computational effort).
2.5 Are there cation conformational effects?
A number of conformations are available for many of the cations studied. In each case the lowest energy conformer was employed in the analysis. To evaluate the influence of conformational variation on the predicted α values, the H-bond acidity was calculated for the three main conformers of the [C4C1im]+ cation, (Table 6). The conformational variations for this cation are well understood and result from internal rotations of the butyl chain and can be characterised as trans (a) or +60 °C gauche (b) or −60 °C gauche (c) conformers of the butyl chain relative to the ring.34 These conformational changes do not directly involve any of the key acidic protons of the ring. No significant dependence of the predicted H-bond acidity on the conformation of the cation has been found. This indicates that as long as the key H-bonding proton is not involved, a full conformational search is not required to obtain a first estimate of α.| Conformer | α ΔE(NCH) | α EP | α λ(RD) |
|---|---|---|---|
| a | 0.60 | 0.64 | 0.58 |
| b | 0.59 | 0.63 | 0.59 |
| c | 0.60 | 0.63 | 0.59 |
2.6 The [(HOC2)3C1N]+ cation
The [(HOC2)3C1N]+ cation has proved to be the only outlier point for a number of the parameters studied. This is the only functionalised cation included in the data set, and the most “acidic” proton of the charged ammonium group and the “acidic” protons of the OH groups on the alkyl chains are in competition for determining α. Chemical intuition would indicate that the most acidic protons are the those of the hydroxyl groups and these will determine α.If all the side-chains of [(HOC2)3C1N]+ are “extended” and the OH groups are spatially separated, the OH groups interact with methylene units on the adjacent alkyl chains, Fig. 10(a). In this case the predicted acidity falls well short of the experimental value, with α = 0.76 predicted from the electrostatic potential and α = 0.72 predicted from the complex formation with NCH, as opposed to the experimental result of α = 1.08.
![Complex of [(HOC2)3C1N]+ with NCH and Reichardt's dye.](/image/article/2013/CP/c3cp50521a/c3cp50521a-f10.gif) | ||
| Fig. 10 Complex of [(HOC2)3C1N]+ with NCH and Reichardt's dye. | ||
[(HOC2)3C1N]+ differs from the other cations studied here in that the key acidic protons (i.e. in the OH) are important contributors in a variety of H-bonded conformers, moreover the OH groups can interact with, and enhance each other. A conformational search has revealed a number of low energy structures with “daisy chaining” of two OH groups. This has the effect of making the proton at the end of the chain more acidic than an isolated OH group. A computed value of α = 0.77 is predicted from complex formation with NCH for the lowest energy daisy chain structure obtained (3.5 kJ mol−1 above the extended structure), Fig. 10(b).
However, calculation of the electrostatic potential for this conformer is complicated by the fact that the structure of the cation relaxes significantly when coordinated by NCH or Reichardt's dye. The electrostatic potential tabulated above and used in the correlations is obtained from a single-point calculation of the isolated cation in the geometry of the daisy chain complex with Reichardt's dye (Fig. 10(c)), resulting in a predicted acidity of α = 0.87. A similar situation was encountered when the OH groups formed a “pincer” type of arrangement with the probe molecule (13.6 kJ mol−1 above the extended structure). The structure of Fig. 10(b) was obtained by replacing Reichardt's dye of Fig. 10(c) with NCH and optimising. There has been a significant change in geometry, indicating that the cation structure is probe dependent, and thus also, potentially, the final measurement.
Thus the methods examined here work well for non-functionalised cations, and may work for cations in which the key proton is not the most acidic; however multiply functionalised cations with acidic protons are harder to address. [(HOC2)3C1N]+ may be a case where it is more useful to use the experimental results to inform the computation; when we find a value that matches the experimental value, this will tell us something about the liquid system. The results presented here may also indicate that a small isolated cluster approach works well for the more loosely associated “traditional” ILs, however for strongly networked ILs such as [(HOC2)3C1N]+ there appears to be synergistic enhancement of the α value. Using the experimental α value (1.08) and the current equation, the network will deliver approximately 10 kJ mol−1 further stabilisation. It is possible that we have not located the global minimum energy structure, however an exhaustive search is beyond the scope of this project.
2.7 H-bond basicity: complex with HF
The ability of an anion to act as a H-bond acceptor can be determined using a small probe molecule. How well the anion is able to compete with F for the H atom in HF is used. ΔE(HF) is the energy of association of the anion with HF, and gives a good quality prediction of β for the whole range of ions examined (Fig. 11, Table 7). The qualitative behaviour is as expected; those ions thought of as increasingly basic interact more strongly with the probe molecule.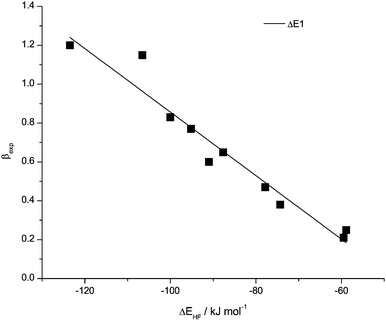 | ||
| Fig. 11 Data points and correlation functions of ΔE(HF) with H-bond basicity β. | ||
2 is the squared correlation coefficient and sd is the standard deviation
| I | S | n |
2
|
sd | |
|---|---|---|---|---|---|
| ΔE | −0.777 | −0.0163 | 10 | 0.93903 | 0.085 |
| Δr1 | 0.081 | 11.05 | 10 | 0.76373 | 0.167 |
| Δr2 | −0.251 | 19.08 | 9 | 0.90091 | 0.095 |
The energy corresponding to a zero H-bond basicity of β = 0 is −47.69 kJ mol−1. Similar to the cationic effects discussed for α, this number recovers the effects on basicity due to the generalised ionic character of the system, monopole (charge)–dipole based interactions that are absent in neutral solvents. More importantly this number provides a “reference” value for the anionic contribution to the ionic character of ionic liquids, with specific interactions providing the remaining contributions. Anions, because they have diffuse electron clouds, are more likely to have additional small dispersive corrections that are not recovered at this level of theory, so this number provides a first estimate of the effect. The anionic influence on basicity is ≈50 kJ mol−1 and is essentially double the ≈25 kJ mol−1 obtained for the cationic influence on acidity.
The second descriptor employed for β is the change of H–F bond length in the complex when compared to the unperturbed HF molecule, (Fig. 12, Table 7). Higher H-bond basicity of the anions, and thus the formation of stronger H-bonds, results in a stretching and presumably weakening of the H–F bond. The correlation can be significantly improved by removing the data point for the acetate anion, yielding equation Δr2 which allows for a good level of prediction for β.
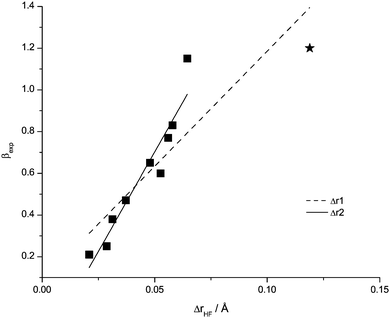 | ||
| Fig. 12 Data points and correlation functions of Δr1, Δr2 for Δr(HF) with H-bond basicity β. The value for the acetate anion is a star. | ||
2.8 The acetate anion
The acetate anion outlier has been investigated in more detail. For the acetate anion hydrogen transfer occurs, forming acetic acid and the F anion, resulting in a substantial elongation of the H–F bond in HF. The same problem occurs on replacing the neutral Brønsted acid with an imidazolium cation, a carbene and acetic acid are partially formed.39,40 Moreover, we find that the form of the potential energy well is very sensitive to the O⋯F distance. Fig. 13 shows the results of a series of calculations where the overall O⋯F distance was kept fixed and the proton moved along this axis. If the O⋯F distance is elongated by 10%, this results in two clearly defined energy wells. However if the distance is shortened by 10%, the result is a single, broad energy well, in which the potential energy surface is still asymmetric but relatively shallow. Thus the Δr(HF) descriptor is not a good predictor of β when the Brønsted basicity of the anion in question is high and proton transfer occurs in the gas phase. Nevertheless, if such a transfer is observed the anion belongs in a distinctive class and information has been gained from carrying out a quick and easy calculation.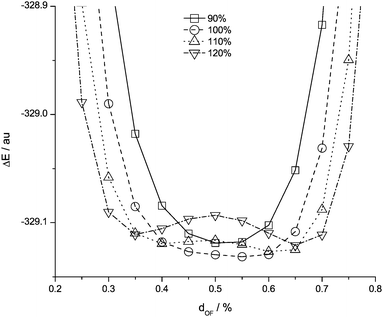 | ||
| Fig. 13 Potential energy surface for the proton transfer from HF to the acetate anion relative to the overall O⋯F distance (F at 1.0) for different OF relative to the equilibrium geometry. | ||
2.9 H-bond basicity: calculations using 4-nitroaniline
A third approach to the prediction of the H-bond basicity is in analogy to the experimental measurements in which the energy absorption of a dye, 4-nitroaniline, is measured by means of UV-Vis spectroscopy. In the lowest energy structures anions interact with the pendant NH2 group. A TD-DFT calculation is carried out and the lowest energy HOMO–LUMO excitation within 4-nitroaniline selected.The calculated wavelengths correlate well with the experimental H-bond basicity yielding equation TD-DFT1 (Fig. 14, Table 8). In contrast with the HF probe molecule the acetate anion is “well behaved” for this parameter. Although it is not an extreme outlier, a better fit can be obtained if the value for the [dca]− anion is removed, and a second correlation function TD-DFT2 has been calculated without this data point.
![Data points and correlation functions TD-DFT1 and TD-DFT2 for λ(NA) with H-bond basicity β. The value for [dca]− is a star.](/image/article/2013/CP/c3cp50521a/c3cp50521a-f14.gif) | ||
| Fig. 14 Data points and correlation functions TD-DFT1 and TD-DFT2 for λ(NA) with H-bond basicity β. The value for [dca]− is a star. | ||
2 is the squared correlation coefficient and sd is the standard deviation
| I | S | n |
2
|
sd | |
|---|---|---|---|---|---|
| TD-DFT1 | −32.23 | 0.09311 | 10 | 0.894 | 0.112 |
| TD-DFT2 | −34.62 | 0.09982 | 9 | 0.952 | 0.080 |
| ΔEA1 | −1.094 | −0.01729 | 10 | 0.925 | 0.094 |
| ΔEA2 | −1.226 | −0.01836 | 9 | 0.977 | 0.055 |
The energy of complex formation of the anions with 4-nitroaniline have been calculated, (Fig. 15, Table 8). A good correlation with β was obtained, however the [dca]− value is again an an outlier and removing it from the fit yields ΔEA2.
![Data points and correlation funtions ΔEA1 and ΔEA2 for ΔE(NA) with H-bond basicity β. The value for [dca]− is a star.](/image/article/2013/CP/c3cp50521a/c3cp50521a-f15.gif) | ||
| Fig. 15 Data points and correlation funtions ΔEA1 and ΔEA2 for ΔE(NA) with H-bond basicity β. The value for [dca]− is a star. | ||
2.10 The dicyanamide anion
Dicyanamide has been investigated in more detail, compared to the experimental values, the β value predicted using the probe HF molecule is too high, while that predicted using the dye 4-nitroaniline is too low. There is also potential for this computational/experimental miss-match to be an experimental problem, as it has proven very difficult to remove all of the Cl−. Synthesis is carried out via a metathesis reaction with a Cl− parent IL and the Cl− has proven extremely difficult to remove because the parent and daughter compounds have almost identical solubility in water and other potential solvents. Cl− has a higher β value than [dca]− and the presence of excess Cl− could artificially raise the experimentally determined β value.A larger range of anion coordination modes of HF and 4-nitroaniline with [dca]− have been explored including bridging, centre and end on. In addition, calculations were undertaken at the MP2 level. No substantial changes in the predicted β value were obtained. However, when [dca]− is coordinated on both sides by HF to form [HF–dca–HF]− decomposition into [dca–HF]− + HF releases 82.99 kJ mol−1 of energy leading to a β value of 0.58 (using the ΔEA2 equation) which is in-line with the experimental value of 0.60. To match the experimental β value, the computed HF association needs to be weaker, this could occur in solution if the [dca]− is interacting (more strongly than other anions) with another species (for example [dca]− could interact strongly with two cations, and less strongly with other surrounding cations).
Analysis of the 4-nitroaniline complex with [dca]− shows extensive mixing between the dye and anion fragment orbitals in the HOMO region, and identifying the dye based excitation becomes more difficult. The acetate ion also shows mixing, but to a lesser extent, while for all the other anions examined mixing was absent or very small. It is evident that the [dca]− anion shows unusual behaviour compared to the other ions, and would benefit from a deeper analysis that is beyond the scope of this work.
3 Conclusion
Various computational descriptors for predicting Kamlet–Taft solvatochromic H-bond acidity α and H-bond basicity β parameters have been evaluated.The most robust method for predicting α is, in direct analogy to the experiment, using TD-DFT to compute the HOMO–LUMO optical excitation within Reichardt's dye for a complex of Reichardt's dye with the cation, eqn (5). However, due to the high computational cost, and more expert knowledge required, this is not a suitable method for routine screening.
The simplest and most easily implemented method for predicting α requires only the minimum energy geometry and a property calculation to generate the electrostatic potential at all protons, the proton with the smallest |EPnuc| can be used to predict α, eqn (3). Where the proton with the smallest |EPnuc| is on a methyl group this would be best “confirmed” with an additional calculation that evaluates the energy of association of the cation with the probe molecule NCH, eqn (4), as it is possible for the dye molecule to form a more stable complex whereby the probe molecule interacts equally with a number of protons. This was shown for [C4C1py]+ and will be the case for pyrrolidinium based cations in general. While this double barrelled approach requires more effort, significantly more information than just α is obtained from the calculations. An additional method based on determining the association energy for the cation and Reichardt's dye was also tested, this is computationally expensive and appears to offer no greater accuracy than that obtained by employing the probe molecule NCH, eqn (6).
The effects of conformational variation and functionalisation of the cation have been investigated. Calculations have shown that conformational variation in alkyl groups does not substantially effect α, and thus for a rough screening conformational space does not need to be exhaustively searched. However, where the pendant groups contain functional groups capable of H-bonding and there is an opportunity for daisy chaining of the H-bonds to synergistically enhance one proton donor, the situation becomes more complex and the reference method using Reichardt's dye is more reliable.
The most robust method for predicting β is the energy of complex formation of the anion with 4-nitroaniline, eqn (10). Performing a TD-DFT calculation to obtain the HOMO–LUMO optical excitation within 4-nitroaniline is a simple subsequent calculation which also produced a good correlation, eqn (9). However, due to a high computational cost, and more expert knowledge required, these are not suitable methods for routine screening.
The simplest and most easily implemented method for predicting β requires calculation of the formation energy for a complex of the anion with the probe molecule HF. The energy of complex formation correlates well with β for the whole set of anions used in this study providing a good method for the prediction of H-bond basicity, eqn (7). The change in H–F bond length can also be obtained, eqn (8). This method is useful for identifying highly basic anions, such as the acetate [OAc]− anion, which will display distinctive properties. However, it is not good for evaluating the β values for this class of anions, and for these cases the reference method using the 4-nitroaniline dye is more reliable.
In cases where a miss-match between the computational and experimental values occurs, further investigation is prompted. The computationally predicted value can be used to help assess the purity of an IL. The miss-match of the computed and experimental values of α for [Me-DBU]+ prompted a re-evaluation of the purity of the sample and re-evaluation of the experimental result. The miss-match of the computed and experimental values of β for [dca]− has not been resolved, but may be due to Cl− contamination of the sample.
Where specific cations or anions have shown deviation ([(HOC2)3C1N]+, acetate, [dca]−), this can also indicate an IL with stronger networking between ions. The computational method treats each cation and anion in isolation, and the good match obtained with the experimental values for the bulk of the cations and anions studied indicates that additional association effects, due to other surrounding ions, are not dominating the specific H-bonding within these ILs.
More complex computations with the experimentally employed dye molecules produced parameters that performed very well and there is potential for these to be developed further to provide a quantitative prediction of α and β. Primarily a more extensive examination of a larger range of cations and anions is desirable.
A deeper understanding of the IL properties could be obtained from computationally including a more realistic solvent surrounding, this could be achieved by adding increasing numbers of ion pairs or a continuum solvation model. However selecting suitable stable geometries for clusters, and the absence of a well defined dielectric constant for ILs as well as the corresponding parameters for generating a robust/reliable solvent cavity make this challenging. Such methods would not be suitable for an easy to use “screening” procedure for routine application in association with synthetic work.
Experimentally the α and β scales are referenced to formally non-interacting solvents, that is solvents with no H-bond donor or H-bond acceptor capability. Thus, one could expect an α or β value of zero to correspond to a system where the association energy of the probe is close to zero (there may be dispersion effects which could result in a non-zero association energy). For α a “zero” of −7.32 kJ mol−1 and for β a “zero” of −9.2 kJ mol−1 have been determined for neutral systems (the α and β determined in these studies is slightly different from those studied here).24,25 Thus ≈10 kJ mol−1 of the association energy is due to dispersion effects (that can be recovered by B3LYP).
The “zero” values obtained for the IL ions studied here are ≈−25 kJ mol−1 for α and ≈−50 kJ mol−1 for β. These values provide an indication of the general effect of the ionic nature of the molecular ion on the H-bond. Replacing the H-bond donor of a neutral H-bonding pair with a cationic H-bond donor stabilises the H-bond by ≈15 kJ mol−1, and replacing the H-bond acceptor of a neutral H-bonding pair with an anionic H-bond donor stabilises the H-bond by ≈40 kJ mol−1. Thus indicating that the total energy “gained” by replacing the neutral H-bond with a doubly-ionic H-bond is ≈55 kJ mol−1, which seems rather large, and thus needs further investigation.
The energy of stabilisation due to the formation of specific H-bonds still needs to be added to this number, which provides an estimate of the additional stabilisation due to the ionic nature of the molecules involved in the H-bond. Additional polarisation effects could also be expected, which are not recovered in this estimate. At this stage it is also unclear how sensitive these estimates are to the specific probe molecules employed. These results also mean that a single parametrisation for neutral and IL solvents is unlikely to be achievable, the “zero” for each case occurs in a different place.
We have established several methods that employ simple gas-phase calculations to provide a good quality estimate of α and β. These calculations are simple and can be carried out routinely on a desktop computer in association with synthetic studies. In addition, the good qualitative correlation suggests that the α and β of a “conceptual” IL can be predicted from computation prior to synthesis and physical characterisation. We have shown how both computing and experimentally determining α and β values can support both; the experimental by evaluating purity and computational by evaluating the effects of networking within the IL. Using these results we have obtained an estimate for the energy associated with replacing both neutral molecules in a H-bond, with ionic molecules (≈55 kJ mol−1), thus forming the “doubly ionic” H-bond as found in ILs.
Computational details
All calculations have been performed using the Gaussian 09 software package,41 and the Becke three-parameter exchange42 with the Lee, Yang and Parr correlation.43 A 6-311+G(d,p) basis set was employed in all cases except for the the C6H5 rings of Reichardt's dye, where a 6-31G(d) basis set was used.44–47 Furthermore an “ultrafine” integration grid and an improved SCF convergence criterion of 10−9 were employed. All structures were fully optimised without constraints and confirmed as minima by frequency analysis (no negative frequencies).The complexes with Reichardt's dye were expensive, and to reduce the cost a smaller basis set was used on the five C6H5 rings, reducing the overall number of basis-functions by 30%. The basis set reduction was tested on the isolated dye, analysis of the electrostatic potential, the NBO charges, and the HOMO and LUMO showed that this methodology produced results very close to those obtained with the full 6-311+G(d,p) basis set. Structures with Reichardt's dye were generated by replacing the HCN probe with Reichardt's dye and optimising. The [(HOC2)3C1N]+ cation was the most difficult to address and a range of structures has been examined with H-bonding between methylene or alcohol H-atoms (of the cation) and the oxygen atom of the dye, in addition structures involving a chain of H-bonds between OH groups, and reorientation of the alkyl chains have been explored. The structural search has not been extensive, but has recovered a selection of the most likely H-bonding motifs. A range of low energy structures has been obtained and the lowest energy structure selected for analysis. A more robust and extensive search of structures could be undertaken but is beyond the scope of this article.
TD-DFT calculations employed the “TD” keyword and included only singlet excitations. TDDFT is well known to have difficulty in recovering accurate transition wavelengths for excitations involving charge transfer (CT) states and for spatially extended π-systems (both of which apply in this case), primarily due to an incorrect asymptotic behaviour of the exchange–correlation functional for large r.48–50 As expected the estimated experimental values of λ for Reichardt's dye and 4-nitroaniline are qualitatively and not quantitatively reproduced. However, as this study involves establishing a correlation, the effects of systematic errors are reduced and we obtain remarkably good estimates of α and β.
The computed HOMO–LUMO excitation wavelength of Reichardt's dye in the gas phase is λ = 845 nm, which corresponds to an α = −0.031, conversely when α = 0 the predicted λ = 809 nm. It is not possible to measure the λ of Reichardt's dye in the gas phase due to its negligible volatility, however, estimates range from a λmax of 709 nm to 1496 nm with values between 1010—1090 nm being favoured.51 The relevant excitation for 4-nitroaniline in the gas phase (S0 → S2) has a computed λ = 317 nm. Once the dye interacts with an anion, the important excitation is the HOMO–LUMO excitation (S0 → S1). This λ corresponds to a β = −2.99, conversely when β = 0 the predicted λ = 347 nm. An experimental value for 4-nitroaniline in the gas phase is λmax = 292 nm,52 and a recent high level computation predicts λ = 286 nm in the gas phase.53
EPnuc for all atoms is calculated in a single calculation on an optimised geometry using the Gaussian keyword “prop”. NCH and HF are used as probe molecules because they are small, and there is only one H-bond acceptor or donor site respectively. Also these molecules are linear reducing conformational variation. ΔE(NCH) was determined from the H-bond complex with NCH, initial structures were generated by placing the NCH molecule within H-bonding distance of relevant H atoms. Typically these were chosen on the basis of the electrostatic potential, however additional searches for other likely stable complexes were carried out. In the case of [(HOC2)3C1N]+ a range of configurations based on potential H-bonding motifs was sampled leading to a (reduced) range of minima, from which the lowest energy structure was selected for further analysis. A similar process was adopted to locate the anion–HF complexes.
Experimental details
All ionic liquids were synthesised and Kamlet–Taft measurements performed according to procedures published earlier.36References
- P. Wasserscheid and T. Welton, Ionic Liquids in Synthesis, Wiley-VCH, 2002 Search PubMed.
- F. Endres, D. MacFarlane and A. Abbott, Electrodeposition from Ionic Liquids, Wiley-VCH, Weinheim, 2008 Search PubMed.
- H. Ohno, Electrochemical aspects of ionic liquids, John Wiley & Sons, New Jersey, 2005 Search PubMed.
- B. Kirchner, Ionic Liquids, Springer Verlag, Berlin, 2010 Search PubMed.
- J. P. Hallett and T. Welton, Chem. Rev., 2011, 111, 3508–3576 CrossRef CAS.
- M. Freemantle, Chem. Eng. News, 1998, 76, 32–37 Search PubMed.
- M. J. Kamlet and R. W. Taft, J. Am. Chem. Soc., 1976, 98, 377–383 CrossRef CAS.
- R. W. Taft and M. J. Kamlet, J. Am. Chem. Soc., 1976, 98, 2886–2894 CrossRef CAS.
- M. J. Kamlet, J. L. Abboud and R. W. Taft, J. Am. Chem. Soc., 1977, 99, 6027–6038 CrossRef CAS.
- C. Reichardt, Chem. Rev., 1994, 94, 2319–2358 CrossRef CAS.
- C. Reichardt, Org. Process Res. Dev., 2007, 11, 105–113 CrossRef CAS.
- M. Abraham, Chem. Soc. Rev., 1993, 22, 73–83 RSC.
- L. M. Sprunger, A. Proctor, W. E. Acree, Jr. and M. H. Abraham, Phys. Chem. Liq., 2008, 46, 574–585 CrossRef CAS.
- C. F. Poole, S. N. Atapattu, S. K. Poole and A. K. Bell, Anal. Chim. Acta, 2009, 652, 32–53 CrossRef CAS.
- R. W. Taft, D. Gurka, L. Joris, P. v. R. Schleyer and J. W. Rakshys, J. Am. Chem. Soc., 1969, 91, 4801–4808 CrossRef CAS.
- D. Gurka and R. W. Taft, J. Am. Chem. Soc., 1969, 91, 4794–4801 CrossRef CAS.
- C. Laurence, J. Graton, M. Berthelot, F. Besseau, J.-Y. Le Questel, M. Lucon, C. Ouvrard, A. Planchat and E. Renault, J. Org. Chem., 2010, 75, 4105–4123 CrossRef CAS.
- O. A. Raevsky, Y. V. Liplavskiy, O. E. Raevskaya and R. Mannhold, SAR QSAR Environ. Res., 2009, 20, 501–518 CrossRef CAS.
- J. L. Anderson, J. Ding, T. Welton and D. W. Armstrong, J. Am. Chem. Soc., 2002, 124, 14247–14254 CrossRef CAS.
- L. Crowhurst, P. R. Mawdsley, J. M. Perez-Arlandis, P. A. Salter and T. Welton, Phys. Chem. Chem. Phys., 2003, 5, 2790–2794 RSC.
- L. Crowhurst, R. Falcone, N. L. Lancaster, V. Llopis-Mestre and T. Welton, J. Org. Chem., 2006, 71, 8847–8853 CrossRef CAS.
- G. Ranieri, J. P. Hallett and T. Welton, Ind. Eng. Chem. Res., 2008, 47, 638–644 CrossRef CAS.
- J. Palomar, J. S. Torrecilla, J. Lemus, V. R. Ferro and F. Rodriguez, Phys. Chem. Chem. Phys., 2010, 12, 1991–2000 RSC.
- J. A. Platts, Phys. Chem. Chem. Phys., 2000, 2, 3115–3120 RSC.
- J. A. Platts, Phys. Chem. Chem. Phys., 2000, 2, 973–980 RSC.
- M. H. Abraham, P. L. Grellier, D. V. Prior, P. P. Duce, J. J. Morris and P. J. Taylor, J. Chem. Soc., Perkin Trans. 2, 1989, 699–711 RSC.
- M. H. Abraham, P. L. Grellier, D. V. Prior, J. J. Morris and P. J. Taylor, J. Chem. Soc., Perkin Trans. 2, 1990, 521–529 RSC.
- P. Hunt, http://www.huntresearchgroup.org.uk/research_il_alpha_beta_intro.html, 2013.
- J.-M. Lee, S. Ruckes and J. M. Prausnitz, J. Phys. Chem. B, 2008, 112, 1473–1476 CrossRef CAS.
- A. Brandt, J. P. Hallett, D. J. Leak, R. J. Murphy and T. Welton, Green Chem., 2010, 12, 672–679 RSC.
- B. G. Johnson, P. M. W. Gill, J. A. Pople and D. J. Fox, Chem. Phys. Lett., 1993, 206, 239–246 CrossRef CAS.
- J. S. Murray and P. Politzer, Wiley Interdiscip. Rev.: Comput. Mol. Sci., 2011, 1, 153–163 CrossRef CAS.
- A. Bondi, J. Phys. Chem., 1964, 68, 441–451 CrossRef CAS.
- P. A. Hunt, B. Kirchner and T. Welton, Chem.–Eur. J., 2006, 12, 6762–6775 CrossRef CAS.
- P. G. Jasien and L. L. Weber, J. Mol. Struct. (THEOCHEM), 2001, 572, 203–212 CrossRef CAS.
- M. A. Ab Rani, A. Brandt, L. Crowhurst, A. Dolan, N. H. Hassan, J. P. Hallett, P. A. Hunt, M. Lui, H. Niedermeyer, J. M. Perez-Arlandis, M. Schrems, T. Q. To, T. Welton and R. Wilding, Phys. Chem. Chem. Phys., 2011, 13, 16831–16840 RSC.
- P. A. Hunt and I. R. Gould, J. Phys. Chem. A, 2006, 110, 2269–2282 CrossRef CAS.
- E. I. Izgorodina, U. L. Bernard and D. R. MacFarlane, J. Phys. Chem. A, 2009, 113, 7064–7072 CrossRef CAS.
- O. Holloczki, D. Gerhard, K. Massone, L. Szarvas, B. Nemeth, T. Veszpremi and L. Nyulaszi, New J. Chem., 2010, 34, 3004–3009 RSC.
- H. Rodriguez, G. Gurau, J. D. Holbrey and R. D. Rogers, Chem. Commun., 2011, 47, 3222–3224 RSC.
- M. J. Frisch, G. W. Trucks, H. B. Schlegel, G. E. Scuseria, M. A. Robb, J. R. Cheeseman, G. Scalmani, V. Barone, B. Mennucci, G. A. Petersson, H. Nakatsuji, M. Caricato, X. Li, H. P. Hratchian, A. F. Izmaylov, J. Bloino, G. Zheng, J. L. Sonnenberg, M. Hada, M. Ehara, K. Toyota, R. Fukuda, J. Hasegawa, M. Ishida, T. Nakajima, Y. Honda, O. Kitao, H. Nakai, T. Vreven, J. A. Montgomery, Jr., J. E. Peralta, F. Ogliaro, M. Bearpark, J. J. Heyd, E. Brothers, K. N. Kudin, V. N. Staroverov, R. Kobayashi, J. Normand, K. Raghavachari, A. Rendell, J. C. Burant, S. S. Iyengar, J. Tomasi, M. Cossi, N. Rega, J. M. Millam, M. Klene, J. E. Knox, J. B. Cross, V. Bakken, C. Adamo, J. Jaramillo, R. Gomperts, R. E. Stratmann, O. Yazyev, A. J. Austin, R. Cammi, C. Pomelli, J. W. Ochterski, R. L. Martin, K. Morokuma, V. G. Zakrzewski, G. A. Voth, P. Salvador, J. J. Dannenberg, S. Dapprich, A. D. Daniels, Ö. Farkas, J. B. Foresman, J. V. Ortiz, J. Cioslowski and D. J. Fox, Gaussian 09 Revision A.02, 2009 Search PubMed.
- A. D. Becke, J. Chem. Phys., 1993, 98, 5648–5652 CrossRef CAS.
- C. Lee, W. Yang and R. G. Parr, Phys. Rev. B: Condens. Matter Mater. Phys., 1988, 37, 785 CrossRef CAS.
- A. D. Mclean and G. S. Chandler, J. Chem. Phys., 1980, 72, 5639–5648 CrossRef CAS.
- R. Krishnan, J. S. Binkley, R. Seeger and J. A. Pople, J. Chem. Phys., 1980, 72, 650–654 CrossRef CAS.
- M. M. Francl, W. J. Pietro, W. J. Hehre, J. S. Binkley, M. S. Gordon, D. J. Defrees and J. A. Pople, J. Chem. Phys., 1982, 77, 3654–3665 CrossRef CAS.
- P. C. Harihara and J. A. Pople, Theor. Chim. Acta, 1973, 28, 213–222 CrossRef.
- D. J. Tozer, R. D. Amos, N. C. Handy, B. O. Roos and L. Serrano-Andres, Mol. Phys., 1999, 97, 859–868 CrossRef CAS.
- Z.-L. Cai, K. Sendt and J. R. Reimers, J. Chem. Phys., 2002, 117, 5543–5549 CrossRef CAS.
- A. Dreuw, J. L. Weisman and M. Head-Gordon, J. Chem. Phys., 2003, 119, 2943–2946 CrossRef CAS.
- J. Catalán, J. L. G. d. Paz and C. Reichardt, J. Phys. Chem. A, 2010, 114, 6226–6234 CrossRef.
- S. Millefiori, G. Favini, A. Millefiori and D. Grasso, Spectrochim. Acta, Part A, 1977, 33, 21–27 CrossRef.
- S. Frutos-Puerto, M. A. Aguilar and I. Fdez Galván, J. Phys. Chem. B, 2013, 117, 2466–2474 CrossRef CAS.
| This journal is © the Owner Societies 2013 |