 Open Access Article
Creative Commons Attribution 3.0 Unported Licence
Suppression of ghost distances in multiple-spin double electron–electron resonance†
Tona
von Hagens
a,
Yevhen
Polyhach
a,
Muhammad
Sajid‡
b,
Adelheid
Godt
b and
Gunnar
Jeschke
*a
aESR Group, Laboratory of Physical Chemistry, Wolfgang-Pauli-Strasse 10, 8093 Zurich, Switzerland. E-mail: gunnar.jeschke@phys.chem.ethz.ch; Fax: +41 44 633 14 48; Tel: +41 44 632 57 02
bUniversität Bielefeld, Fakultät für Chemie, OC II, Universitätsstr. 25, 33615 Bielefeld, Germany
First published on 22nd February 2013
Abstract
Distance measurements by pulse electron paramagnetic resonance techniques are increasingly applied to multiple-spin systems. In the double electron–electron resonance experiment, more than two dipolar coupled spins manifest in an increased total modulation depth and in sum and difference dipolar frequency contributions that give rise to additional peaks appearing in the distance distribution, which do not correspond to the real interspin distances of the system and are hence referred to as ghost contributions. These ghost contributions may be so prominent that they might be mistaken for real distance peaks or that real distance peaks shift their position or disappear. We present a simple approximate procedure to suppress ghost distances to a great extent by manipulating the experimentally obtained form factor during data analysis by a simple power scaling with a scaling exponent ζN = 1/(1−N), with N being the number of coupled spins in the system. This approach requires neither further experimental effort nor exact knowledge about labelling and inversion efficiency. This should enable routine application to biological systems. The approach is validated on simulated test cases for up to five spins and applied to synthetic model samples. The suppression of ghost distances with the presented approach works best for symmetric geometries and rigid molecules which, at the same time, are the cases where ghost contributions are most disturbing. The distance distributions obtained by power scaling are consistent with distributions that were obtained with previously obtained alternative approaches and agree, in some cases, strikingly well with the expectations for the true interspin distance distributions.
1 Introduction
Distance measurements by pulse electron paramagnetic resonance techniques are widely applied for structure-determination studies of biomacromolecules.1–4 The conversion to the distance domain of background-corrected time-domain data of the double electron–electron resonance (DEER) experiment, also named PELDOR, assumes well separated and homogeneously distributed spin pairs. However, DEER is increasingly applied to systems containing more than two spin labels,5,6 as for instance singly-labelled homooligomeric proteins.7–9 More than two dipolar coupled spins manifest in an increased total modulation depth1–3 and in higher-order sum and difference dipolar frequency contributions which in turn cause additional peaks in the distance distribution.10 These additional distance peaks do not correspond to the real interspin distances of the system and are hence referred to as ghost contributions. They may become so pronounced that they are mistaken as real peaks or lead to shifts or relative suppression of these real peaks. This can severely compromise the analysis of the distance distribution.Ghost contributions are most prominent and disturbing in highly symmetric and relatively rigid systems, whereas they can frequently, but not always, be negligible in unsymmetric multiple-spin systems.
Therefore, it is crucial to separate the pair signal from higher-order ghost contributions in order to identify ghost and real interspin distance peaks. A procedure for separating pair and three-spin contributions has been proposed.10 However, the experimental effort and requirements on the signal-to-noise ratio for this procedure are prohibitive for routine application to biological systems.
We were systematically studying the influence of more than two spins on simulated DEER data in time and distance domains and developed a further, computer-time demanding approach based on self-consistent iterative approximation of the true interspin distances starting from the primary experimental data containing also ghost contributions. During this work, we realized that the solution might be a lot more simpler than we initially thought.
We accidentally found that superposition of the logarithm of the form factor of a three-spin system with the logarithm of the form factor of the pair contribution by linear scaling leads to almost perfect agreement. Such linear scaling of the logarithm of the form factor for comparison of two data sets was implemented in earlier versions of the Deer Analysis software11 and has now been replaced by linear scaling of the original form factor. A further study of this effect revealed that the optimum scaling factor depends only on the number N of coupled spins, but not on modulation depth and labelling efficiency. The form factor, which is the primary DEER data divided by the background function, can be corrected simply by taking it to the power of ζN = 1/(N − 1).
In this work we show that this simple power scaling approach leads to a very strong suppression of ghost contributions.
This work is structured as follows. In the theory section, we depict the expressions for the DEER signal for an N spin system in general and state them explicitly for up to five spins. We show the origin of ghost frequency contributions and their influence on the distance distributions of symmetric multiple-spin systems. We introduce the general idea of power scaling and depict why it is reasonable to choose a scaling exponent ζN = 1/(N − 1). For a triradical system, we derive more explicitly how power scaling with ζN accomplishes to suppress ghost frequencies. The applicability range, especially concerning inversion efficiency, and the result of the power scaling approach on an equilateral triradical, a planar tetraradical and a planar pentaradical system is examined in detail. We furthermore demonstrate that power scaling does not significantly distort the distance distribution when erroneously applied to a two-spin system. It is investigated in detail whether the optimum scaling exponent ζopt, giving best agreement between the pair contribution and the ghost frequency containing expressions, coincides with ζN for a wide range of relative widths of the interspin distance distribution for up to five-spin systems. Our analysis based on simulated data is checked against noise and experimental imperfections with triradical model systems with equilateral and scalene geometry.
2 Theory
2.1 DEER signal of N coupled spins
Consider an N spin system with N(N − 1)/2 pairwise distances within the sensitivity range of the DEER experiment (approximately between 2 and 8 nm), sufficiently and homogeneously diluted such that the average distance between the nanoobjects is much longer than the sensitivity range of the DEER experiment. For simplicity we assume that all spins have the same EPR spectrum, so that each of them can take the role of observer or pumped spin. The nomenclature of interspin distances, angles within the nanoobject and towards the magnetic field vector is depicted in Fig. 1. The DEER signal V(t) is obtained by summing over the signals of all N possible observer spins10 | (1) |
![[B with combining right harpoon above (vector)]](https://www.rsc.org/images/entities/i_char_0042_20d1.gif) 0.
0. | (2) |
| fkl(t) = 1 − λl(1 − cos(ωklt)) | (3) |
![[B with combining right harpoon above (vector)]](https://www.rsc.org/images/entities/i_char_0042_20d1.gif) 0. Therefore, even in a rigid single crystal at an arbitrary orientation, there are N(N − 1)/2 dipolar frequencies. For example, in a three-spin system as depicted in Fig. 1B, the dipolar frequencies of the observer spin k in the high-field approximation are
0. Therefore, even in a rigid single crystal at an arbitrary orientation, there are N(N − 1)/2 dipolar frequencies. For example, in a three-spin system as depicted in Fig. 1B, the dipolar frequencies of the observer spin k in the high-field approximation are | (4) |
 | (5) |
cos![[thin space (1/6-em)]](https://www.rsc.org/images/entities/char_2009.gif) θkm = sin θkm = sin![[thin space (1/6-em)]](https://www.rsc.org/images/entities/char_2009.gif) χ χ![[thin space (1/6-em)]](https://www.rsc.org/images/entities/char_2009.gif) sin sin![[thin space (1/6-em)]](https://www.rsc.org/images/entities/char_2009.gif) θkl θkl![[thin space (1/6-em)]](https://www.rsc.org/images/entities/char_2009.gif) cos cos![[thin space (1/6-em)]](https://www.rsc.org/images/entities/char_2009.gif) ϕ + cos ϕ + cos![[thin space (1/6-em)]](https://www.rsc.org/images/entities/char_2009.gif) χ χ![[thin space (1/6-em)]](https://www.rsc.org/images/entities/char_2009.gif) cos cos![[thin space (1/6-em)]](https://www.rsc.org/images/entities/char_2009.gif) θkl θkl | (6) |
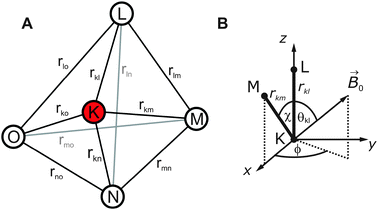 | ||
Fig. 1 Geometry of a multi-spin system. (A) Distances in a multi-spin system. Each of the N spins can play the role of the observer spin K. (B) Orientation of a triangular system with respect to the magnetic field vector ![[B with combining right harpoon above (vector)]](https://www.rsc.org/images/entities/i_char_0042_20d1.gif) 0 with the observer spin K at the origin of the frame being described by the polar angles θkl and ϕ. The angle between the two observer spin–pumped spin vectors is χ. 0 with the observer spin K at the origin of the frame being described by the polar angles θkl and ϕ. The angle between the two observer spin–pumped spin vectors is χ. | ||
The third frequency ωlm is encountered when the observer spin is l or m. Note that the sign of ωkl and ωkm was given wrongly in ref. 10. Experimental data are independent of absolute sign of the dipolar frequencies, since the cosine function is even. However, in the presence of additional exchange coupling, the sign matters.12
In general, the N(N − 1)/2 dipolar frequencies depend on as many distances and angles as are required to define the coordinates of the N spins up to translation and rotation. The total number of Cartesian coordinates is 3N and the number of translational and rotational degrees of freedom, to which internal distance measurements are insensitive, is 6 for non-linear systems. Hence, the total form factor depends on 3N − 6 geometric parameters. For the three-spin and four-spin case, the three or six distances, respectively, fully determine the geometry, while for larger systems the number of distances exceeds the number of free parameters.
For an ensemble of uniformly distributed nanoobjects with random orientation with respect to the magnetic field, as observed in microcrystalline powders or glassy frozen solutions, the form factor is obtained by powder averaging
 | (7) |
2.2 Contributions of the form factors by the number of coupled spins
Taking all previous considerations into account, the generalized form factor can be written as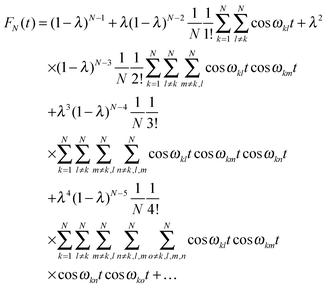 | (8) |
This sum representation contains the constant, unmodulated contribution that defines the modulation depth ΔN =1 − (1 − λ)N−1 and frequency-modulated terms that are grouped by the number of coupled spins involved. For clarity, we rewrite the form factor in a more compact way.
| FN(t) = (1 − λ)N−1 + λ(1 − λ)N−2PN(t) + λ2(1 − λ)N−3TN(t) + λ3(1 − λ)N−4QN(t) + λ4(1 − λ)N−5VN(t) + … | (9) |
 | (10) |
 | (11) |
 | (12) |
 | (13) |
| F2(t) = 1 − λ + λP2(t) | (14) |
| F3(t) = 1 − 2λ + λ2 + λ(1 − λ)P3(t) + λ2T3(t) | (15) |
| F4(t) = 1 − 3λ + 3λ2 − λ3 + λ(1 − λ)2P4(t) + λ2(1 − λ)T4(t) + λ3Q4(t) | (16) |
| F5(t) = 1 − 4λ + 6λ2 − 4λ3 + λ4 + λ(1 − λ)3P5(t) + λ2(1 − λ)2T5(t) + λ3(1 − λ)Q5(t) + λ4V5(t) | (17) |
Standard DEER experiments performed at the X-band (≈9.3–9.4 GHz) on nitroxide spin labels have inversion efficiencies of 0.2 ≲ λ ≲ 0.6 with λ ≈ 0.57 being standard in our laboratory for completely labelled systems on application of a 12 ns pump pulse at the maximum of the nitroxide spectrum. At the Q-band (≈34 GHz), typical inversion efficiencies that can be reached are usually slightly lower, with λ ≈ 0.4 being a usual upper limit in the absence of orientation selection and using broadband excitation with all pulses set to 12 ns.13 Orientation selection may have strong effects on the numerical λ value. Under such conditions, the pair frequency contribution is less and less predominant compared to the higher-order contributions the higher the number of coupled spins. Although an inversion efficiency of λ = 1 can be achieved in simulated data, this value cannot be reached at current state with usual spectrometers for systems consisting of only nitroxide radicals. Studying the influence of inversion efficiencies λ > 0.6 is thus at this point mostly of didactical and theoretical interest. Note however that this may change for other label types and with multi-frequency excitation14 or arbitrary waveform generator based spectrometers.15,16
The influence of the number of coupled spins for the same interspin distance and inversion efficiency λ is shown on simulated data in Fig. 2. In this simulation and all the following ones we assume a Rice distribution of distances corresponding to a Gaussian spatial distribution of the individual paramagnetic centers.17 The simulated dipolar evolution time is 8 μs and the simulated dwell time is 8 ns in this and all following simulations. The biradical curve (green) containing only pair contributions is virtually indistinguishable from the input distribution (grey). The most prominent ghost artefact is a distinct peak at lower distances, already very pronounced in the triradical (red) and almost as dominant as the real interspin distance peak in the tetraradical case (violet).
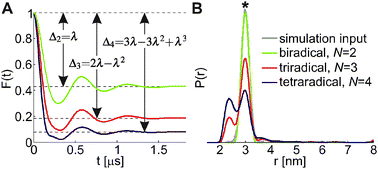 | ||
| Fig. 2 Simulated form factors (A) and distance distributions obtained by Tikhonov regularization (B) of a two-spin (green), three-spin (red) and four-spin (violet) system. All systems feature a single mean distance (equilateral triangle and regular tetrahedron). Interspin distances are Rice distributed around 3 nm with a standard deviation of 0.1 nm, inversion efficiency is λ = 0.57. Most ghost distances are slightly shorter and appear as clear and distinct peaks. The true interspin distance peak in this and all following figures is marked with an asterisk. | ||
The form factor at time t = 0 is normalized to unity. The multiplicities of higher-order frequency contributions follow Pascal's triangle with a value of 1 at t = 0 for the highest-frequency contribution. In a three-spin system P3(0) = 2 and T3(0) = 1, in a four-spin system Q4(0) = 1, T4(0) = 3 and P4(0) = 3, in a five-spin system V5(0) = 1, Q5(0) = 4, T5(0) = 6 and P5(0) = 4 and so on for higher spin systems. Note that in a previous publication,10 the normalization coefficients of the frequency modulated terms (eqn (10)–(13)) missed the factorial in the denominator.
Previous work on spin counting showed that the inversion efficiency λ is well reproducible on a given spectrometer and a given probehead.18,19 This inversion efficiency λ can be varied experimentally by variation of the pump pulse power. In the case of incomplete labelling, when λ is replaced by fλ, with a fraction f < 1 of labelled spins, all expressions given in this work still hold.
In the case of known labelling efficiency f, the modulation depth
| ΔN = 1 − (1 − λ)N−1 | (18) |
Elimination of the constant contribution and renormalization of the maximum value to unity gives the dipolar evolution function FN,0(t) that contains only dipolar frequency contributions
 | (19) |
The dipolar evolution functions are used to compare differences between spin systems in the time domain and are the input data for the Tikhonov regularization that provides the distance distributions. Due to the differences in ΔN, the form factors FN(t) do not converge to the same value at long times t when either N, f or λ are different, whereas the dipolar evolution functions FN,0(t) converge to zero and are thus suitable to detect differences in primary data.
2.3 Ghost distances originating from the form factor
When more than two spins are present, the signal (eqn (8)) contains products of cosines leading to combination frequency contributions because | (20) |
Conversion from the time to the distance domain during data analysis assigns distances to every frequency in the form factor, thus also to the combination frequencies. We therefore refer to them as ghost distances as they appear in the distance distribution, even though they do not correspond to real interspin distances. In general, sum contributions of two dipolar frequencies always introduce a peak at a distance that is shorter than both distances. Difference combinations however introduce a peak at a distance that is longer than the shorter of the two distances when the difference frequency is positive or a peak at a distance that is shorter than the longer distance when the difference frequency is negative, because the information content of a negative frequency is its absolute value. Combinations of more than two frequencies may appear anywhere in the distance distribution.
Knowing their position would be beneficial, but this is not straightforward. By defining a ghost frequency ωghost based on eqn (20), a ghost distance rghost can be assigned analogous to a real interspin distance (eqn (4)), assuming gL ≈ gM.
 | (21) |
 | (22) |
However, no closed expressions can be obtained after powder averaging. If the structure is known, which is usually only the case for symmetric homooligomers, the ghost distances can be predicted numerically. Note also that ghost distances are broadly distributed even in the case of a completely rigid spin system (Fig. 3).
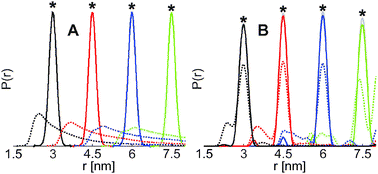 | ||
| Fig. 3 Simulation of input interspin and ghost distances (A) and distance distributions obtained from Tikhonov regularization of original and power scaled form factors (B) in equilateral triradicals with Rice distributed interspin distances of 3.0 nm (black), 4.5 nm (red), 6.0 nm (blue) and 7.5 nm (green) and a standard deviation of 0.1 nm. (A) Simulated input distance distribution (solid lines) and ghost distances (dashed lines) according to eqn (22). (B) Distance distributions obtained after Tikhonov regularization (regularization parameter α = 10) from simulation with λ = 0.57 of triradical form factors (dashed lines) and scaled triradical form factors (solid lines). The distance distributions obtained from the pair contribution (grey) are hidden underneath the power scaled triradical distance distributions. Slightly different distance distributions are obtained from the form factor after Tikhonov regularization than by adding the modulation depth scaled pair and ghost distance distribution. The areas of the simulated distance distributions are normalized to unity. | ||
2.4 Approaches to extract true interspin distances
Using a series of DEER traces at variable attenuation of the pump pulse power, it is possible to extract the true interspin distance distribution.10 The form factor evaluated in eqn (15) can be rewritten gathering terms according to the order of λ instead of gathering terms according to the number of spins involved.| F3(t) = (1 − λ)2 + λP3(t) + λ2(T3(t) − P3(t)) | (23) |
| F3(ti) = (1 − λj)2 + a1,tiλj + a2,tiλj2 | (24) |
It is furthermore possible to extract the three-spin contribution modeled with a Monte Carlo simulation of the uncorrected distance distribution until a self-consistent solution is obtained. Briefly, assuming that the distances are uncorrelated and the number of spins N is known, all multi-spin form factors can be estimated from the distance distribution and can then be subtracted from the complete form factor to obtain an estimate of the pair contribution. Tikhonov regularization of this estimate provides an improved distance distribution. This procedure is repeated until the distance distribution is self-consistent. Although this algorithm leads to improved distance distributions in some cases, we found that it is easily unbalanced by errors in the estimate of the total inversion efficiency λf. Furthermore, the assumption of uncorrelated pair distances is poor except for equilateral three-spin systems and rare four-spin systems with tetrahedral symmetry. Moreover, the algorithm may not always converge – especially when the spin system does not have such a symmetric geometry. For geometries lacking such high symmetry, we observed at times convergence to the wrong distance distribution, especially when the first guess was poor.
2.5 Power scaling to suppress ghost distances
We accidentally observed thatζ![[thin space (1/6-em)]](https://www.rsc.org/images/entities/char_2009.gif) ln[F3(t)] ≈ ln[F2(t)] ln[F3(t)] ≈ ln[F2(t)] | (25) |
The effect of power scaling on an equilateral triradical system for a range of interspin distances at a single inversion efficiency λ = 0.57 is shown in Fig. 3B. The true interspin distance information is indeed recovered.
We have furthermore tested the power scaling approach on simulated data for a three-spin system with C3 symmetry, a four-spin system with C4 symmetry and a five-spin system with C5 symmetry for a broad range of inversion efficiencies λ (Fig. 4).
![Comparison between original and power scaled dipolar evolution functions (A, C, E, G, I, K) and distance distributions after Tikhonov regularization with regularization parameter α = 10 (B, D, F, H, J, L) of a simulated equilateral triradical (A–D), a square geometry tetraradical (E–H) and a planar pentagon pentaradical (I–L) versus the corresponding pair contributions with Rice distributed interspin distance of 3 nm ± 0.1 nm for inversion efficiencies λ = [0.2, 0.4, 0.6, 0.8, 1.0]. (A) Three-spin dipolar evolution functions and pair contribution. (B) Distance distributions of the original three-spin dipolar evolution functions F0(t). (C) Scaled three-spin dipolar evolution functions and the pair contribution. (D) Distance distributions of the scaled three-spin dipolar evolution functions F0ζ(t). (E) Four-spin dipolar evolution functions and pair contribution. (F) Distance distributions of the original four-spin dipolar evolution functions F0(t). (G) Scaled four-spin dipolar evolution functions and the pair contribution. (H) Distance distributions of the scaled four-spin dipolar evolution functions F0ζ(t). (I) Five-spin dipolar evolution functions and pair contribution. (J) Distance distributions of the original five-spin dipolar evolution functions F0(t). (K) Scaled five-spin dipolar evolution functions and the pair contribution. (L) Distance distributions of the scaled five-spin dipolar evolution functions F0ζ(t).](/image/article/2013/CP/c3cp44462g/c3cp44462g-f4.gif) | ||
| Fig. 4 Comparison between original and power scaled dipolar evolution functions (A, C, E, G, I, K) and distance distributions after Tikhonov regularization with regularization parameter α = 10 (B, D, F, H, J, L) of a simulated equilateral triradical (A–D), a square geometry tetraradical (E–H) and a planar pentagon pentaradical (I–L) versus the corresponding pair contributions with Rice distributed interspin distance of 3 nm ± 0.1 nm for inversion efficiencies λ = [0.2, 0.4, 0.6, 0.8, 1.0]. (A) Three-spin dipolar evolution functions and pair contribution. (B) Distance distributions of the original three-spin dipolar evolution functions F0(t). (C) Scaled three-spin dipolar evolution functions and the pair contribution. (D) Distance distributions of the scaled three-spin dipolar evolution functions F0ζ(t). (E) Four-spin dipolar evolution functions and pair contribution. (F) Distance distributions of the original four-spin dipolar evolution functions F0(t). (G) Scaled four-spin dipolar evolution functions and the pair contribution. (H) Distance distributions of the scaled four-spin dipolar evolution functions F0ζ(t). (I) Five-spin dipolar evolution functions and pair contribution. (J) Distance distributions of the original five-spin dipolar evolution functions F0(t). (K) Scaled five-spin dipolar evolution functions and the pair contribution. (L) Distance distributions of the scaled five-spin dipolar evolution functions F0ζ(t). | ||
The unscaled dipolar evolution functions as well as the distance distributions show dwindling agreement with the corresponding pair contribution data at the higher λ. In a nutshell, for moderate inversion efficiencies λ ≲ 0.6, as they are usual in nitroxide–nitroxide DEER measurements, scaling with an exponent ζN indeed suppresses ghost peaks efficiently up to N = 4. For N = 5, some intentional reduction of inversion efficiency to λ = 0.4 is required. For the triradical (Fig. 4A–D), the data scaled with ζN = 1/2 show a good agreement with the pair contribution except for the high λ-values of 0.8 and 1.0. For the tetraradical (Fig. 4E–H), the data scaled with ζN = 1/3 show a good agreement with the pair contribution except for high values of λ > 0.6. The relative intensity is however not exactly the one of the pair contributions. For the pentaradical (Fig. 4I–L), at the larger λ the ghost distance peaks have become so prominent that the real distance peak at 4.85 nm seems like a rather insignificant artefact. In fact, already at λ = 0.6 close to our experimental X-band inversion efficiency of λ = 0.57, the low distance ghost peak near 2.4 nm is significantly stronger than the real distance peak at 4.85 nm. Even at λ = 0.2, the influence of ghost distances is still visible. Power scaling with ζN = 1/4 improves the distance distribution, but only for values of λ ≤ 0.4 the agreement is good.
For the triradical case, we have also checked whether ζN is the optimum scaling exponent for ghost peak suppression assuming λ = 0.57 as we have it under optimized experimental conditions (Fig. 5A and B). Indeed the ghost peak is not fully suppressed for higher values of ζ, whereas lower values cause slight artificial narrowing of the real distance peak.
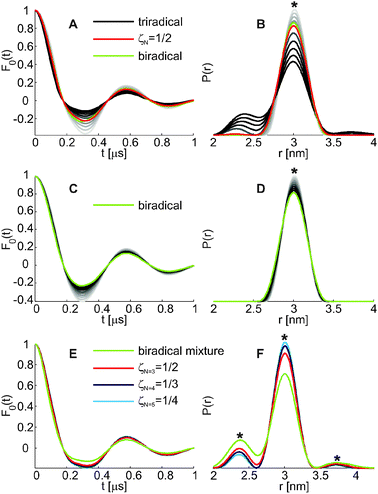 | ||
Fig. 5 Effect of a scaling exponent between ζ = 0.1 (light grey) and no scaling (ζ = 1, black) on a simulated Rice distributed interspin distance of 3 nm with standard deviation of 0.1 nm at an inversion efficiency λ = 0.57 in time and distance domains for an equilateral triradical (A and B) and a biradical (C and D) and the effect of a scaling exponent ζN = 1/(N − 1) for N = 3 (red), N = 4 (violet), N = 5 (blue) on a mixture of biradical signals (E and F). (A and B) Data for the scaling exponent ζN = 1/2 (red) are nearly indistinguishable from the biradical contribution (green, hidden underneath the red curve), whereas the triradical curve without scaling (black) differs. (C and D) In the biradical (green), only the amplitude of the modulation increases with decreasing ζ. Neither F0ζ(t) nor P(r) changes drastically. (E and F) Mixture of Rice distributed pair contributions with 2.39 ± 0.1 nm, 3 ± 0.1 nm and 3.7 ± 0.2 nm with the intensity ratios of 0.37![[thin space (1/6-em)]](https://www.rsc.org/images/entities/char_2009.gif) : :![[thin space (1/6-em)]](https://www.rsc.org/images/entities/char_2009.gif) 1 1![[thin space (1/6-em)]](https://www.rsc.org/images/entities/char_2009.gif) : :![[thin space (1/6-em)]](https://www.rsc.org/images/entities/char_2009.gif) 0.1, modelling approximately the equilateral triradical distance distribution in (B). Application of power scaling affects the distance distribution, however, none of the true interspin distances disappears completely as in the triradical case. 0.1, modelling approximately the equilateral triradical distance distribution in (B). Application of power scaling affects the distance distribution, however, none of the true interspin distances disappears completely as in the triradical case. | ||
We have also tested how erroneous power scaling with ζ = ζN=3 = 1/2 affects the pair form factor (N = 2, proper scaling factor ζN=2 = 1, see Fig. 5C) and the corresponding distance distribution (Fig. 5D). Such scaling leads to changes in the decay of the dipolar oscillation, but does not introduce prominent significant ghost peaks. Only slight broadening or narrowing of the real peak in the distance domain is observed. Application of power scaling with ζN = 1/(N − 1) for N = 3, N = 4 and N = 5 on a mixture of pair contributions that approximately models an equilateral triradical case does however have a non-negligible effect on the distance distribution (Fig. 5E and F). A slight shift of the relative intensities is observed, but none of the peaks disappears completely as in the triradical case.
In contrast to experimental data, simulated data can have zero noise. We have added stochastic noise on simulated time domain DEER data of an equilateral triradical (Fig. 6) in order to check what signal-to-noise ratio (SNR) is needed to reliably apply the power scaling approach. This test however does not include noise-related uncertainties in background correction that may arise in an experimental case. Fig. 6 shows that power scaling but also the emergence of ghost peaks are relatively robust towards noise. Up to SNR = 50 (light blue), there is virtually no difference in the original distance distribution or the one obtained from the power scaled form factor. For SNR = 20 (green), the shape of the ghost peak changes slightly, but correction is still almost complete, however with a tiny shift of the main peak at 3 nm, but this is also present in the original, uncorrected data. Even for SNR = 10 (orange) and SNR = 5 (red), power scaling cleans up the distance distribution almost completely even though the power scaled dipolar evolution functions look extremely noisy. In these cases, however, the original distance distribution is already so noisy that a ghost peak would probably anyway be interpreted as a residual noise artefact by an experienced experimentalist.
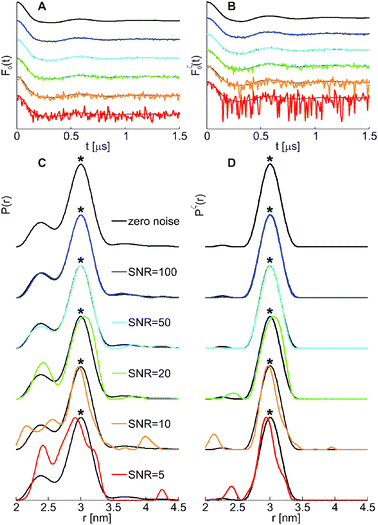 | ||
| Fig. 6 Influence of a decreasing signal-to-noise ratio on the original (A and C) and power scaled (B and D) dipolar evolution functions (A and B) and distance distributions (C and D) of an equilateral triradical system with simulated Rice distributed interspin distance of 3 nm with a standard deviation of 0.1 nm at an inversion efficiency λ = 0.57. Shown are zero noise data (black), SNR = 100 (blue), SNR = 50 (light blue), SNR = 20 (green), SNR = 10 (orange) and SNR = 5 (red), Tikhonov regularized with a regularization parameter of α = 10, the zero noise data are shown in every plot for direct comparison. Simulations were done for dipolar evolution times of 8 μs. (A) Original dipolar evolution functions F0(t). (B) Dipolar evolution functions F0ζ(t) power scaled with ζN = 1/2. (C) Original distance distribution P(r). (D) Distance distributions Pζ(r) obtained from dipolar evolution functions power scaled with ζN = 1/2. | ||
Such power scaling is easily implemented into data analysis and does not require further experimental effort. However, to obtain quantitative understanding why this approach works so nicely is rather tedious. As a first step we rewrite the form factor (eqn (9))
| FN(t) = (1 − λ)N−1[1 + XN] | (26) |
 | (27) |
 | (28) |
 | (29) |
 | (30) |
2.6 Power scaling in a three-spin system
Applying power scaling to the form factor of a three-spin system and collecting terms involving the same power of λ up to the order λ3, one obtains a scaled form factor of | (31) |
 | (32) |
 | (33) |
 | (34) |
More new ghost terms appear when considering orders greater than λ3.
Examining eqn (31) gives interesting insights. Comparing pair and higher-spin contributions to F3(t) in eqn (15) shows that the prefactors of the frequency contributions have changed. The leading ghost frequency terms in both eqn (15) and (31) are of the order λ2. These and higher terms still contain the original ghost frequency contributions T3(t), but with a reduced relative amplitude. Scaling does however also introduce new ghost terms containing unphysical combination frequencies. They are unphysical as only one spin can be the observer spin. The ratio of the pair to the ghost signal in the original three-spin dipolar evolution function, RP3−T3, can be deduced from the coefficients in eqn (15) taking into account an additional factor of 2 for the pair contribution, as P3(t = 0) = 2, whereas T3(t = 0) = 1. One obtains RP3−T3 = 2(1 − λ)λ−1. After power scaling, this ratio is in the second order approximation RP3−T3ζ,O2 = 6λ−1 and in the third order approximation RP3−T3ζ,O3 = 6(λ + λ2)−1. The improvement coming from scaling is hence the ratio of pair to ghost before and after scaling. In second order approximation, the improvement coming from scaling is
 | (35) |
 | (36) |
It might appear that the newly introduced G-terms (eqn (32)–(34)) decrease the signal-to-ghost ratio, but note that they have opposite sign. To the extent that they contain similar frequencies as T3(t), destructive interference will actually improve the signal-to-ghost ratio. This is particularly the case in highly-symmetric systems where the orientation dependent dipolar frequencies between all spins are very similar, ωkl ≈ ωkm. Hence, the more symmetric and rigid the system under observation is, the better is this destructive interference.
The remaining ghost contributions G3(2)(t) and G3(3)(t) are spread over a broader frequency range and thus the distance range. Moreover, except for G3±(t), they are cancelled by Tikhonov regularization with the non-negativity constraint P(r) ≥ 0, as due to their sign they correspond to negative peaks in the distance distribution.
This combination of partial interference of original and newly introduced ghost contributions and suppression of the remaining leading newly introduced ghost contributions by the non-negativity constraint semi-quantitatively explains the good performance of simple power scaling.
2.7 Optimization of the scaling exponent
Although the scaling exponent ζN provides good results, it is not clear whether the remaining ghost contributions are indeed minimized at this exponent. We define the optimum scaling exponent ζopt as the exponent giving best agreement between the scaled dipolar evolution function FN,0ζ(t) and the pair contribution. Such comparison in the time domain is not only closer to the primary experimental data than comparison in the distance domain, it is also unaffected by the mathematical difficulties that arise from the ill-posed problem of converting the time-domain data to a distance distribution. Minimization of the deviation in the time domain has the disadvantage that the beneficial effect of the non-negativity constraint P(r) ≥ 0 in Tikhonov regularization is not considered. Still we prefer optimization in the time-domain, since otherwise the result would depend on the choice of the regularization parameter α in Tikhonov regularization.However, to check whether there is a substantial difference in ζopt between time and distance domains, we tested the agreement for an equilateral triradical and a tetraradical with square geometry (Fig. 7) and a planar regular pentaradical (Fig. 8). There is a small deviation between ζopt in time and distance domains that is somewhat more pronounced for a tetraradical, but there is a substantial improvement for any of the two ζopt values and also for taking ζN. Fig. 7A and C show that the rmsd-valley of the scaling exponent optimization is relatively broad and even though there exists a distinct minimum, ζopt is neither far away from the value of ζN, nor does the rmsd-value differ drastically. The disagreement is higher for N = 4 than for N = 3, the corresponding distance distributions (Fig. 7B and D) differ only very slightly. Power scaling almost completely removes the ghost peaks in the distance distribution of the triradical, all distributions are virtually indistinguishable. The distribution of the tetraradical is improved and small differences between the ζoptF0(t) and ζoptP(r) can be seen.
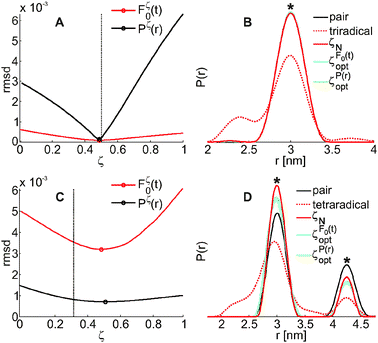 | ||
| Fig. 7 Optimization of the scaling exponent ζ in time and distance domains for a triradical with equilateral geometry (A and B) and a tetraradical with square geometry (C and D) with side lengths of 3 nm Rice distributed with a standard deviation of 0.1 nm at λ = 0.57. (A and C) Rmsd of the power scaled dipolar evolution function F0ζ(t) with the pair signal (red) and of the power scaled distance distribution Pζ(r) with the pair distance distribution (black). ζN is indicated by the vertical dashed line. (B and D) Comparison of pair distance distribution (black), the original multi-spin distance distribution (dashed red) and the power scaled distance distributions with the scaling exponents ζN (red), ζoptF0(t) (cyan) and ζoptP(r) (green). | ||
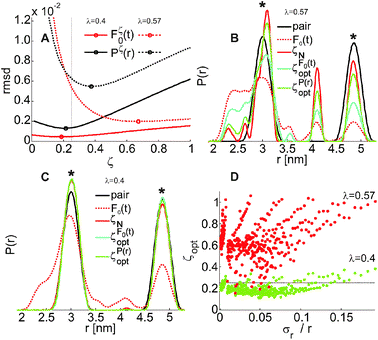 | ||
| Fig. 8 Optimization of the scaling exponent in time and distance domains (A) of a pentaradical with regular pentagon geometry with a side length of 3 nm, Rice distributed with a standard deviation of 0.1 nm with the corresponding distance distributions (B and C) and optimization of the pentaradical scaling exponent in the time domain as a function of the relative width σr/r of the distribution (D). Results are shown for λ = 0.57 and λ = 0.4. (A) ζoptF0(t) ≈ ζoptP(r) ≈ ζN for λ = 0.4 (solid lines), but the deviation is larger for λ = 0.57 (dashed lines). ζN = 1/4 is indicated by the vertical dashed line. (B) λ = 0.57: original, pair and power scaled distance distributions. (C) λ = 0.4: original, pair and power scaled distance distributions. (D) The power scaling approach breaks down for λ = 0.57 (red) (compare Fig. 4I–L). ζopt does not follow any trend for a given value of σr/r for λ = 0.57, but for λ = 0.4 (green), ζopt ≈ ζN. Simulated side lengths were between 2 and 8 nm, Rice distributed with standard deviations between σr = 0.01 nm and 0.5 nm. | ||
The same is in principle true for a pentaradical (Fig. 8). As was already seen in Fig. 4I–L, power scaling only gives good results for λ ≤ 0.4. It is thus plausible that also the determination of the optimum scaling exponent in time and distance domains differs more for λ = 0.57 than for λ = 0.4. Power scaling of the form factor at an inversion efficiency of λ = 0.57 (Fig. 8B) does not recover the true interspin distance distribution, even if taking the optimized scaling exponent. Even though this implies a break-down of the power-scaling approach, the changes in the distance distribution of the scaled and unscaled form factors do reveal the presence of ghost peaks, which may be a useful hint when analysing experimental data. For λ = 0.4, the agreement with the pair contribution (Fig. 8C) is very good for all scaling exponents and the true distance distribution is recovered with an accuracy that is comparable to experimental errors in distance distributions of biradicals.
For tri- and tetraradicals (Fig. 9), ζopt as a function of σr/r is a distinctive curve. For relatively rigid equilateral triradical cases (σr/r ≲ 0.07) we find ζopt ≈ ζN. For the monodistanced regular tetrahedron tetraradical ζopt ≈ ζN for a broad range of σr/r. For the square tetraradical however, ζopt differs from ζN for most values of σr/r. When interspin distances become more flexible, ζopt approaches 1, being equivalent to less correction. This agrees with the observation that for a wider distance distribution, the ghost peaks are not that distinct and may be more hidden underneath the anyway relatively broad interspin distance peak. This is plausible as ghost contributions are even more broadly distributed than the initial dipolar frequencies.
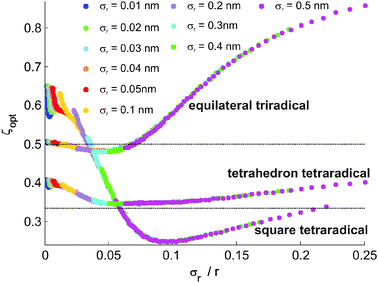 | ||
| Fig. 9 Optimum scaling parameter ζopt determined by minimized rmsd in the time domain for triradicals with equilateral geometry and tetraradicals with regular tetrahedron and square geometry. Simulated side lengths are between 2 nm and 8 nm, standard deviations of the Rice distribution between σr = 0.01 nm and σr = 0.5 nm. Simulated dipolar evaluation time was 20 μs and inversion efficiency λ = 0.57. | ||
Note however that less scaling does not mean that ghost contributions are absent. It only means that the suppression of multiple-spin pollutions through scaling is not as successful anymore.
We have also examined the dependency of ζopt for different values of λ (data not shown). In the region where power scaling gives reasonable results, e.g. where ζopt as a function of σr/r follows a clear-cut trend, ζopt for a given value of σr/r is nearly independent of λ.
2.8 Power scaling on triradical model systems
The tests with simulated data discussed above have the advantage that the true distance distribution is precisely known. To check for stability of the approach against noise and experimental imperfections, we performed experiments on triradical model systems22,23 at X-band frequency. The outcome of such experiments is not expected to depend on EPR frequency if inversion efficiency is the same and as long as orientation selection can be avoided. In general, inversion efficiency λ tends to decrease with increasing EPR frequency which makes the problem of ghost contributions less serious and ghost suppression more efficient.We choose the two triradicals T111 (Fig. 10) and T111inv (Fig. 11) with equilateral geometry and triradical T012 (Fig. 12) with scalene geometry (ra ≠ rb ≠ rc).
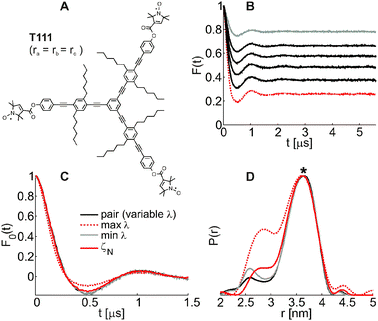 | ||
| Fig. 10 Comparison of the different approaches to retrieve the true interspin distance information of the equilateral triradical model system T111 (A) in time (B and C) and distance domains (D). (A) Structure of triradical T111. (B) Series of form factors at variable λ with maximum λ ≈ 0.5 (red, dashed), minimum λ ≈ 0.1 (grey). (C) Comparison of the dipolar evolution functions. The trace at maximum λ differs the most. (D) Results of the distance domain. The different approaches all yield a similar P(r). | ||
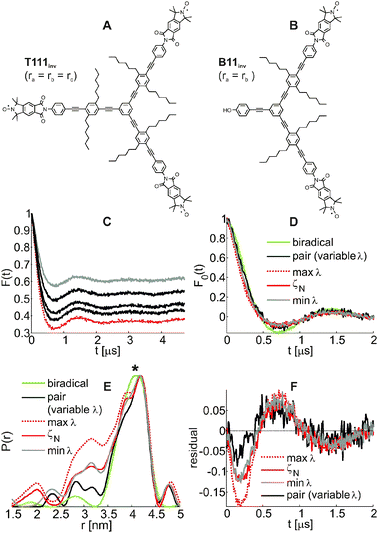 | ||
| Fig. 11 Model triradical T111inv (A) with the same interspin distance as biradical B11inv (B) in time (C, D, F) and distance domains (E). (A) Structure of triradical T111inv. (B) Structure of biradical B11inv. (C) Series of form factors at variable λ with maximum λ ≈ 0.4 (dashed red) and minimum λ ≈ 0.2 (grey). (D) Dipolar evolution functions of biradical B11inv (green) and triradical T111inv at minimum λ (grey) and maximum λ (dashed red), power scaled with ζN = 1/2 (red) and the pair contribution from the variable λ approach (black). (E) Distance distributions obtained from the biradical form factor (green), the pair contribution of the variable λ approach (black), the triradical form factor at maximum λ (dashed red), the form factor power scaled with ζN (red) and the form factor at minimum λ (grey). Scaling with ζN, measuring at minimum λ and the variable λ approach reduce the ghost peak in the distance distribution. (F) Residuals against the biradical data of the triradical dipolar evolution functions at maximum λ (dashed red), power scaled with ζN (red) and at minimum λ (grey). | ||
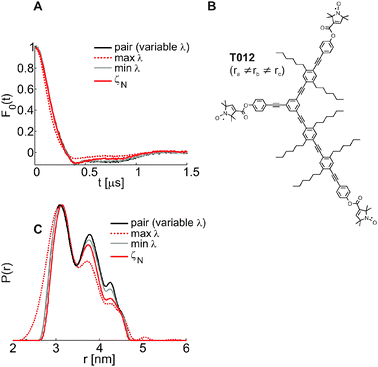 | ||
| Fig. 12 Attemptive extraction of the true interspin distance information for scalene triradical T012 (B) with power scaling and extraction at variable λ in time (A) and distance domains (C). (A) Pair contribution from the variable λ approach (black) and dipolar evolution functions at maximum λ (red), power scaled with ζN and at minimum λ. (B) Structure of triradical T012. (C) Distance distributions of T012. Power scaling with ζN does not lead to a completely reasonable distribution, however the distribution is less broadened and distance peaks at longer distances start to appear. The pair contribution originating from variable λ (black) seems most reasonable, but still not completely corrected and agrees with the power scaled distance distribution. | ||
Data for triradical T111inv can be compared to the corresponding biradical B11inv, which has the same length and relative orientation of the spin-labelled arms. Only in this case the true interspin distance information is known. Otherwise, the power scaled dipolar evolution functions can be compared with the distance distribution measured at minimum λ and with the pair contribution originating from fitting a series of DEER traces at variable λ, as described in ref. 10.
In principle, a determination of the optimum scaling exponent ζopt can be done by comparing the pair contribution from the variable λ approach with the power scaled dipolar evolution function. However, we observed that this determination is instable as it is extremely sensitive towards differences in background correction and other experimental uncertainties. At times, we obtained values of ζopt close to zero (data not shown).
T111 and T012 are spin labelled with the conformationally flexible dehydroperoxyl (DHP) and T111inv and B111inv with the conformationally unambiguous spin label (CUSL).23,24
When comparing experimental data, the maximum of the distance distribution and not the area, as in the simulated cases, is normalized to unity because artefacts coming from noise, short dipolar evolution times and incomplete background correction often manifest in the form of distance peak artefacts.
The results for triradical T111 are self-consistent (Fig. 10). The distance distributions of the pair contribution originating from the variable λ approach, scaling with ζN and from the form factor with the lowest inversion efficiency (minimum λ) agree very well with each other.
For triradical T111inv (Fig. 11), scaling with ζN = 0.5 (solid red line in Fig. 11E) improves the distance distribution with respect to the one obtained at maximum inversion efficiency (dashed red line) and leads to a similar result as measured at a low inversion efficiency (minimum λ, solid grey line). Orientation selection and thus incomplete excitation are tentatively assigned to cause the relatively low values of total modulation depth and inversion efficiency at maximum pump pulse power of only Δ = 0.63 and λ = 0.39 respectively. The spin label CUSL of T111inv and B11inv is conformationally unambiguous and might therefore be problematic. To verify that the multispin effect is not strongly biased by orientation selection, we conducted field averaged DEER measurements of B11inv and T111inv in addition to the single-point DEER experiment, in order to suppress orientation selection effects.25 There is no significant change in the distance distributions obtained from DEER traces measured with and without field average (field averaged data not shown). We have furthermore checked for triradical T111inv that the emergence and power scaling behaviour of ghost contributions is not strongly biased by matrix changes by conducting DEER measurements in toluene instead of o-terphenyl (data shown in ESI†).
The performance of the power scaling approach for a scalene triradical is illustrated on triradical T012 (Fig. 12). Again, all approaches for suppressing ghost contributions lead to similar changes with respect to the uncorrected distribution. Also in agreement with the other two experimental examples, the largest change is observed with the variable λ approach. Due to the scalene geometry of triradical T012, the ghost contributions are more broadly distributed than in a completely symmetric geometry and the multi-spin effect is mostly a broadening of the lower distance edge. However, the correction appears less significant than for the equilateral triradicals and we may suspect that even with the variable λ approach it is incomplete.
We have observed simulated scalene triradical cases where scaling with ζN actually worsens the distance distribution, but also cases where it improves the distance distribution (data not shown). In any case the fact that power scaling does change the distance distribution reveals that ghost contributions must be present.
Power scaling is a very fast way of checking whether the experimentally obtained distance distribution contains significant amounts of multi-spin contributions and yields very reliable results for symmetric geometries. However, if the result is not clear without ambiguity, especially in the presence of aggregation, unknown or irregular interspin geometry or unknown flexibility of the sample under investigation, we recommend to combine the power scaling approach with the minimum λ approach, a measurement at artificially lowered inversion efficiency, subsequently followed by a check for self-consistency. When the geometry of the sample under investigation is asymmetric and relatively flexible, the distance distributions obtained from the variable λ approach, the minimum λ approach and the power scaling approach might not differ very much from each other and also from the distance distribution obtained from the original form factor at maximum inversion efficiency. In a symmetric and conformationally relatively rigid case however, ghost distance contributions should be very disturbing.
3 Experimental
3.1 Modelling and data analysis
Experimental data were analyzed with DeerAnalysis2011.11 Home-written Matlab (The MathWorks Inc, Natick, MA, USA) routines were used for the simulation of the multiple-spin systems and for all analysis exceeding a simple background fit of the experimental data traces. Tikhonov regularization was performed with adapted subroutines of DeerAnalysis2008.3.2 Sample preparation of the model system
Detailed descriptions of the syntheses of the biradical and the triradical are described in ref. 10 and 26.The samples with total concentrations of ≈100 μmol L−1 were produced by dissolving the pure sample substance in perdeuterated o-terphenyl heated slightly above the melting point. The crystallized samples were powdered and filled into 3 mm tubes. Immediately before introducing the probes into the EPR probehead, the probes were melted again in the hot air stream of a heat gun, shock-frozen in liquid nitrogen and immediately introduced into the EPR probehead precooled to 50 K.
3.3 Pulse EPR
The EPR experiments were performed on a Bruker Elexsys E580 and an Elexsys II pulse EPR spectrometer (Bruker Biospin, Karlsruhe, Germany) at X-band frequencies (≈9.3–9.4 GHz) equipped with an overcoupled Bruker Flexline MS3 split-ring resonator at a temperature of 50 K. For the Elexsys E580 spectrometer, the second microwave frequency was provided by an E8257D PSG Analog Signal Generator (Agilent, Santa Clara, CA) limited to 17 dBm output and fed into one of the pulse forming units of the spectrometer. For the Elexsys II spectrometer, the built-in second frequency source was used.Dipolar time evolution data were obtained using the four pulse double electron–electron resonance (DEER) experiment.27 The experiments were performed with the pump pulse frequency coinciding with the maximum of the nitroxide spectrum. The flip angle β = π of the pump pulse at a pulse length of 12 ns was determined by setting the pump pulse to the spectrometer frequency and optimizing the echo inversion using the pulse sequence (βpump) − T − (π/2) − (τ) − (π) − (τ) − echo. After pump pulse optimization, the frequency of the spectrometer (observer pulses) was increased by 65 MHz and the observer pulses were set. The length of all observer pulses was 32 ns. The first observer pulse was phase cycled [+〈x〉 − 〈−x〉] to cancel the receiver offset.
Lower flip angles β of the pump pulse were obtained by decreasing the pump pulse power at a constant main attenuator setting of 0 dB. The numerical values of the inversion efficiency λ used for fitting the series of DEER traces at variable λ were obtained by inverting eqn (18).
4 Conclusion
Power scaling of the form factor with an exponent ζN = 1/(N − 1) significantly suppresses combinations of dipolar frequencies in systems with N spins (N > 2) that otherwise manifest as ghost peaks in the distance distribution.The approach provides only an approximation to the true pair contribution in the form factor, but is computationally efficient, does not require additional experimental effort and does not depend on a very high signal-to-noise ratio. In contrast, a previously established approach requires the measurement of several DEER traces with very high signal-to-noise ratio.
Furthermore, there is no need to know the exact value of labelling efficiency f or inversion efficiency λ. The approach works best on relatively rigid and symmetric three- and four spin systems for inversion efficiencies up to λ ≈ 0.6 and is also effective for five-spin systems with C5 symmetry, if the inversion efficiency is lowered to λ = 0.4 or less. We would expect that the approach is also useful for even larger numbers of coupled spins, if the inversion efficiency is further lowered.
For symmetric tri- and tetraradicals, analysis of simulated data shows that the approach gives a distance distribution that agrees almost perfectly with the true interspin distance information. For symmetric pentaradicals, this is true for low inversion efficiencies.
These simulation results are broadly confirmed by experimental results for triradicals, although performance on experimental data is slightly worse. However, not in a single case we observed worsening of the distance distribution of symmetric multiple-spin systems by power scaling. The extent of the improvement varies, but some improvement was always observed.
The power scaling approach might be extensible to not only suppress ghost frequency contributions, but to also retrieve them in order to extract further information on the interspin distance geometry.
However, when the symmetry is not high, the corrections are less significant and the approaches may not perform as well. Data obtained on scalene triradicals are in line with these expectations.
Orientation selection and other experimental uncertainties might seriously compromise the determination of the optimum scaling exponent, but do not seriously compromise the performance of the power scaling approach.
But even for these and for cases where complete suppression of higher-order contributions cannot be achieved, power scaling may help to identify the presence of ghost contributions. If the application on a trace with reasonable signal-to-noise data significantly changes the distance distribution, this means that couplings to more than two spins are existing within one nanoobject and that the distance distribution has to be interpreted with care, possibly after remeasuring with lower inversion efficiency.
The approach described in this work is available in the program DeerAnalysis2013, which can be downloaded at www.epr.ethz.ch/software/index.
Acknowledgements
We thank René Tschaggelar for technical support and Dr Maxim Yulikov for valuable comments. Financial support from SNF (20PA21E-131216) is gratefully acknowledged.References
- O. Schiemann and T. F. Prisner, Q. Rev. Biophys., 2007, 40, 1–53 CrossRef CAS.
- Y. D. Tsvetkov, A. D. Milov and A. G. Maryasov, Russ. Chem. Rev., 2008, 77, 515–550 Search PubMed.
- G. Jeschke, Annu. Rev. Phys. Chem., 2012, 63, 419–446 CrossRef CAS.
- J. A. Merten, K. M. Schultz and C. S. Klug, Protein Sci., 2012, 21, 211–218 CrossRef CAS.
- M. J. Junk, H. W. Spiess and D. Hinderberger, J. Magn. Reson., 2011, 210, 210–217 CrossRef CAS.
- P. Braun, B. Nägele, V. Wittmann and M. Drescher, Angew. Chem., Int. Ed., 2011, 50, 8428–8431 CrossRef CAS.
- C. Dockter, A. Mueller, C. Dietz, A. Volkov, Y. Polyhach, G. Jeschke and H. Paulsen, J. Biol. Chem., 2012, 287, 2915–2925 CrossRef CAS.
- B. Endeward, J. A. Butterwick, R. MacKinnon and T. F. Prisner, J. Am. Chem. Soc., 2009, 131, 15246–15250 CrossRef CAS.
- O. Dalmas, H. C. Hyde, R. E. Hulse and E. Perozo, J. Am. Chem. Soc., 2012, 134, 16360–16369 CrossRef CAS.
- G. Jeschke, M. Sajid, M. Schulte and A. Godt, Phys. Chem. Chem. Phys., 2009, 11, 6580–6591 RSC.
- G. Jeschke, V. Chechik, P. Ionita, A. Godt, H. Zimmermann, J. Banham, C. R. Timmel, D. Hilger and H. Jung, Appl. Magn. Reson., 2006, 30, 473–498 CrossRef CAS.
- G. Jeschke and Y. Polyhach, Phys. Chem. Chem. Phys., 2007, 9, 1895–1910 RSC.
- Y. Polyhach, E. Bordignon, R. Tschaggelar, S. Gandra, A. Godt and G. Jeschke, Phys. Chem. Chem. Phys., 2012, 14, 10762–10773 RSC.
- Y. Asada, R. Mutoh, M. Ishiura and H. Mino, J. Magn. Reson., 2011, 213, 200–205 CrossRef CAS.
- P. E. Spindler, Y. Zhang, B. Endeward, N. Gershernzon, T. E. Skinner, S. J. Glaser and T. F. Prisner, J. Magn. Reson., 2012, 218, 49–58 CrossRef CAS.
- A. Doll, S. Pribitzer, R. Tschaggelar and G. Jeschke, J. Magn. Reson, 2013, 230, 27–39 CrossRef.
- S. Domingo-Köhler, M. Spitzbarth, K. Diederichs, T. Exner and M. Drescher, J. Magn. Reson., 2011, 208, 167–170 CrossRef.
- B. E. Bode, D. Margraf, J. Plackmeyer, G. Dürner, T. F. Prisner and O. Schiemann, J. Am. Chem. Soc., 2007, 129, 6736–6745 CrossRef CAS.
- D. Hilger, H. Jung, E. Padan, C. Wegener, K.-P. Vogel, H.-J. Steinhoff and G. Jeschke, Biophys. J., 2005, 89, 1328–1338 CrossRef CAS.
- A. Maryasov and Y. Tsvetkov, Appl. Magn. Reson., 2000, 18, 583–605 CrossRef.
- A. Milov, B. Naumov and Y. Tsvetkov, Appl. Magn. Reson., 2004, 26, 587–599 CrossRef CAS.
- G. Jeschke, M. Sajid, M. Schulte, N. Ramezanian, A. Volkov, H. Zimmermann and A. Godt, J. Am. Chem. Soc., 2010, 132, 10107–10117 CrossRef CAS.
- M. Sajid, G. Jeschke, M. Wiebcke and A. Godt, Chem.–Eur. J., 2009, 15, 12960–12962 CrossRef CAS.
- G. Jeschke, M. Sajid, M. Schulte, N. Ramezanian, A. Volkov, H. Zimmermann and A. Godt, J. Am. Chem. Soc., 2010, 132, 10107–10117 CrossRef CAS.
- B. E. Bode, J. Plackmeyer, T. F. Prisner and O. Schiemann, J. Phys. Chem. A, 2008, 112, 5064–5073 CrossRef CAS.
- A. Godt, C. Franzen, S. Veit, V. Enkelmann, M. Pannier and G. Jeschke, J. Org. Chem., 2000, 65, 7575–7582 CrossRef CAS.
- M. Pannier, S. Veit, A. Godt, G. Jeschke and H. W. Spiess, J. Magn. Reson., 2000, 142, 331–340 CrossRef CAS.
Footnotes |
| † Electronic supplementary information (ESI) available. See DOI: 10.1039/c3cp44462g |
| ‡ Present address: Arbeitsgruppe von Prof. G. Erker, Corrensstr. 40, 48149 Münster, Germany. |
| This journal is © the Owner Societies 2013 |
