Evaluation of molecular crystal structures using Full Interaction Maps
Peter A. Wood*, Tjelvar S. G. Olsson, Jason C. Cole, Simon J. Cottrell, Neil Feeder, Peter T. A. Galek, Colin R. Groom and Elna Pidcock
Cambridge Crystallographic Data Centre, 12 Union Road, Cambridge, UK. E-mail: wood@ccdc.cam.ac.uk; Fax: +44 (0)1223 336033; Tel: +44 (0)1223 336408
First published on 31st August 2012
Abstract
The specific crystalline form of a compound has a significant impact on its solid state properties. A key requirement for chemists developing crystalline materials is therefore to understand and evaluate the crystal form under investigation. We show here how the visualisation of molecular interaction maps within the context of a crystal structure can be used to evaluate the stability of polymorphic structures, assess multiple types of non-covalent interactions and provide a platform for crystal morphology analysis. Examples of three industrially-relevant compounds – sulfathiazole, anastrozole and cipamfylline – illustrate this well. A qualitative agreement with experimental stability data is observed for the five sulfathiazole crystal forms. The anastrozole crystal structure is demonstrated to optimise interactions to the strongest acceptor sites even though there are no conventional hydrogen-bond donors in the structure. Finally, the fastest growing plane of the needle-like morphology of cipamfylline is shown to have more H-bond donor and acceptor interactions per surface area than the slower growing planes.
Introduction
About 90%1 of small molecule drugs are delivered in the crystalline state and crystal structure is also important in the pigment, agrochemical, explosive and fine chemicals industries. It is known that the specific crystal form of a compound has a significant effect on its solid state properties, such as solubility,2 reactivity,3 stability4 and compressibility.5The importance of understanding crystal forms in pharmaceuticals in particular is highlighted by the well known example of ritonavir (Norvir). Abbott Laboratories lost an estimated $250 million in Norvir sales in 1998 alone6 when a new polymorph of the drug was discovered with greatly reduced solubility compared to the original crystal form.2 Determining the physicochemical properties of new chemical entities (NCE) is clearly a key process in drug development. In spite of the importance of crystal forms, computational methods for aiding drug development are considerably less well developed compared to those available for drug discovery.7 In this paper we describe how technology originally designed for drug discovery has been adapted to aid development chemists in the evaluation of crystal forms.
Crystallisation is a process that occurs when a set of molecules comes together to form a condensed array with regular repeating interactions. A fundamental understanding of these interactions is therefore crucial in the analysis, evaluation and prediction of crystal forms. One method for trying to understand molecular interactions is to make use of the contacts observed within experimentally determined crystal structures. The use of this structural knowledge in solid form development is the guiding principle of ‘solid form informatics’. The Cambridge Structural Database (CSD8), the world's repository for small molecule crystal structures, is a valuable resource of structural data in this area.
The value of the CSD is enhanced by the availability of knowledge bases such as IsoStar.9 IsoStar is a library that stores information about intermolecular interactions in the form of scatterplots. Each scatterplot relates to a pair of functional groups – a central group (of which there are over 300) and a contact group (of which there are ∼60). As an example, the molecule omeprazole (CSD refcode VAYXOI;10Fig. 1a) includes 11 different central groups including methyl, pyridyl and sulfoxide (Fig. 1b). Examples of contact groups include uncharged NH (Fig. 1b) and sulfoxide O. The scatterplot is produced by overlaying, in 3D, interacting pairs of functional groups with the central group kept fixed (Fig. 1b and 1c).
 | ||
| Fig. 1 Overview of the IsoStar and Full Interaction Maps (FIMs) methodology; (a) begin with 3D molecular conformation (e.g. omeprazole), (b) split into central groups, (c) generate 3D scatterplots through CSD contact searches with chosen probes, (d) convert scatterplots into scaled density maps, (e) combine into molecular Full Interaction Maps. | ||
IsoStar provides the ability to visualise these 3D scatterplots and also to create density maps from the scatterplots which are scaled relative to the random chance of that contact occurring (Fig. 1d). However, it is focussed on individual functional groups rather than whole molecules.
Here we illustrate how we can go beyond this functional group-based viewpoint to investigate the interaction preferences of whole molecules or arrays of molecules. Using a technique already established for identifying favourable interaction sites in protein pockets,11,12 we calculate Full Interaction Maps (FIMs) derived from IsoStar data for molecules (Fig. 1e) and clusters of molecules. These whole molecule maps pull together the group-based data and take into account the environmental effects of combinative factors and steric exclusion. The visualisation of these molecular interaction maps within the context of a crystal structure can be used to evaluate the stability of polymorphic structures, assess multiple types of non-covalent interactions and provide a platform for crystal morphology analysis.
Methodology
The analysis presented in this study was performed using the program Mercury13 as the structure visualiser. For each structure, interaction maps for carbonyl, uncharged NH and methyl carbon probes were displayed in the context of crystal packing. This set of probes was used as proxies to provide interaction maps indicative of hydrogen bond acceptors (shown in red), donors (blue) and hydrophobic interactions (orange), respectively.The interaction maps were generated using the SuperStar11,12 methodology. The molecules of interest were split into IsoStar9 central groups. Appropriate 3D scatterplots were then superimposed onto the query molecules. Any data points from the 3D scatter plots that clashed with other parts of the query molecules were removed. Density maps, normalised to an external reference, were then generated for the individual 3D scatterplots. Overlapping maps from the same probe were combined by multiplication before displaying the final interaction maps. As the maps in this study were applied to a small molecule crystalline environment, rather than a protein binding site, no corrections for dealing with protein hydration effects were used.11
Unlike other computational methods used to investigate interactions in the solid state, these knowledge-based interaction maps take only a matter of seconds to compute for an organic molecule. Once computed, the interaction maps can be displayed in Mercury.13 Different contour surfaces are used to indicate how much more likely an interaction is at a certain grid-point with respect to random chance. Opacity levels are used to visualise all the contour surfaces at once, with the highest contour levels being the most opaque.
Structural figures in this work were generated using the combination of an in-house development version of Mercury CSD13 and POV-Ray.14
Results and discussion
General comparison of maps
Before looking at these maps in the context of molecular crystal structures, it is useful to start with a comparison of isolated molecules. Fig. 2 shows examples of three series of related molecules and their associated interaction maps – halogenated benzoic acids (a–d), methylated heterocycles (e–g) and hydrogen-bonding toluene derivatives (h–j).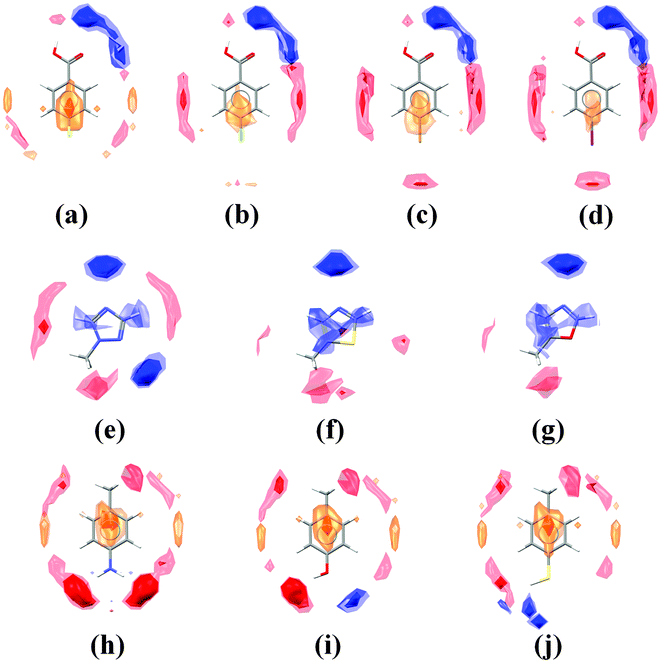 | ||
| Fig. 2 Interaction maps shown for selected isolated molecules: fluoro- (a), chloro- (b), bromo- (c) and iodo-benzoic acid (d); methyl-triazole (e), methyl-thiazole (f) and methyl-oxazole (g); amino- (h), hydroxy- (i) and sulfhydryl-toluene (j). Regions of acceptor likelihood are shown in red, donors in blue and hydrophobic groups in orange. | ||
Studying the halogenated benzoic acids first (Fig. 2a–d), the interaction maps around the carboxylic acid group are consistent across the series. The region around the halogen, however, varies depending on the element. Acceptor peaks along the direction of the C–Halogen bond axis for the bromo and iodo derivatives indicate the propensity of these molecules to form halogen bonds.15 In contrast, the chloro and fluoro derivatives show little or no acceptor propensity opposite the halogen, correlating with the known behaviour of organic chlorine and fluorine.16 The hydrophobic propensity region above and below the phenyl rings, however, shows an increase for the fluoro derivative, highlighting the preference of fluoroarenes to stack with hydrocarbons.17
Investigation of the interaction maps for the methylated heterocycles (Fig. 2e–g) shows that the conserved nitrogen acceptor has a consistent strength and geometrical preference across the series. The second heteroatom, however, varies in acceptor strength a great deal across these compounds. The maps for the triazole (Fig. 2e) indicate that both nitrogen acceptors are similarly strong acceptors, but the sulfur in thiazole (Fig. 2f) and the oxygen in the oxazole (Fig. 2g) show no significant accepting ability at all. In contrast, we do see small regions of acceptor propensity for thiazole along the axes of the C–S bonds indicating the potential for weak σ-hole interactions.18
Finally, we can study the maps for the toluene derivatives (Fig. 2h–j). Here the interaction maps around the phenyl group are essentially unchanged, but there is significant variation around the H-bonding group. The maps for the amine and hydroxy derivatives (Fig. 2h and 2i) show very similar acceptor peaks, indicating that the donors are of similar strength. The smaller donor peak for the hydroxy compound (Fig. 2i) suggests that this is a weaker acceptor than it is a donor. The thiol (Fig. 2j) is observed to be a weak donor with negligible acceptor strength.
The maps shown here for related compounds illustrate how one can get an impression of the interaction preferences for an isolated molecule. Next we turn to analysing and comparing maps within the context of crystal structures to address solid form problems of academic and industrial relevance.
Example 1: investigating polymorphs (sulfathiazole)
The compound sulfathiazole (Scheme 1) was used as an oral and topical antimicrobial drug until less toxic alternatives were found. The first crystal structure of sulfathiazole was published in 197119 and there are now 5 published polymorphs of sulfathiazole. We have chosen representative structures of each polymorph determined at the same temperature (150 K) for analysis. The consistent numbering scheme for polymorphs presented by Gelbrich & co-workers20 is used here. Note that the number of molecules per asymmetric unit (Z') in these structures is either 2 or 1 depending on the polymorph.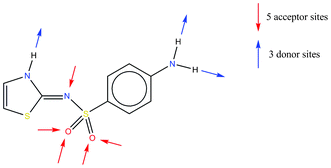 | ||
| Scheme 1 Chemical diagram of sulfathiazole. | ||
Sulfathiazole contains three conventional hydrogen bond donating atoms and five potential acceptor sites (or lone pairs) as well as two planar aromatic rings; this means that a wide range of intermolecular interactions are possible. Calculation of interaction preference maps for the compound, as described above, gives us an overview of the relative strengths of the functional groups. Fig. 3 shows the interaction maps for sulfathiazole calculated using the crystal structure of polymorph V (CSD refcode SUTHAZ1920).
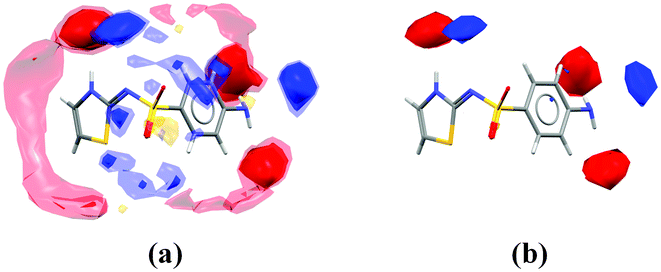 | ||
| Fig. 3 Interaction maps shown around the molecular conformation of sulfathiazole in polymorph V with; (a) contour levels 2, 4 and 6 shown using increasing levels of opacity, (b) only contour level 6 shown. | ||
It is clear from Fig. 3b that there are five very well defined hotspots (the large, opaque red and blue regions) as well as some more diffuse interaction regions (more transparent red, blue and yellow regions in Fig. 3a). This display of the contoured maps indicates that there are five interactions with a high density and a clearly preferred geometry. The remaining contacts are shown to have lower propensities and less specific geometries, such as the interactions to the sulfonyl acceptors. We can use the calculated interaction maps to evaluate how well the experimental structures satisfy the preferred interactions.
Visual analysis of the interaction maps for each structure shows that in some cases one or more of the most preferred interactions are not satisfied by contacts from neighbouring molecules. Forms III, IV and V all show a conventional donor or acceptor near to the centre of the strongest interaction map peaks, though the quality of fit varies between the polymorphs. This can be seen for form V in Fig. 4a where each of the strongest interaction map peaks have a matching donor or acceptor atom within their contours.
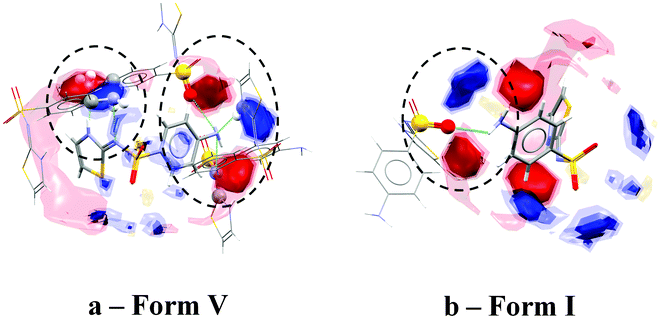 | ||
| Fig. 4 Interaction maps shown within packing patterns in the crystal structures of forms V (a) and I (b). | ||
Forms I and II both exhibit at least one strong interaction map peak (corresponding to a strong donor or acceptor) that does not have a corresponding donor or acceptor nearby. Form I (CSD refcode SUTHAZ1620) for example shows no donor interacting with one of the primary amino groups, as well as a hydrogen bond with poor geometry (D–H⋯A angle of 131°).21 This results in an acceptor outside the closest interaction map peak as seen in Fig. 4b. An unsatisfied donor or acceptor can be a sign of metastability – this suggests that forms I and II are likely to be less stable than forms III, IV and V.
These results agree with the experimental stability data published in the literature; the thermodynamically most stable polymorph of sulfathiazole is believed to be form V.22 Form I has been shown to be the most unstable, whereas III and IV were found to be roughly similar in terms of stability. Form II is also believed to be rather unstable having only been obtained from the evaporation to dryness of a boiling aqueous solution.23
The visualisation and analysis described here provides an overview of how well interaction preferences are satisfied in the context of crystal structures. It is possible that these maps also provide more subtle information about the quality of each individual observed interaction.
Example 2: analysis of multiple interaction types (anastrozole)
Anastrozole is a non-steroidal aromatase inhibitor used in the treatment of breast cancer.24 The only published crystal structure of anastrozole is that of the pure form (CSD refcode SATHOL25). As can be seen from Scheme 2, there are no conventional hydrogen bond donating groups in the molecule but a number of available acceptor groups. Display of interaction maps (with all three standard probe types) provides an overview of the preferred directionality and the strength of the potential interactions that can be formed by the functional groups in the molecule (Fig. 5).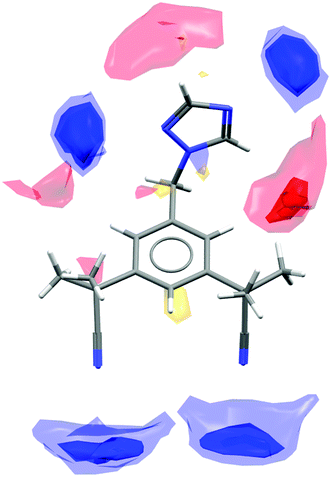 | ||
| Fig. 5 Interaction preferences shown for the molecular conformation of anastrozole in the pure crystal structure (CSD refcode SATHOL). | ||
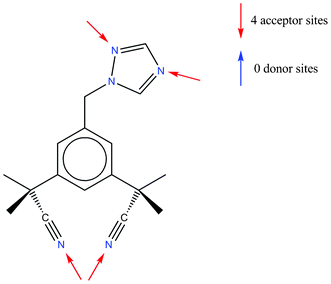 | ||
| Scheme 2 Chemical diagram of anastrozole. | ||
The blue hotspots (relating to the donor probe) indicate a higher propensity for interactions to the nitrogen acceptors on the triazole ring than with the two cyano acceptor groups. The red hotspots (relating to the acceptor probe maps) indicate that although there are no conventional hydrogen bond donor groups, there are some weakly activated C–H donors, namely the two triazole hydrogen atoms and, potentially, the phenyl hydrogen atoms. Looking more closely at specific regions of the structure we can see how well the observed contacts satisfy the interaction preferences. Fig. 6 shows close-ups of the crystal structure around three of the functional groups in the molecule.
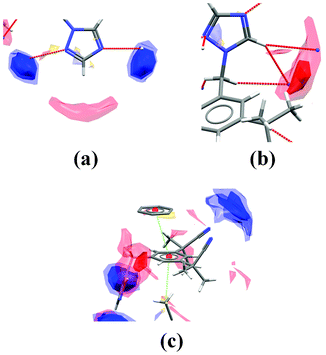 | ||
| Fig. 6 Images of the packing and interaction preferences in three sections of the anastrozole crystal structure. | ||
Interactions from C–H donors are observed to satisfy the interaction preferences of the two acceptors on the triazole ring (Fig. 6a). In contrast, the cyano acceptors are not observed to have close contacts to the centre of their interaction preference maps at all (not shown). From the acceptor probe maps (red hotspots) we can see that the main region of acceptor preference is satisfied by the two triazole acceptors (Fig. 6b), but the weaker C–H donor atom shown in Fig. 5a does not interact with a conventional acceptor. In addition there is a C–H⋯π contact and a π⋯π stack observed in the structure which fit the hydrophobic preference map regions and may be stabilising (Fig. 6c).
In general the anastrozole crystal structure seems to have optimal interactions involving the strongest acceptors (triazole nitrogens) to the detriment of other, weaker acceptor groups (cyano nitrogens). Unsatisfied hydrogen bond acceptor groups remain, suggesting that there could be scope to design a co-crystal of anastrozole by including a hydrogen bond donating co-former.
Example 3: studying crystal surface properties (cipamfylline)
Cipamfylline (Scheme 3) is a non-steroidal anti-inflammatory drug that has been trialled for use in the treatment of atopic dermatitis.26 It is known to have at least three polymorphs.27 Theoretical and experimental analyses by Catlow and co-workers28 have shown that the morphologies of two of these polymorphs (forms A and C) are needle-like. The occurrence of such needle-like morphologies in an industrial development scenario is often problematic due to the effects the crystal habit has on processing steps such as filtering, powder flow and tabletting.29 An understanding of morphology and methods for habit modification can be of critical importance.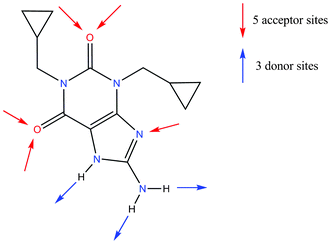 | ||
| Scheme 3 Chemical diagram of cipamfylline. | ||
We can apply the Full Interaction Map methodology to this problem by calculating maps for molecular surfaces† – in particular we can analyse surfaces that are important in relation to the crystal habit. Fig. 7 shows a Bravais–Freidel–Donnay–Harker (BFDH)30 prediction of the crystal morphology of form A generated using Mercury.13 The predicted habit is needle-like (Fig. 7, left) and correlates well with the observed morphology.28 In order to understand the interaction patterns of the surfaces in the context of the crystal habit we can visualise the interaction maps around a simulated crystalline particle (Fig. 7, right).
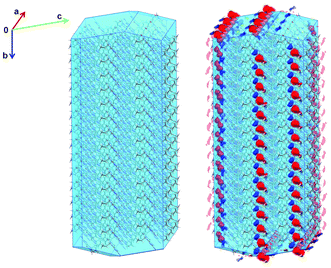 | ||
| Fig. 7 Predicted (BFDH) morphology of the cipamfylline form A crystal structure filled with molecules (left) alongside the same view with interaction maps shown (right). | ||
Fig. 8a and 8b show the (001) surface from cipamfylline form A (CSD refcode MOVYEC27), which is perpendicular to the fast-growing needle direction. In Fig. 8b we see the interaction maps for this surface overlaid on the (001) hkl plane showing the preferred locations for donors and acceptors relative to this surface. Along this direction there are both stacking contacts and hydrogen-bonding interactions which undoubtedly contribute to the fast growth rate.
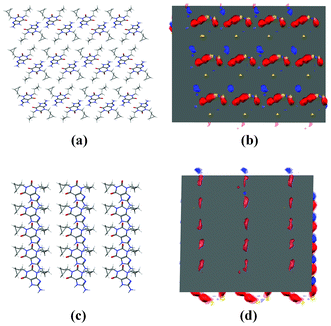 | ||
| Fig. 8 Surfaces in cipamfylline form A; packing diagram of the (001) surface (a), interaction maps for the (001) surface (b), packing diagram of the (010) surface (c), and interaction maps for the (010) surface (d). | ||
In contrast, Fig. 8c and 8d show the surface along with interaction maps for the (010) plane, which is perpendicular to the slowest-growing direction according to the BFDH morphology. Here we can see (Fig. 8d) that the (010) surface does not show strong interaction preferences for any of the probe types used, suggesting why this might be the slowest-growing face of the crystal.
This method of analysis provides a new way of visualising the recognition pattern of a surface that is important in crystal growth. Furthermore, potential inhibitors for the fast-growing (001) surface could be found by matching molecules with the correct donor, acceptor and hydrophobic geometries to these interaction preferences.
Conclusions
Using Full Interaction Maps one can rapidly visualise the interaction preferences of a molecule in a particular conformation. When studied in the context of the 3D crystal packing, they allow qualitative analysis of how well interaction preferences are satisfied within the lattice. The technique may be useful for evaluating and understanding relative structural stability.The methodology presented here can be used to analyse particular surfaces from a crystal structure in order to gain insight into crystal morphology. Full Interaction Maps offer an overview of the preferred interaction behaviour of a surface, and also have the potential to provide a starting point for the investigation of surface inhibition.
There is clear scope for improving this technology including using the interaction maps directly to quantitatively assess how well interactions satisfy the calculated interaction maps. Extending the available probe types could also improve the applicability of the data displayed to the interactions observed in the structures. Finally, the ability to use hotspots as the subject of pattern-based, or chemophore, searches may open up a range of possibilities from finding habit modifiers to identifying likely guests for a given host framework in a manner similar to pharmacophore searches.
Acknowledgements
Some of the analyses and concepts presented here were further developed through or inspired by the CCDC's Crystal Form Consortium (http://cfc.ccdc.cam.ac.uk); we would like to acknowledge the scientific input of the representatives of these pharmaceutical and agrochemical companies. John Liebeschuetz (CCDC) is also thanked for critical review of this manuscript. The functionality introduced in this paper will be included as part of Mercury CSD in a future release.References
- N. Variankaval, A. S. Cote and M. F. Doherty, AIChE J., 2008, 54, 1682–1688 CrossRef CAS.
- J. Bauer, S. Spanton, R. Henry, J. Quick, W. Dziki, W. Porter and J. Morris, Pharm. Res., 2001, 18, 859–866 CrossRef CAS.
- X. Chen, K. R. Morris, U. J. Griesser, S. R. Byrn and J. G. Stowell, J. Am. Chem. Soc., 2002, 124, 15012–15019 CrossRef CAS.
- L. Yu, G. A. Stephenson, C. A. Mitchell, C. A. Bunnell, S. V. Snorek, J. J. Bowyer, T. B. Borchardt, J. G. Stowell and S. R. Byrn, J. Am. Chem. Soc., 2000, 122, 585–591 CrossRef CAS.
- C. Sun and D. J. W. Grant, Pharm. Res., 2001, 18, 274–280 CrossRef CAS.
- S. L. Morissette, S. Soukasene, D. Levinson, M. J. Cima and Ö. Almarsson, Proc. Natl. Acad. Sci. U. S. A., 2003, 100, 2180–2184 CrossRef CAS.
- W. L. Jorgensen, Science, 2004, 303, 1813–1818 CrossRef CAS.
- F. H. Allen, Acta Crystallogr., Sect. B: Struct. Sci., 2002, 58, 380–388 CrossRef.
- I. J. Bruno, J. C. Cole, J. P. M. Lommerse, R. S. Rowland, R. Taylor and M. L. Verdonk, J. Comput.-Aided Mol. Des., 1997, 11, 525–537 CrossRef CAS.
- H. Ohishi, Y. In, T. Ishida and M. Inoue, Acta Crystallogr., Sect. C: Cryst. Struct. Commun., 1989, 45, 1921–1923 CrossRef.
- M. L. Verdonk, J. C. Cole and R. Taylor, J. Mol. Biol., 1999, 289, 1093–1108 CrossRef CAS.
- M. L. Verdonk, J. C. Cole, P. Watson, V. Gillet and P. Willett, J. Mol. Biol., 2001, 307, 841–859 CrossRef CAS.
- C. F. Macrae, I. J. Bruno, J. A. Chisholm, P. R. Edgington, P. McCabe, E. Pidcock, L. Rodriguez-Monge, R. Taylor, J. van de Streek and P. A. Wood, J. Appl. Crystallogr., 2008, 41, 466–470 CrossRef CAS.
- POV-Ray, POV-Ray: the persistence of vision raytracer, ( 2009). http://www.povray.org/ Search PubMed.
- P. Metrangolo, H. Neukirch, T. Pilati and G. Resnati, Acc. Chem. Res., 2005, 38, 386–395 CrossRef CAS.
- G. M. Espallargas, F. Zordan, L. A. Marin, H. Adams, K. Shankland, J. Van de Streek and L. Brammer, Chem.–Eur. J., 2009, 15, 7554–7568 CrossRef.
- S. Bacchi, M. Benaglia, F. Cozzi, F. Demartin, G. Filippini and A. Gavezzotti, Chem.–Eur. J., 2006, 12, 3538–3546 CrossRef CAS.
- A. Mohajeri, A. H. Pakiari and N. Bagheri, Chem. Phys. Lett., 2009, 467, 393–397 CrossRef CAS.
- G. J. Kruger and G. Gafner, Acta Crystallogr., Sect. B: Struct. Crystallogr. Cryst. Chem., 1971, 27, 326–333 CrossRef.
- T. Gelbrich, D. S. Hughes, M. B. Hursthouse and T. L. Threlfall, CrystEngComm, 2008, 10, 1328–1334 RSC.
- P. A. Wood, F. H. Allen and E. Pidcock, CrystEngComm, 2009, 11, 1563–1571 RSC.
- N. Blagden, R. J. Davey, R. Rowe and R. Roberts, Int. J. Pharm., 1998, 172, 169–177 CrossRef CAS.
- D. S. Hughes, M. B. Hursthouse, T. L. Threlfall and S. Tavener, Acta Crystallogr., Sect. C: Cryst. Struct. Commun., 1999, 55, 1831–1833 Search PubMed.
- A. Howell, J. Cuzick, M. Baum, A. Buzdar, M. Dowsett, J. F. Forbes, G. Hoctin-Boes, J. Houghton, G. Y. Locker, J. S. Tobias and A. T. Group, Lancet, 2005, 365, 60–62 CrossRef CAS.
- G.-P. Tang and J.-M. Gu, Acta Crystallogr., Sect. E: Struct. Rep. Online, 2005, 61, o2330–o2331 Search PubMed.
- C. E. M. Griffiths, E. J. M. Van Leent, M. Gilbert and J. Traulsen, Br. J. Dermatol., 2002, 147, 299–307 CrossRef CAS.
- D. S. Eggleston and I. R. Lynch, US Pat., 6583283, 2003 Search PubMed.
- D. S. Coombes, C. R. A. Catlow, J. D. Gale, M. J. Hardy and M. R. Saunders, J. Pharm. Sci., 2002, 91, 1652–1658 CrossRef CAS.
- H. A. Garekani, F. Sadeghi, A. Badiee, S. A. Mostafa and A. R. Rajabi-Siahboomi, Drug Dev. Ind. Pharm., 2001, 27, 803–809 CrossRef CAS.
- (a) A. Bravais, Etudes Crystallographiques, Gauthier-Villars, Paris, 1866 Search PubMed; (b) G. Friedel, Bull. Soc. Fr. Mineral., 1907, 30, 326 Search PubMed; (c) J. D. H. Donnay and D. Harker, Am. Mineral., 1937, 22, 446–467 CAS.
Footnote |
| † Note that for the purposes of interaction map generation we added hydrogen atoms to the cipamfylline molecules in calculated positions at standard neutron X–H distances (using Mercury) and suppressed two carbon atoms in a minor disorder component. |
| This journal is © The Royal Society of Chemistry 2013 |
