Iron oxide nanoparticle-based radio-frequency thermotherapy for human breast adenocarcinoma cancer cells
Thikra
Mustafa
a,
Yongbin
Zhang
b,
Fumiya
Watanabe
a,
Alokita
Karmakar
a,
Madhu P.
Asar
a,
Reginald
Little
c,
M. Keith
Hudson
d,
Yang
Xu
*a and
Alexandru S.
Biris
*a
aCenter for Integrative Nanotechnology Sciences, University of Arkansas at Little Rock, 2801 S. University Ave, AR 72204, USA. E-mail: yxxu@ualr.edu; asbiris@ualr.edu; Fax: +1-501-683-7601; Tel: +1-501-682-5166 Tel: +1-501-683-7458
bNanotechnology Core Facility, Office of Scientific Coordination, National Center for Toxicological Research, US Food and Drug Administration, 3900 NCTR Road, Jefferson, AR 72079, USA
cDepartment of Biological and Physical Science, South Carolina State University, Orangeburg, SC 29117, USA
dDepartment of Applied Science, University of Arkansas at Little Rock, 2801 S. University Ave, AR 72204, USA
First published on 23rd May 2013
Abstract
Iron oxide nanoparticles (IONPs) with diameters of 15, 25, and 41 nm were evaluated as mediators of thermal cytotoxicity under radio-frequency (RF) exposure. The 25 nm IONPs were found to be the most efficient of the three in killing cancer cells at 350 kHz low-frequency RF irradiation. However, at a higher frequency of 13.56 MHz, 15 nm IONPs produced the highest percentage of cell death. Moreover, the killing effect was concentration-dependent in that a higher concentration of IONPs resulted in increased cellular death. Size-dependent internalization of IONPs in MCF-7 cells was quantified by using inductively coupled-plasma mass spectrometry (ICP-MS). Dark-field microscopy and transmission electron microscopy (TEM) revealed that MCF-7 cells internalize IONPs through endocytosis after 24 hours of incubation. In addition, after RF treatment, the cancer cells underwent the apoptosis process, and the level of reactive oxygen species (ROS) increased significantly after hyperthermia. Scanning electron microscopy (SEM) and TEM further established that the ultrastructure morphological changes in the cancer cells originated from the apoptosis process.
1. Introduction
Hyperthermia is a promising technique for cancer treatment because of tumor cells’ sensitivity to heat1 owing to the narrow tolerance ranges of cancer cells to micro-environmental parameters, including low pH range, low oxygen levels, and nutrient deprivation.2 Basically, in the treatment of cancer by hyperthermia, the tissue's temperature is increased to approximately 40–43 °C, which is considered to be detrimental for tumor cells3 compared to normal tissue.4 The primary mechanism of cell death is the irreversible denaturation of proteins when the temperature increases above 40 °C.5 Since proteins are composed of globular or fibrous-form compounds and many are involved in the fundamental structures of cells, the denaturation of proteins leads to alterations in vital cell structures, such as the cytoskeleton, plasma membrane, or enzyme activity.4 Magnetic nanoparticles—with their ability to efficiently convert electromagnetic energy into heat at RF frequencies and their small sizes (which enable them to be taken up by the cell)—are attractive for a variety of nanomedicine-related applications,6 such as drug delivery,7 cancer cell detection,8 MRI contrast agents,9 and hyperthermia.10In 1957, Gilchrist et al. were the first to report the efficiency of IONPs in elevating the temperature of human cancerous tissues in vitro under RF exposure.11 Subsequent in vitro work has shown that IONPs greatly enhance thermal cytotoxicity in cancer cells.12 Nonetheless, the optimal conditions for thermalization of RF energy by IONPs are still under investigation. Among the variables, the size and concentration of magnetic nanoparticles are among the most important parameters that have been studied.13–16 However, these critical parameters should be optimized for medical applications in order to achieve the most efficient thermal transfer and, in turn, the highest efficiency for cancer cell death. Thus far, there have been few reports concerning the relationship between radio frequency and the size of the IONPs for RF-heating efficiency.
In this study, we used human breast adenocarcinoma cancer cells (MCF-7) as a model to study the nanoparticle size-dependence of hyperthermia using two different frequencies of RF. Different sizes of IONPs showed varying abilities to destroy cancer cells under different frequencies of RF thermal activation. We found that ROS release levels increased after RF treatment, which finally induced cellular apoptosis. The research described here will provide key insights into how the size of IONPs influences their RF thermal energy delivery at various frequencies, which will lead to the future development of magnetic nanoparticle synthesis and functionalization for cancer research using certain controlled methods.
2. Experimental section
2.1 TEM characterization of iron oxide nanoparticles
Water soluble carboxylic iron oxide nanoparticles of three sizes (15, 25, and 40 nm) were used in this study. They were obtained from Ocean NanoTech (Springdale, AR, USA). The size and shape of the particles were confirmed by using a transmission electron microscope (TEM), JEM-2100F (JEOL USA, Peabody, MA, USA) with an accelerating voltage of 80 kV. TEM grids were prepared by depositing a few drops of an IONP solution onto holey-carbon coated copper grids, which were then allowed to dry for 15 minutes on filter paper. In addition, the average particle size and particle size distribution of each sample were determined by EMAN1 and Image J software. The equivalent circular diameter of each particle was calculated using the following equation: . The longest diameter of an ellipse is considered the “major”, and the “minor” is the shortest.17 The mean and standard deviation of the particles’ diameters were obtained after measuring over 200 particles in random fields of view for each set of particles.
2.2 Hydrodynamic size and zeta potential measurement
Dynamic light scattering (DLS) was performed for the characterization of the hydrodynamic size of the IONPs in aqueous solution using a Zetasizer Nano-ZS instrument (Malvern Instruments, Malvern, Worcestershire, UK). Samples were measured after dilution of the iron-nanoparticles stock solution to 50 μg ml−1 suspensions in DI water. The dilution was briefly vortexed and sonicated for 5 min in an ultrasonic water bath to provide a homogenous dispersion. Then 1 ml of the dilute was transferred to a 1 cm2 cuvette for dynamic size measurement. The concentration of the samples and experimental methods were optimized to assure the quality of the data. Ten, thirty, and sixty nm standard gold nanoparticles from the National Institute of Standards and Technology (NIST) were used in the validation of the instrument. The size was measured at least three times for each nanoparticle sample. The data were calculated as the average size of IONPs (mean ± SD, N = 3). The zeta potentials of different sized IONPs were measured by using a Zeta-Reader MARK 21 (ZETA POTENTIAL Instrument, Inc., NJ, USA).2.3 X-Ray diffraction (XRD) analysis
The X-ray diffraction profiles of the different sizes of IONPs were recorded on a Bruker AXS D8 Discover advanced diffractometer with a 2D General Area Detector Diffraction System (GADDS). The monochromatic Cu Kα radiation line (wavelength = 0.154 nm) with a Goebel mirror (parallel beam divergence of less than 0.03°) were used as an excitation source.2.4 MCF-7 cell culture
MCF-7, a breast cancer cell line, was obtained from the American Type Culture Collection (ATCC) (Manassas, VA, USA). Dulbecco's modified Eagle medium (DMEM) supplemented with 10% fetal bovine serum (FBS), 1% penicillin (500 units ml−1), and streptomycin (500 units ml−1) were used to nourish MCF-7 cells. Cells were cultured in 75 cm2 cell culture flasks and maintained under aseptic conditions at 37 °C in a 5% CO2 atmosphere until 80% cell confluence was obtained. The cells were then harvested and counted using a hemacytometer (Fisher Scientific, Pittsburgh, PA, USA).2.5 Cytotoxicity assays
2.6 Hyperthermia treatment conditions
Cells were seeded in 35 mm tissue culture dishes at a density of 200 × 103 cells per dish. The cells were allowed to attach on the plate for 24 hours. Two concentrations of 20 and 50 μg ml−1 of IONPs were added, and the nanoparticles were allowed to interact with cells for another 24 hours. The treated MCF-7 cells, as well as MCF-7 cells that had not been exposed to IONPs, were placed in the center of the horizontal coil and subjected to a magnetic field using a low-frequency RF generator (350 kHz, Cycle-Dyne MK-20, Pillar) for 20 min, individually. The parallel sets of dishes containing identical amounts of IONPs along with unexposed dishes that had not been subjected to RF treatment were regarded as the negative control. The RF exposure experiments were repeated using a modified high-frequency generator at 13.56 MHz. An Alinco model DX70TH transmitter (Alinco, Inc., Osaka, Japan) was used as an RF exciter source followed by amplification using a YAESU model FL-7000 linear amplifier (YAESU, Cypress, CA, USA). Various power levels were tried; however, all the experiments reported here were performed at a level of 70 watts. It should be noted that the use of the exciter, alone, above the 10 watt level, was rejected since power levels dropped off over time, probably due to heat levels in the final stages of the unit. Results obtained using the 600 watt capacity amplifier were much more stable, and therefore the combination of the exciter and the amplifier was used to gather all the reported data. Here, only one concentration of IONPs, 50 μg ml−1, was used at this higher frequency to compare with the results of the lower frequency RF treatment.Calorimetric measurements of the IONPs were performed using both low-frequency and high-frequency RF generators. 2 mg ml−1 each of 15 nm, 25 nm, and 41 nm IONP solutions were placed in an insulated tube for temperature measurement. The temperature was measured by a FLIR SC660 IR camera (FLIR Systems, Inc., MA, USA). The duration of each measurement was 10 min, and data were collected every minute. The specific loss of power was calculated from the following formula: SLP (W g−1) = c (ms/mFe) (dT/dt)18 where c is the heat capacity of water, ms is the mass of the sample, mFe is the mass of IONPs in the sample, and dT/dt is the slope of the heating curve. We used the initial slope of the T(t)-curve for the calculation to avoid possible errors caused by heat from the ferrofluid being conducted to the sample. The dT/dt was calculated as the initial one-minute rising rate for the IONPs solution in our experiment.
2.7 Flow cytometry analysis
An annexin V-FITC apoptosis detection kit (BioVision, Milpitas, CA, USA) was used to quantify cell viability. The analysis method followed the protocol provided with the kit. 48 hours post RF treatment, exposed cells along with negative control cells were harvested, and approximately 1–5 × 10⁵ cells were collected. The collected cells were re-suspended in 500 μl of binding buffer, and 5 μl each of annexin V-FITC and propidium iodide (PI) were added to each sample. The samples were incubated in the dark for 5 minutes before analyzing them using a FACSCalibur instrument.2.8 Dark-field microscopy examination
25 nm (50 μg ml−1) IONPs were incubated with MCF-7 cells on collagen-coated coverslips lying in a 6-well plate for 12 hours. The medium was removed, and the MCF-7 cells were rinsed three times with sterile phosphate-buffered saline (PBS). The coverslips containing cells were sealed on the glass slide using nail polish. Images were captured using a enhanced dark-field illumination microscope (Cytoviva, Auburn, AL, USA).2.9 Scanning electron microscopy (SEM) analysis for cell morphology changes
MCF-7 cells were grown on a polycarbonate membrane Nunc CC Insert (EMS, Hatfield, PA, USA), treated with 50 μg ml−1 of 25 nm IONPs for 24 hours, and exposed to RF for 20 minutes. Two days after RF exposure, the cells were fixed primarily with 3% glutaraldehyde in 0.1 M phosphate buffer, pH 7.2, followed by a secondary fixative of 2% OsO4 in 0.1 M phosphate buffer. All of the samples were washed thoroughly with 0.1 M phosphate buffer, dehydrated with ascending percentages of ethanol solution, and then dried using a critical point dryer (Samdri®-PVT-3D, Rockville, MD, USA). Each dried sample was coated with a thin film of gold (∼3 nm) and visualized under a SEM JEOL JSM-7000F (JEOL, Peabody, MA, USA) with an accelerating voltage of 15 kV and a working distance of ∼10 mm.192.10 Transmission electron microscopy (TEM) analysis of cells
Samples that had been exposed to 25 nm IONPs at a concentration of 50 μg ml−1 and then exposed to RF treatment for 20 min were processed for TEM analysis. A control sample was also processed. Samples were fixed with 3% glutaraldehyde fixative in 0.1 M of phosphate buffer, pH 7.2, overnight at 4 °C. After fixation, all samples were intensively rinsed with 0.1 M phosphate buffer (pH 7.2), post-fixed with 2% OsO4 in 0.1 M phosphate buffer for 2 h, rinsed in distilled water, and finally dehydrated in an ethanol solution. The resulting dried specimens were embedded in Epoxy Resin which was polymerized at 70 °C overnight. Semi-thin sections with thicknesses of 0.5–1.0 μm, along with thin sections with thicknesses of 60–100 nm, were sliced for light microscopy and transmission electron microscopy analysis, respectively, using an ultramicotome, EM UC7 (Leica microsystem GmbH, Wetzlar, Germany). Thin sections were mounted on 150 mesh formvar-carbon coated copper grids and stained with heavy metals, i.e., uranyl acetate and lead citrate. Stained samples were coated with a thin layer of carbon and visualized under a TEM JEOL JEM-2100F (JEOL, Peabody, MA, USA) with an accelerating voltage of 80 kV.2.11 Quantitation of the uptake of the IONPs using ICP-MS
MCF-7 cells were cultured at the density of 1 × 10⁵ cells ml−1 and incubated with three sizes of nanoparticles (100 μg of Fe per well) for 24 hours, respectively. The cells were harvested and stored at −20 °C after extensively washing with PBS to remove the free nanoparticles in the media and cell membrane. The cells were thawed at room temperature and reconstituted in 1 ml of endotoxin-free 18 MΩ H2O. 200 μl of the samples were hydrolyzed in 3 ml of optima-grade concentrated nitric acid (HNO3) and digested using a CEM MARS-Xpress system operating at 100% power and 180 °C for 15 minute. Following digestion, samples were diluted to 5 ml with reagent water. Analysis was performed using an Agilent 7700-x Inductively Coupled-Plasma Mass Spectrometer (ICP-MS). Data were collected for the most abundant isotope 56Fe used in quantitation. Germanium (Ge) was used as an internal standard to correct for instrument response and sample preparation errors. The instrument was calibrated for iron (0–1000 ppb) using a NIST traceable standard.2.12 Reactive oxygen species (ROS) measurement
The intracellular ROS experiment was performed in accordance with our previous report.20 Briefly, MCF-7 cells (2 × 10⁵) were cultured on the chamber slides (Lab-Tek, NY, USA) until sub-confluent. Before the intracellular RF cell exposure, carboxy,-2′,7′-dichlorofluorescein diacetate (H2DCFDA) (Cell Biolabs, Inc., San Diego, CA, USA) was added and kept for 30 min. Samples were then washed 3 times with PBS, loaded with 50 μg ml−1 of 25 nm IONPs, and re-incubated for 24 hours. Cells incubated with IONP-free medium were used as a negative control. Loaded and unloaded samples were exposed to RF for 20 min and kept for 24 hours inside the incubator. Before the intracellular ROS fluorescent measurement, the cells were washed with PBS and then loaded with 20 μM of H2DCFDA for 30 minutes at 37 °C. The cells were washed with PBS before being observed under a fluorescent microscope, Olympus, BX51 (Tokyo, Japan) with a green filter, and the images were captured with a digital camera, Olympus, DP-71 (Tokyo, Japan). 100 μM H2O2 was used as the positive control. Throughout the experiment, the plate was kept in the dark to prevent the dye from being quenched.2.13 Temperature measurement of chicken tissue by the injection of IONPs under RF treatment
5 mg ml−1 of the 25 nm IONPs solution was injected into a sample of raw chicken tissue as shown in Fig. 8. Chicken samples were inserted into the center of the RF coil. The temperature was measured by a FLIR SC660 IR camera (FLIR Systems, Inc., MA, USA). The images were taken before and after RF heating. The temperature changes for a control of raw chicken tissue without nanoparticles were also measured during the RF treatment. All measurements taken included 6 minutes of RF heating followed by 4 minutes of cooling.3. Results and discussion
3.1 Characterization of the IONPs’ sizes and shapes
The TEM images of the carboxylic group IONPs show that the particles were mono-dispersed and that most of them had a spherical shape. As can be seen in Fig. 1, none of the samples showed agglomerations. The average diameters and the standard deviations of 15, 25, and 40 nm IONPs were 14.7 ± 0.8 nm, 24.8 ± 2 nm, and 41.3 ± 5.5 nm, respectively, as shown in Table 1. As a result, we labeled them as 15 nm, 25 nm and 41 nm. The size distribution graphs showed that both the particles of 15 nm and 25 nm had overall narrow particle size distributions with a spherical shape. However, the 41 nm IONPs revealed a wider size distribution, and some of them had a non-spherical shape. The deviation percentage from the average diameter value was 13.3% for the 41 nm sample, while the deviation percentage was 5.4% and 8% for the 15 nm and 25 nm IONPs, respectively. Furthermore, as reported in the literature, spherical particles of similar size have been shown to uptake into cells more readily than other shaped particles.21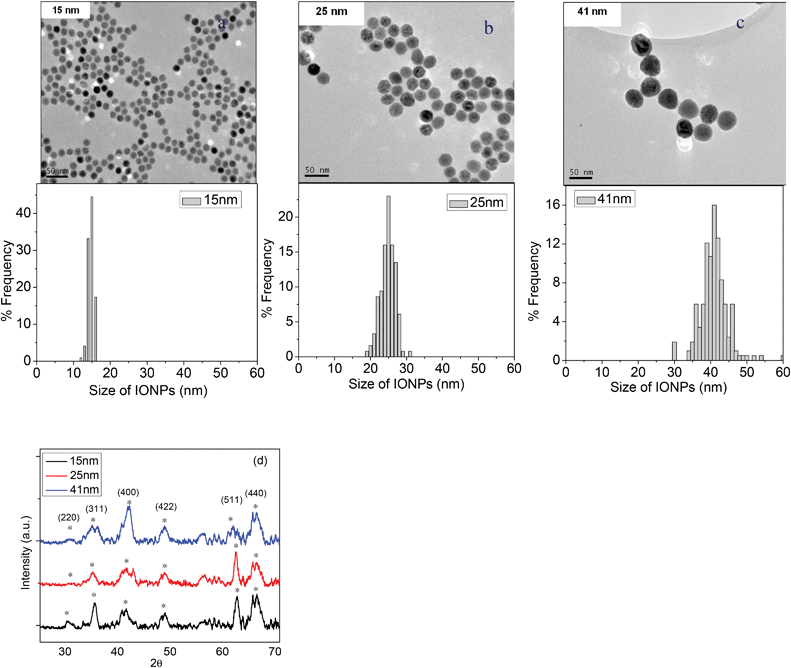 | ||
| Fig. 1 TEM images showing the morphology and size distribution graphs for the 15 nm (a), 25 nm (b), and 41 nm (c) IONPs used in this study, and the XRD patterns of three different sizes of IONPs (d). | ||
The hydrodynamic diameters of IONPs in a water-based solution were determined by dynamic light scattering (DLS) analysis. Compared to the IONP sizes obtained from TEM, the corresponding hydrodynamic diameters were much larger. The hydrodynamic sizes of 15 nm, 25 nm, and 41 nm IONPs were measured to be 28.7 ± 0.1 nm, 43.1 ± 0.2 nm, and 72.0 ± 0.1 nm, respectively (Table 1). All of the IONPs were water-soluble, iron oxide nanoparticles with an amphiphilic polymer coating, and they were negatively charged—as confirmed by the zeta potential analysis. The values were as follows: −38.49 mV, −40.29 mV, and −54.78 mV as shown in Table 1. These carboxylic water-based nanoparticles showed exceptional stability in aqueous solution.
3.2 XRD
X-ray diffraction studies of IONPs with different sizes were carried out using Cu Kα radiation. Fig. 1d shows the X-ray diffraction patterns of IONPs with different sizes. The three sizes of IONP patterns and peak positions were very close to those of the standard data of Fe3O4 alone.22 The diffraction peaks of all the samples at 2θ values of 30.6°, 35.7°, 41.8°, 49.0°, 62.1°, and 66.4° corresponded to the (220), (311), (400), (422), (511) and (440) planes of Fe3O4 magnetite crystal, respectively.3.3 Heating effect of the IONP size
To evaluate the influence of the IONP size on heating effects, we measured the maximum temperature reached after 10 min of RF (of 350 kHz) exposure for each IONP sample only (without culture cells) starting from room temperature. At 350 kHz RF exposure, the 25 nm IONPs reached the highest temperature of 55.1 °C, and the temperature increased by about 32 °C within 10 min of heating. Increasing or decreasing the particle size reduced the maximum temperature. For the higher frequency of 13.56 MHz RF, the highest temperature reached for 15 nm IONPs was 52.1 °C which was an increase of about 25 °C. As a result, the 25 nm IONPs showed the highest SLP data of 140.5 W g−1 under lower frequency heating as shown in Fig. 2b. However, the 15 nm IONPs showed a higher SLP of 97.8 W g−1 under 13.56 MHz irradiation. The temperature increases under RF treatment with the presence of IONPs were the result of the Néel and Brownian relaxation processes. In the Brownian relaxation process, the heat is generated from the friction between oscillating IONPs and the surrounding medium. Néel relaxation is due to the internal magnetic moment of IONPs. Superparamagnetic nanoparticles “relax” in accordance with the Néel mechanism and are ideal candidates for hyperthermia therapy.18 Smaller sized nanoparticles should be cooler, whereas larger particles with an optimum size should relax in accordance with the Brownian mechanism and should be hotter. The smaller particles in the external magnetic field of the RF rotate their magnetic moments more synchronously with the external magnetic field and thereby dissipate less of the RF electromagnetic energy to the environment including the cancer cells. It was to be expected that the heating effect or the temperature increase has a strong relationship with the volume (size) of the nanoparticles as the nanoparticle relaxation mechanism demonstrated.23 Meanwhile, the power of the RF also influences the heating efficiency (figure not shown here). With less power, the heating rate or the maximum temperature reached by IONPs decreased. Based on our experimental results, iron oxide particles smaller than 15 nm relax in the RF radiation by the Néel relaxation mechanism and do not heat as well but have stronger dynamic magnetic fields around them. On the other hand, as the size of the particles increases beyond 15 nm, the Brownian relaxation mechanism begins to dominate. Under Brownian relaxation, the particles’ magnetic moments align with the crystal axis, and the particles rotate as their magnetic moments rotate with the RF field. The rotation of the particles dissipates more of the RF radiation to heat; as a result, the particles are hotter and their magnetic fields are not as strong. The optimum particle size for rotation in the Brownian relaxation regime depends on the frequency of the RF: lower frequency RF favors larger particle size for optimum rotation and higher temperature; higher frequency RF favors smaller particle size for optimum rotation and higher temperature. At the frequency of 350 kHz, it appears that the optimum size for the rotation and Brownian heating is about 25 nm for iron oxide. The temperature of the 25 nm iron oxide nanoparticles should therefore be greater and more effective in killing cancer cells. Particles smaller than 15 nm should be cooler and dominated by the Néel relaxation mechanism; thus, the larger dynamic magnetic fields they possess as a result of RF excitation should manifest in stronger magnetic fields to kill cancer cells. However, at a frequency of 13.56 MHz, our data show that the optimum size for Brownian heating is about 15 nm as evidenced in both the temperature profile and SLP graph in Fig. 2b. As the literature reported, if RF heating is performed at frequencies below 1 MHz where the dielectric heating of the water is negligible,24 only the heating by IONPs should be observed.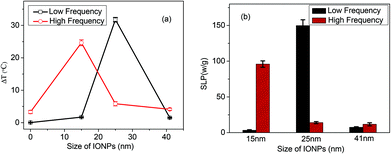 | ||
| Fig. 2 The changes of temperature (a) and specific loss of power (SLP) profile (b) of IONPs with different sizes under the RF heating at a low frequency of 350 kHz at 1.2 kW and a high frequency of 13.56 MHz at 70 W. In profile (a), the IONPs size of 0 stands for the control DI water only, containing no IONPs. Values given are means ± SD (n = 3). | ||
3.4 IONPs cytotoxicity evaluation
WST-1 and LDH assays were used to evaluate the cytotoxicity of IONPs of various sizes. These assays have been used to assess the cytotoxicity of nanomaterials in several studies.25–27 The WST-1 assay is sensitive to cellular mitochondrial activity and thus the proliferation of cells. Five different concentrations of nanoparticles varying from 1 to 100 μg ml−1 were used in the WST-1 assay. After 24 hours of incubation with MCF-7 cells, cell viabilities were obtained by comparison with the control without IONPs. The results showed that there was little cytotoxicity (<15%) for the MCF-7 cells using this range of concentrations (see Fig. 3a).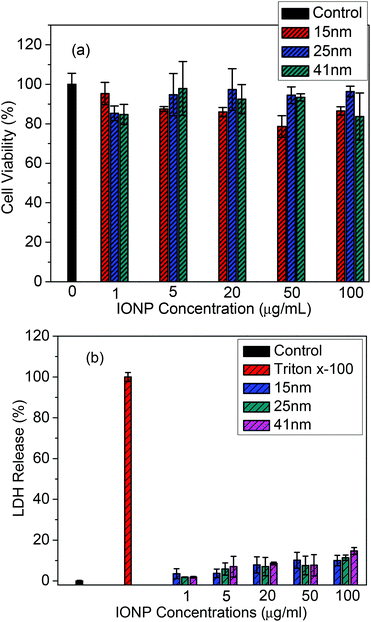 | ||
| Fig. 3 Cytotoxicity assays of MCF-7 cells exposed for 24 hours on increasing concentrations (0–100 μg ml−1) of different sizes of IONPs: (a) WST-1 and (b) LDH assays (Triton X-100 as the positive control). Values given are means ± SD (n = 4). | ||
The cell death caused by the nanoparticles largely occurred through apoptosis or necrosis. One of the most important enzymes, lactate dehydrogenase (LDH)—which may be used to monitor cell membrane integrity by evaluating the amount of the enzyme released into the culture medium—was measured in this study. LDH released into the extracellular culture medium activates coupled enzymatic reactions. The amount of formazan salt developed is directly proportionate to the amount of LDH released from the cell. Treatment of MCF-7 with IONPs with different concentrations after 24 hours revealed only a 7–15% LDH release when the highest concentration (100 μg ml−1) was used, suggesting that the IONPs generated very little necrotic or apoptotic damage to the MCF-7 cells.
3.5 Flow-cytometry to determine the cellular death
To examine the thermal ablation capabilities of IONPs on cancer cells in vitro, the flow cytometry cell viability assay was carried out on MCF-7 cells, and the results are represented in Fig. 4. All samples were divided into two groups and exposed to two frequencies of RF for 20 min, individually. The control cells without any nanoparticles, with and without RF treatment, showed a viability of approximately 86–92% for both frequencies of RF treatment. As a result, we may conclude that the RF treatment had no effect on the control cells—a fact that has also been demonstrated in our group's previous works.28,29 The incubation of MCF-7 with various sizes of IONPs along with the RF treatments greatly enhanced the percentage of dead cells, especially at a lower RF frequency. Very similar trends in cell damage were seen in the flow cytometry data and the SLP temperature profile data, as discussed in section 3.2. The 25 nm IONPs gave us the highest number of dead cells (∼43.4%) after the low-frequency RF treatment when the concentration reached 50 μg ml−1 compared to 33.6% for cells dosed with 20 μg ml−1. The increase in IONP concentration was reflected in the greater number of cells killed.12 However, after the high-frequency RF treatment, the 15 nm IONPs produced the highest percentage (∼25.0%) of dead cells.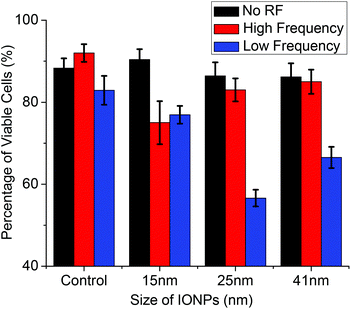 | ||
| Fig. 4 Flow cytometry measurement of cell viability before and after exposure to a high frequency of 13.56 MHz RF and a low frequency of 350 kHz RF treatment using different sizes of IONPs at a concentration of 50 μg ml−1. Values given are means ± SD (n = 3). | ||
3.6 Examination of cellular uptake of IONPs
In order to confirm that the IONPs were taken up into the cancer cells efficiently, high-resolution, dark-field optical microscope imaging and TEM were performed. Dark-field imaging (Fig. 5b) revealed that the IONPs accumulated efficiently on the surface of the plasma membrane and within the cytoplasm of MCF-7 cells after 12 hours of incubation. We expected the cells to begin uptaking nanoparticles in less than 2 hours, based on previous in vivo experimental work with the murine breast adenocarcinoma cell line.30 TEM visualization was also conducted to further confirm the internalization of particles within the cell cytoplasm. TEM images of the cells that had been exposed to 25 nm IONPs showed that the nanoparticles were sequestered inside the cells after 24 h of exposure. All TEM images revealed that nanoparticles had accumulated within the cell cytoplasm and that most of them had aggregated inside the late endosome and lysosome after 24 hours of incubation. Additionally, more than one vesicle appeared within the cytoplasm of a single cell (Fig. 5c). The ICP-MS data shown in Fig. 5d further confirmed that the IONPs were internalized into the MCF-7 cells after 24 hours of incubation. The data also indicated that the 41 nm size of IONPs gave the highest elemental Fe uptake after 24 hours of incubation. Approximately 17.4 μg per 200![[thin space (1/6-em)]](https://www.rsc.org/images/entities/char_2009.gif) 000 cells of Fe were internalized, which is more than 2 times higher than the 25 nm one and 5 times higher than the 15 nm one. In other literature, Chan21 and Cheng et al.31 found that gold nanoparticles and silica nanoparticles have size dependent uptakes which were consistent with the size-dependent uptake rate of iron oxide nanoparticles in our study. For the uptake mechanisms, there have been many proposals for the types of endocytosis induced by nanoparticles: clathrin-mediated endocytosis, caveolae-mediated endocytosis, and clathrin- and caveolae-independent endocytosis.32,33 However, the mechanism for the carboxylic-functionalized IONPs used in this work is still under investigation. Nevertheless, it can be concluded that the internalization of IONPs by the MCF-7 cells is size-dependent. In this way, we can conclude that the RF heating efficiency and its impact on cell viability are not directly dependent upon the total Fe concentration taken up by the cells, but that it is primarily determined by the total concentration of nanoparticles within the cells and their size, which controls their ability to interact with various RF frequencies.
000 cells of Fe were internalized, which is more than 2 times higher than the 25 nm one and 5 times higher than the 15 nm one. In other literature, Chan21 and Cheng et al.31 found that gold nanoparticles and silica nanoparticles have size dependent uptakes which were consistent with the size-dependent uptake rate of iron oxide nanoparticles in our study. For the uptake mechanisms, there have been many proposals for the types of endocytosis induced by nanoparticles: clathrin-mediated endocytosis, caveolae-mediated endocytosis, and clathrin- and caveolae-independent endocytosis.32,33 However, the mechanism for the carboxylic-functionalized IONPs used in this work is still under investigation. Nevertheless, it can be concluded that the internalization of IONPs by the MCF-7 cells is size-dependent. In this way, we can conclude that the RF heating efficiency and its impact on cell viability are not directly dependent upon the total Fe concentration taken up by the cells, but that it is primarily determined by the total concentration of nanoparticles within the cells and their size, which controls their ability to interact with various RF frequencies.
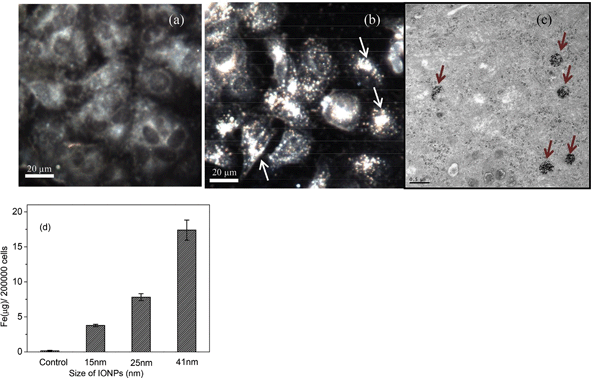 | ||
| Fig. 5 Dark-field microscope images of (a) control MCF-7 cell; (b) treated cells with 25 nm IONPs for 12 hours. Arrowheads show that IONPs accumulated on the surface of the cell membrane or within the cytoplasm of MCF-7 cells. Scale bar = 20 μm. (c) TEM images of MCF-7 cell treated with 25 nm IONPs for 24 hours. Red arrows indicate cytoplasmic aggregation of IONPs which indicates that the IONPs were uptaken inside the cells. (d) Total amount of Fe in MCF-7 cells after 24 hours incubation of different sizes of IONPs quantified by ICP-MS (mean ± SD, N = 3). | ||
3.7 Cell morphology examination after RF treatment
The morphological alterations of MCF-7 cells after RF treatments were observed by SEM. We were able to capture the dynamic plasma membrane blebs as shown in Fig. 6b. Plasma membrane blebbing is one of the distinct phenomena of apoptosis. During the final stage of cell death, cells undergo morphological changes characterized by the evagination of the plasma membrane from its normal position toward the extracellular environment. This change results from the remodeling of actin and myosin which form part of the cytoskeleton structure.34,35 The TEM image (Fig. 6c) of cells after RF exposure revealed that the cell plasma membrane had become uneven and that the cells showed signs of fragmentation by developing sealed membrane vesicles, termed apoptotic bodies. Mitochondrial damage was also found after the RF treatments, as shown in Fig. 6d. In addition, the nanoparticles were found to have been released back into the extracellular environment, which was another indication of plasma membrane disruption after RF treatment.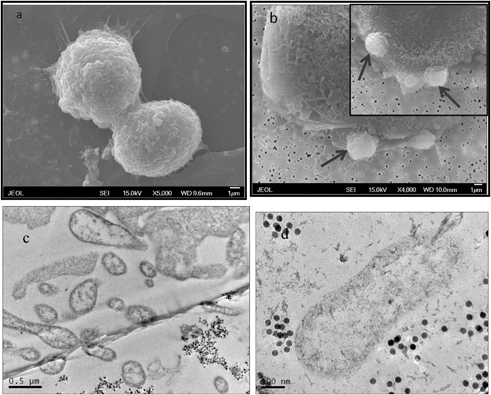 | ||
| Fig. 6 SEM images of MCF-7 (a) and MCF-7 cells exposed to 50 μg ml−1 of 25 nm IONPs that were exposed to RF (350 kHz) for 20 minutes; arrows point to the outward evagination of cell plasma membrane (b); the inset is an enlarged image showing plasma membrane blebs. (c) TEM image showing cell destruction, fragmentation, and (d) mitochondrial damage after being exposed to RF. | ||
As seen in the TEM image of Fig. 5, the particles accumulated efficiently within the cytoplasm. Moreover, more than one vesicle filled with IONPs appeared in the cytoplasm of the cells; this also allowed localized heating12,27 corresponding to the location of the particles when the cells were subjected to the RF. Heating the cells causes irreversible changes, inactivates intracellular metabolic processes, initiates apoptosis and membrane damage. The subsequent cellular death profiles are shown in Fig. 4 and 6d. It was observed that the aggregated nanoparticles showed much more efficient heat generation when compared with the non-aggregated ones, also reported before.36
3.8 ROS (reactive oxygen species) induction
In this experiment, a fluorogenic probe 2′,7′-dichlorodihydrofluorescein diacetate (H2DCFDA) was used to study the oxidative stress potential induced by the RF treatment. H2DCFDA is able to penetrate the cell and convert into a highly fluorescent product (DCF) upon oxidation. The generated ROS level can be measured from the fluorescence intensity which is proportionally correlated. Generally, the formation of ROS is a natural phenomenon of live cells, and it is a by-product of the cell metabolic activity of oxygen. Under normal conditions, a cell can balance a certain amount of increased oxygen-containing molecules through the defense system that most cells possess, but cells cannot buffer an excessive amount of ROS. Stress or toxic conditions such as heat and pathogenic inflammation may lead cultured cells to increase the intracellular level of ROS significantly. Moreover, the induction of intracellular ROS levels in live cells is considered one of the common mechanisms of nanoparticle toxicity.37 One of the mechanisms of IONP-induced cellular death is the generation of reactive oxygen species (ROS) from mitochondria.38 ROS leads to oxidative stress and damage to the mitochondria, as well as perturbation of mitochondrial activities which induces apoptosis.39 Accumulation of a great amount of ROS leads to cascades of negative events and finally results in cell death. Cell death results from mitochondrial damage,40 DNA damage,41 and apoptosis induction.42 In our experiment, the amount of intracellular ROS after 24 hours of incubation with 50 μg ml−1 of 25 nm IONPs was negligible compared to the control samples for the concentration used in our study. After RF treatments, the ROS induction levels were significantly increased. As shown in Fig. 7, the green fluorescence level for the RF treatment was very close to the one generated by the standard positive control H2O2 (100 μM). However, only weak fluorescence intensity was observed in the control samples after RF treatment. The mechanism for the cell death induced by RF treatment can largely be attributed to apoptosis in MCF-7 cell lines—primarily through the mitochondrial pathway by the generation of ROS. This conclusion is also supported by the TEM image in Fig. 6d showing that the mitochondria were damaged by RF treatment.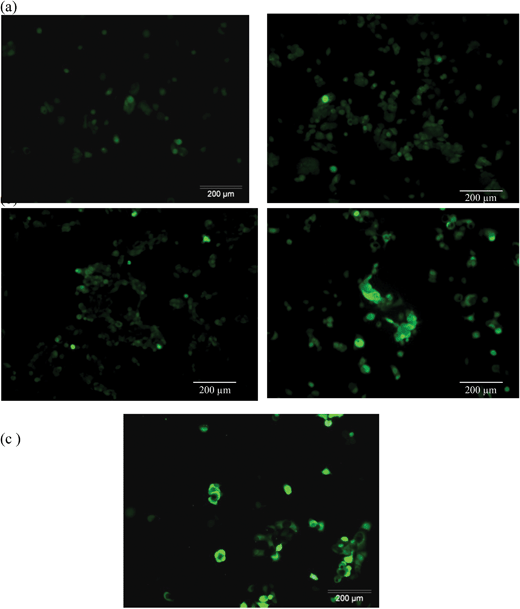 | ||
| Fig. 7 ROS-H2DCFDDA assay for intracellular reactive oxygen species with IONPs with (right column) and without (left column) RF treatment. (a) The control and (b) at a concentration of 50 μg ml−1. (c) H2O2 (100 μM) as the positive control. | ||
3.9 Localized heating of chicken tissue by injection of IONPs under the RF treatment
IONPs were injected into chicken tissue, and the temperature was measured before and after exposure to the low frequency of the RF generator. The heating shown in Fig. 8 only occurred in those portions of the tissue that had been injected with nanoparticles; the part without nanoparticles could not be heated under RF treatment. As reported, low frequency radiation, such as approximately 400 kHz, can penetrate into the biological tissues efficiently at approximately 15 cm depth.43 As a result, we can conduct cancer treatment deep inside the body. As shown in Fig. 8, the experiment further confirmed that the tissue can be locally heated efficiently using low-frequency (350 kHz) RF treatment. The results confirmed the potential for cancer treatment using thermal therapy assisted by nanotechnology in the future. Healthy tissue can be preserved, while cancerous tissue is heated and destroyed using certain sizes of nanoparticles and low-frequency RF heating.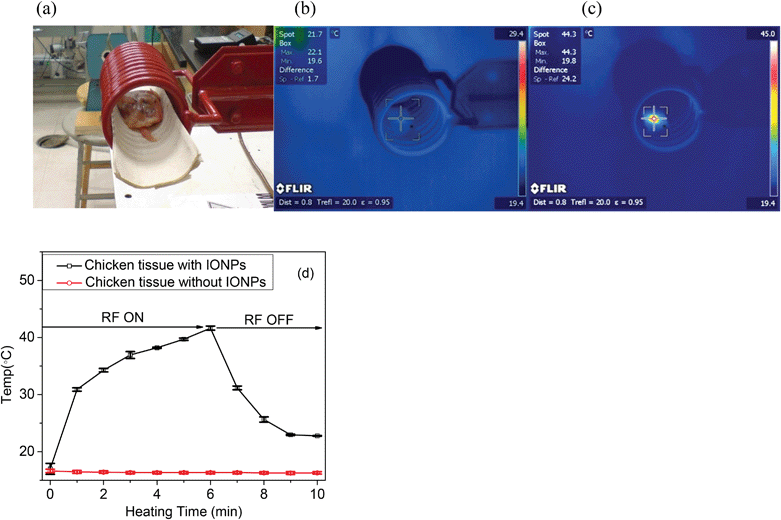 | ||
| Fig. 8 Temperature distribution on chicken tissue by injection of IONPs (5 mg mL−1, 25 nm) under RF (350 kHz) treatment: (a) a photograph of a piece of chicken after injection of IONPs inside the RF coil; (b) before and (c) after heating under the RF for 10 min which showed that the localized temperature increases to 44.3 °C from room temperature; (d) the temperature changes in chicken tissue with and without IONPs during 6 min of RF heating and 4 min of cooling. Values given are means ± SD (n = 3). | ||
4. Conclusions
Our research demonstrated that IONPs are excellent candidates for the hyperthermia treatment of human breast cancer cells. Nanoparticle size and RF frequency are critical parameters that influence the optimum level of the hyperthermia effect. For 350 kHz lower frequency RF, the 25 nm IONPs proved to be the most efficient in killing the cancer cells. At a higher frequency (13.56 MHz) of RF, smaller sized (15 nm) IONPs are the most effective. RF-induced heat treatment was found to damage the cells’ plasma membrane and mitochondria membrane, thus greatly increasing ROS levels and causing cellular apoptosis.Acknowledgements
The support for this research received from the Arkansas Science and Technology Authority (ASTA) through grant no. 08-CAT-03 is acknowledged. The financial support provided by the US Army TATRC program is acknowledged. The supports for this work received from The Office of Experimental Program to Stimulate Competitive Research (EPSCoR) of National Science Foundation of USA and South Carolina State University are acknowledged. The editorial assistance by Dr Marinelle Ringer is also acknowledged. Ocean NanoTech is acknowledged for supplying the iron nanoparticle samples for the XRD analysis.Notes and references
- J. H. Kim, S. H. Kim, A. A. Alfieri and C. W. Young, Cancer Res., 1984, 44, 102–106 CAS.
- P. Vaupel, F. Kallinowski and P. Okunieff, Cancer Res., 1989, 49, 6449–6465 CAS.
- J. T. Leith, R. C. Miller, E. W. Gerner and M. L . Boone, Cancer, 1977, 39, 766–779 CrossRef CAS.
- L. F. Fajardo, Cancer Res., 1984, 44, 4826s–4835s CAS.
- C. Steffer, M. H. Seegenschmiedt, P. Fessenden and C. C. Vernon, Principles and practice of thermoradiotherapy and thermochemotherapy, Springer Verlag, Berlin, 1995, vol. 1, pp. 47–74 Search PubMed.
- A. Ito, M. Shinkai, H. Honda and T. Kobayashi, J. Biosci. Bioeng., 2005, 100, 1–11 CrossRef CAS.
- M. Babincová, P. Cicmanec, V. Altanerová, C. Altaner and P. Babinec, Bioelectrochemistry, 2002, 55, 17–19 CrossRef.
- U. Bilkenroth, H. Taubert, D. Riemann, U. Rebmann, H. Heynemann and A. Meye, Int. J. Cancer, 2001, 92, 577–582 CrossRef CAS.
- L. Yang, X. H. Peng, Y. A. Wang, X. Wang, Z. Cao, C. Ni, P. Karna, X. Zhang, W. C. Wood and X. Gao, Clin. Cancer Res., 2009, 15, 4722–4732 CrossRef CAS.
- S. Krishnan, P. Diagaradjane and S. H. Cho, Int. J. Hyperthermia, 2010, 26, 775 CrossRef.
- R. K. Gilchrist, R. Medal, W. D. Shorey, R. C. Hanselman and J. C. Parrott, Ann. Surg., 1957, 146, 596–606 CrossRef CAS.
- Y. Xu, A. Karmakar, D. Wang, M. W. Mahmood, F. Watanabe, Y. Zhang, A. Fejleh, P. Fejleh, Z. Li and G. Kannarpady, J. Phys. Chem. C, 2010, 114, 5020–5026 CAS.
- C. L. Dennis, A. J. Jackson, J. A. Borchers, R. Ivkov, A. R. Foreman, P. J. Hoopes, R. Strawbridge, Z. Pierce, E. Goerntiz, J. WLau and C. Gruettner, J. Phys. D: Appl. Phys., 2008, 41, 134020–134025 CrossRef.
- A. K. Gupta and M. Gupta, Biomaterials, 2005, 26, 3995–4021 CrossRef CAS.
- J. H. Lee, J. T. Jang, J. S. Choi, S. H. Moon, S. H. Noh, J. W. Kim, J. G. Kim, I. S. Kim, K. I. Park and J. Cheon, Nat. Nanotechnol., 2011, 6, 418–422 CrossRef CAS.
- D. L. Zhao, H. L. Zhang, X. W. Zeng, Q. S. Xia and J. T. Tang, Biomed. Mater., 2006, 1, 198–201 CrossRef CAS.
- J. Shao, R. J. Griffin, E. I. Galanzha, J. Kim, N. Koonce, J. Webber, T. Mustafa, A. S. Biris, D. A. Nedosekin and V. P. Zharov, Sci. Rep., 2013, 3, 1293 CrossRef.
- R. Hergt, S. Dutz, R. Müller and M. Zeisberger, J. Phys.: Condens. Matter, 2006, 18, S2919 CrossRef CAS.
- A. R. Biris, M. Mahmood, M. D. Lazar, E. Dervishi, F. Watanabe, T. Mustafa, G. Baciut, M. Baciut, S. Bran, S. Ali and A. S. Biris, J. Phys. Chem. C, 2011, 115, 18967–18976 CAS.
- Y. Zhang, S. F. Ali, E. Dervishi, Y. Xu, Z. Li, D. Casciano and A. S. Biris, ACS Nano, 2010, 4, 3181–3186 CrossRef CAS.
- B. D. Chithrani and C. W. Chan, Nano Lett., 2007, 7, 1542–1550 CrossRef CAS.
- B. Banerji, S. Kumar Pramanik, S. Mandal, N. C. Maiti and K. Chaudhuri, RSC Adv., 2012, 2, 2493–2497 RSC.
- R. Rosensweig, J. Magn. Magn. Mater., 2002, 252, 370–374 CrossRef CAS.
- D. Haemmerich, IEEE Trans. Biomed. Eng., 2011, 58(2), 404–410 CrossRef.
- M. Gonzales, L. Mitsumori, J. Kushleika, M. Rosenfeld and K. Krishnan, Contrast Media Mol. Imaging, 2010, 5, 286–293 CrossRef CAS.
- M. Uo, K. Tamura, Y. Sato, A. Yokoyama, F. Watari, Y. Totsuka and K. Tohji, Small, 2005, 1, 816–819 CrossRef CAS.
- Y. Zhang, Y. Xu, Z. Li, T. Chen, S. M. Lantz, P. C. Howard, M. G. Paule, W. J. Slikker, F. Watanabe, T. Mustafa, A. S. Biris and S. F. Ali, ACS Nano, 2011, 5, 7020–7033 CrossRef CAS.
- Y. Xu, M. Mahmood, Z. Li, E. Dervishi, S. Trigwell, V. P. Zharov, N. Ali, V. Saini, A. R. Biris and D. Lupu, Nanotechnology, 2008, 19, 435102 CrossRef.
- A. Karmakar, Y. Xu, M. W. Mahmood, Y. Zhang, L. M. Saeed, T. Mustafa, S. Ali, A. R. Biris and A. S. Biris, J. Mater. Chem., 2011, 21, 12761–12769 RSC.
- A. J. Giustini, R. Ivkov and P. J. Hoopes, Nanotechnology, 2011, 22, 345101 CrossRef CAS.
- L. Tang, T. M. Fan, L. B. Borst and J. Cheng, ACS Nano, 2012, 6, 3954–3966 CrossRef CAS.
- J. Huang, L. Bu, J. Xie, K. Chen, Z. Cheng, X. Li and X. Chen, ACS Nano, 2010, 4(12), 7151–7160 CrossRef CAS.
- S. D. Conner and S. L. Schmid, Nature, 2003, 422, 37–44 CrossRef CAS.
- J. C. Mills, N. L. Stone, J. Erhardt and R. N. Pittman, J. Cell Biol., 1998, 140, 627–636 CrossRef CAS.
- R. R. Torgerson and M. A. McNiven, J. Cell Sci., 1998, 111, 2911–2922 CAS.
- C. L. Dennis, A. J. Jackson, J. A. Borchers, P. J. Hoopes, R. Strawbridge, A. R. Foreman, J. van Lierop, C. Grüttner and R. Ivkov, Nanotechnology, 2009, 20, 395103 CrossRef CAS.
- R. Hardman, Environ. Health Perspect., 2006, 114, 165–172 CrossRef.
- T. K. Jain, M. A. Morales, S. K. Sahoo, D. L. Leslie-Pelecky and V. Labhasetwar, Mol. Pharm., 2005, 2, 194–205 CrossRef CAS.
- M. Konczol, S. Ebeling, E. Goldenberg, F. Treude, R. Gminski, R. Giere, B. Grobety, B. Rothen-Rutishauser, I. Merfort and V. Mersch-Sundermann, Chem. Res. Toxicol., 2011, 24, 1460–1475 CrossRef CAS.
- T. Z. Yu, J. L. Robotham and Y. Yoon, Proc. Natl. Acad. Sci. U. S. A., 2006, 103, 2653–2658 CrossRef CAS.
- S. Loft and H. E. Poulsen, J. Mol. Med., 1996, 74, 297–312 CrossRef CAS.
- M. D. Jacobson, Trends Biochem. Sci., 1996, 21, 83–86 CAS.
- J. Young, M. T. Wang and I. Brezovich, Electron. Lett., 1980, 16, 358–359 CrossRef.
| This journal is © The Royal Society of Chemistry 2013 |
