DOI:
10.1039/C3AY41557K
(Paper)
Anal. Methods, 2013,
5, 6631-6636
Voltammetric behaviour of hydrogen peroxide at a silver electrode fabricated from a rewritable digital versatile disc (DVD) and its determination in water samples
Received
7th September 2013
, Accepted 8th October 2013
First published on 9th October 2013
Abstract
In this study we investigated the possibility of applying Ag electrodes manufactured from recordable rewritable digital versatile discs (DVD-RW) for the voltammetric determination of hydrogen peroxide. The calibration plot was linear from 0.087 mM to 3.41 mM hydrogen peroxide with a sensitivity of 58.7 μA mM−1 over this range. A corresponding detection limit of 78.35 μM, based on a signal-to-noise-ratio of 3 was recorded. No interferences were observed by 500 mg L−1 chloride, 50 mg L−1 nitrate, 700 mg L−1 sulphate or 700 mg L−1 carbonate which are found in swimming pool water at these concentrations. Using the multiple standard addition method a percentage recovery of 90.67% with a coefficient of variation of 4.69% (n = 5) was found for a representative swimming pool water concentration of 1.2 mM hydrogen peroxide. Therefore, the performance data suggests that the method is reliable at the concentrations examined in this study and that a rapid, simple, economical and precise method of monitoring hydrogen peroxide in swimming pool and aquaculture applications is possible.
1. Introduction
The detection of hydrogen peroxide at low levels is important in several different applications. One example is monitoring the levels of hydrogen peroxide present in swimming pools due to its increasing use as a disinfectant particularly in private swimming pools.1 The use of hydrogen peroxide as a disinfectant has become more popular as it has benefits over the use of chlorine based chemicals such as its lack of odour and irritation to the eyes associated with swimming pools. Similarly, there is a great deal of interest regarding its use as a disinfectant in food production2–4 particularly in aquaculture.5,6 It allows for the successful control of a number of pathogens and unlike other control measures it offers the advantages of leaving no harmful residues as only oxygen and water are formed. However, elevated levels of hydrogen peroxide can result in severe toxicity to tissues in the body whilst low levels will result in increased risk of pathogens remaining unchecked. Therefore, there is a pressing need for a simple economic method to ensure the desired concentration of hydrogen peroxide is maintained. Presently, there are several different methods for the determination of hydrogen peroxide which include titration7 and colorimetric assays.8–10 However, such techniques can be time consuming and require a degree of training. Notably, electrochemical techniques offer a number of advantages including cost, possibility of miniaturisation and high sensitivity. However, the direct electrochemical determination of hydrogen peroxide is hampered by the high potentials required for its direct oxidation or reduction.11–14 This can lead to problems such as high background currents resulting in poor signal-noise ratios and interferences from more easily reduced or oxidised compounds. A large volume of research has been centred on overcoming these problems and a number of different mediators and catalysts15 such as nanoparticles,16,17 cobalt phthalocyanine,18 Prussian blue19,20 and ferrocene21 have been successfully employed to lower the potentials required. A number of studies have shown the possibility of utilising electrodes manufactured from metals such as Ag17,22–27 for electrocatalytic determination of hydrogen peroxide. Table 1 gives an overview of a number of more recent reports of these and their relative performance characteristics. However, electrodes manufactured from noble metals can be quite expensive. Compact discs (CDs) and digital versatile discs (DVDs) have a thin layer of Au or Ag which can be used as an alternative cheap source to prepare such working electrodes.28 Studies have explored the possibility of determining a number of analytes at electrodes prepared from CDs and DVDs,29 however, these have been predominantly Au based.29–35 Recently, we have investigated utilising Ag electrodes manufactured from recordable compact discs for the trace determination of Pb by anodic stripping voltammetry.28 In this present study we have investigated the possibility of using DVDs to manufacture Ag electrodes without further pre-treatment for the determination of hydrogen peroxide in potable water. To our knowledge, there have only been a small number of reports utilising this approach for the determination of hydrogen peroxide. These have been focused on electrochemical pre-treatment36,37via repeated voltammetric scanning, forming a roughened surface characterised by dendritic structures; a process which does not lend its self to possible mass production and commercialisation. Ag electrodes made directly from recycled material have the potential to be a sustainable and economical technique for the measurement of hydrogen peroxide. Initial investigations were undertaken to explore the electrochemical behaviour of hydrogen peroxide at these electrodes. The conditions were then optimised for the determination of hydrogen peroxide in water at levels generally utilised in swimming pools, spas and in fish farming. A number of possible interferences were investigated and a water sample was then examined using the optimised voltammetric assay.
Table 1 Summary of various recently reported Ag based electrodes used for the determination of hydrogen peroxide
| Electrode |
Technique |
Linear range |
Detection limit, μM |
Sample |
Reference |
| Horseradish peroxidase directly adsorbed at polycrystalline Ag and Au electrodes |
Amperometry |
0.1 to 1.0 μM |
0.01 |
— |
38
|
| Dendritic Ag nanostructures electrochemically deposited at a glassy carbon electrode |
Amperometry |
4 μM to 36 μM |
0.9 |
Laboratory waste water |
39
|
| Ag nanoparticle-decorated graphene on indium-tin-oxide electrode |
Amperometry |
0.1 mM to 100 mM |
5 |
— |
40
|
| Ag nanoparticle-modified glassy carbon electrode |
Cyclic voltammetry |
5 to 40 μM |
2 |
— |
41
|
| Glassy carbon electrode modified with Ag nanograins incorporated poly[3,4-ethylenedioxythiophene] (PEDOT) |
Amperometry |
Up to ca. 1 mM |
7 |
— |
42
|
| Electrochemically pre-treated Ag electrode manufactured form a compact disc |
Amperometry |
10.0 μM to 22.5 mM |
6 |
— |
37
|
| Electrochemically pre-treated Ag electrode manufactured from a DVD |
Amperometry |
0.588 μM to 67.3 μM |
0.2 |
Peroxide based disinfectant |
36
|
| Dodecyl benzenesulphonic acid and KCl modified Ag screen-printed electrodes |
Amperometry |
1.25 μM to 225 μM |
5.8 |
— |
22
|
| HRP biosensor based on Ag@C nano-composite |
Amperometry |
0.5 μM to 140 μM |
0.2 |
— |
43
|
| Ag nanoparticles/multiwalled carbon nanotube-modified glassy carbon electrode |
Amperometry |
0.1 mM to 10 mM |
2 |
— |
44
|
| Ag nanoparticle coated glassy carbon electrode |
Amperometry |
Up to 75 μM |
1.3 |
— |
45
|
| Indium-tin-oxide electrode modified with Ag nanoparticles stabilized by amine grafted mesoporous SBA-15 |
Amperometry |
0.3 mM to 2.5 mM |
300 |
— |
46
|
| Silver nanowire (50 nm) array sensor |
Amperometry |
0.1 mM to 3.1 mM |
29 |
— |
47
|
| Unmodified Ag electrode manufactured from a DVD-RW |
Cyclic voltammetry |
0.087 mM to 3.41 mM |
78.4 |
Artificial swimming pool water |
This report |
2. Materials and methods
2.1. Apparatus
Cyclic voltammetry was performed with an Autolab potentiostat interfaced to a PC for data acquisition via the General Purpose Electrochemical System Software Package (GPES) version 3.4 (Autolab, Windsor Scientific Limited, Slough Berkshire UK). The voltammetric cell contained a graphite rod counter electrode, a saturated calomel electrode (SCE) (Russell, Fife, UK) and a 5 mm diameter Ag electrode manufactured from a rewritable digital versatile disc (DVD-RW) as the working electrode. The electrode was connected to the potentiostat using a crocodile clip attached to coaxial cable inserted into the appropriate sockets. The cell used for the voltammetric measurements was obtained from Metrohm (Switzerland).
2.2. Chemical and reagents
All chemicals were of Primar grade and supplied from Fisher (Loughborough, UK), unless stated otherwise. 174 mM hydrogen peroxide stock solutions were prepared by dissolving the appropriate volume in deionised water. Working standards, for optimisation of studies, were then prepared by dilution of the primary stock solution with deionised water. Deionised water was obtained from a Purite RO200-Stillplus HP System, (Purite Oxon, UK). Solutions of disodium, trisodium, sodium o-phosphate and o-phosphoric acid were made at a concentration of 0.2 M by dissolving the appropriate mass in deionised water. These were then titrated together to give the desired pH. An appropriate volume was then added directly to the voltammetric cell and diluted with sufficient deionised water to give an overall phosphate concentration of 0.1 M.
2.3. Construction of compact disc electrode
The DVD-RW used in this study was constructed of several layers;48 a lower polycarbonate substrate, a dye data storage layer, a Ag reflective layer and a printable layer for the labelling or incorporation of a design. Fig. 1 gives a diagrammatic explanation of the construction of the silver working electrode from the rewritable digital versatile disk (Imation, DVD-RW). The DVD-RW was mechanically delaminated by cutting with a suitable pair of scissors and applying slight bending pressure by hand until the upper layer can be peeled away. 10 mm × 60 mm sections of the DVD-RW were then cut out and the upper Ag layer cover with dielectric adhesive tape modified with a 5 mm diameter hole to define the working electrode area. A strip of exposed Ag was retained at the opposite end to be used as an electrical contact to the potentiostat. The resulting working Ag electrode was then used without further treatment as part of a three electrode system.
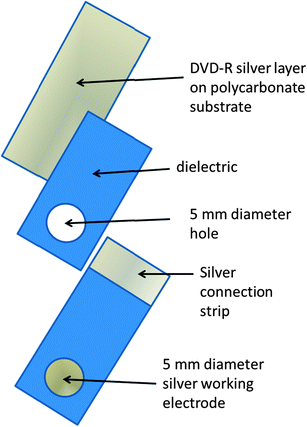 |
| | Fig. 1 Schematic of electrode construction. | |
2.4. Voltammetric procedures
Cyclic voltammograms were initially recorded in plain solutions 0.1 M of phosphate buffer, and then in the same solution containing 1.74 mM of hydrogen peroxide. The voltammetric conditions were as follows: initial and final potential, 0.0 V; scan rate 50 mV s−1 and switching potential, −1.0 V.
2.5. Scanning electron microscopy
Scanning electron microscopy was undertaken using a Philips XL30 ESEM. Energy dispersive X-ray microanalysis (EDX) was undertaken using an Oxford Instruments Link ISIS 3.2 EDX system.
3. Results and discussion
3.1. Scanning electron microscopy
Fig. 2 shows a representative scanning electron micrograph of the Ag metal layer obtained from the DVD-RW. Tracks can be seen across the surface a DVD reader/writer laser to follow. These appear as a series of ca. 1 μm spaced parallel stripes. Further EDX analysis showed this layer to be composed of Ag with little evidence of other elements.
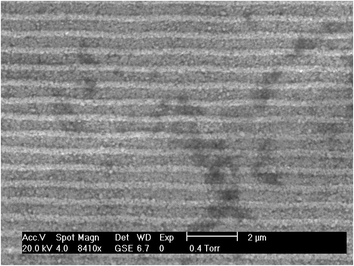 |
| | Fig. 2 SEM imagine of the surface of the DVD-RW Ag working electrode. | |
3.2. Cyclic voltammetry
Fig. 3d shows the cyclic voltammogram of 1.74 mM hydrogen peroxide in a 0.1 M phosphate buffer pH 7 at our Ag DVD-RW. Similarly to that previously reported at conventional Ag electrodes,15,16 a single reduction peak was seen on the negative going scan. Consequently, we believe that this reduction peak results from the same 2e−, 2H+ reduction processes (eqn (1) and (2)).
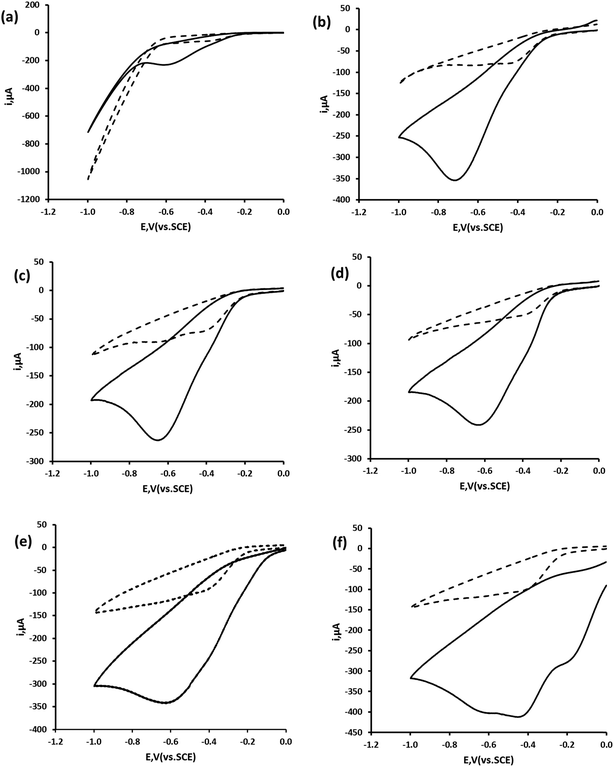 |
| | Fig. 3 Cyclic voltammetric behaviour of hydrogen peroxide at Ag DVD-RW electrode in the absence (dashed line) and in the presence of 1.74 mM hydrogen peroxide (solid line) in 0.1 M pH phosphate buffer. (a) pH 2; (b) pH 4; (c) pH 6; (d) pH 7; (e) pH 8 and (f) pH 10. Voltammetric conditions: start and end potential 0.0 V; switching potential −1.0 V; scan rate 50 mV s−1. | |
The shoulder seen on this main peak (Ep = −0.35 V) was concluded to result from the previous reported mechanism,49 whereby hydrogen peroxide undergoes a one proton, one electron reduction to give an adsorbed hydroxyl radical and water (eqn (1)). This adsorbed species then undergoes a further one proton, one electron reduction (eqn (2)) resulting in the two waves.
| | | H2O2 + H+ + e− → OH˙(ads) + H2O | (1) |
| | | OH˙(ads) + H+ + e− → H2O | (2) |
3.3. Effect of pH
The relationship of pH with the peak potential (Ep) of this peak was investigated over the pH range 2 to 10. Fig. 3 shows representative cyclic voltammograms undertaken using a scan rate of 50 mV s−1. A near theoretical relationship between Ep and pH was obtained between pH 4 and pH 10. A marked difference in the voltammetric behaviour was seen at pH 10, presumed to result from the ionisation of the hydrogen peroxide molecule (pKa = 11.75). As we wished to determine hydrogen peroxide concentrations in swimming and potable water samples further investigations were made at pH 7 (Fig. 4).
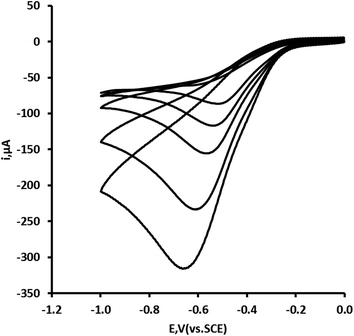 |
| | Fig. 4 Effect of scan rate on the cyclic voltammetric behaviour of a 1.74 mM in 0.1 M pH 7 phosphate buffer. Scan rate varied between 5, 10, 20, 50 and 100 mV s−1; all other voltammetric conditions as Fig. 1. | |
3.4. Calibration and limit of detection
The calibration plot was found to be linear over the range 0.087 mM to 3.41 mM hydrogen peroxide with a slope of 58.7 μA mM−1, with an associated R2 value of 0.996. The coefficient of variation was determined on four replicate measurements at 0.174 mM and 0.690 mM was calculated to be 2.2% and 1.67% respectively. The limit of detection was calculated by making replicate current measurements of a blank solution; the detection limits based on three times the standard deviation of these measurements gave a value of 78.35 μM.
3.5. Interference study
A number of compounds have been reported to be present in relatively high concentrations in swimming pool and potable water supplies,1 such as, chloride, nitrate, sulphate and carbonate. Smaller concentrations of other electrochemically active species such as Cu2+ and Fe3+ are also suspected. No interferences were seen for 500 mg L−1 chloride, 50 mg L−1 nitrate, 700 mg L−1 sulphate or 700 mg L−1 carbonate. A small oxidation peak at 0 V was seen in the presence of Cu2+ (3 mg L−1) and for Fe3+ (3 mg L−1). However, this did not interfere with the reduction of hydrogen peroxide or with its quantification.
3.6. Analytical application
A 5 mL water sample aliquot was diluted with 5 mL of 0.2 M pH 7 phosphate buffer and the concentration of hydrogen peroxide was determined using a method of multiple standard additions. Fig. 5 shows representative cyclic voltammograms for this sample and the subsequent standard additions of hydrogen peroxide. The resulting standard addition plot is shown alongside. The recovery and precision data obtained for five replicate samples is shown in Table 2. The method can be seen to give reliable data at the concentrations investigated here. The percentage recovery for a typical swimming pool water concentration of 1.2 mM (40.8 mg L−1) of hydrogen peroxide was found to be 90.67% with an associated coefficient of variation of 4.69% (n = 5).
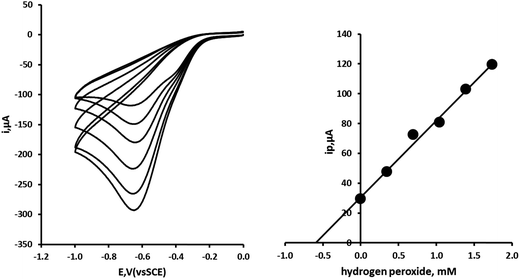 |
| | Fig. 5 Multiple standard additions of hydrogen peroxide made to water sample fortified with 1.2 mM (40.8 mg L−1) hydrogen peroxide. Each addition the equivalent of 348 μM (11.8 mg L−1) hydrogen peroxide. | |
Table 2 Recovery and precision data for hydrogen peroxide obtained on water samplea
| Sample |
Native, mM |
Added, mM |
Found, mM |
% Recovery |
|
Mean recovery = 90.67%; coefficient of variation = 4.69%; n/d = not detected.
|
| 1 |
n/d |
1.218 |
1.178 |
96.71 |
| 2 |
n/d |
1.218 |
1.060 |
87.03 |
| 3 |
n/d |
1.218 |
1.090 |
89.49 |
| 4 |
n/d |
1.218 |
1.058 |
86.86 |
| 5 |
n/d |
1.218 |
1.136 |
93.27 |
4. Conclusions
Quantification of hydrogen peroxide has been shown to be possible at Ag electrodes manufactured from an unmodified DVD-RW. A limit of detection of 78.35 μM (based on three times the standard deviation of the noise) was recorded with a linear range from 0.087 mM to 3.41 mM (R2 = 0.996) hydrogen peroxide. This paper demonstrates that hydrogen peroxide produces a well-defined electrocatalytic signal at our DVD-RW electrodes. A simple and convenient assay for hydrogen peroxide was developed, based on this device in conjunction with cyclic voltammetry. The results indicate that a method based on multiple standard additions is both highly accurate and precise, obtaining a coefficient of variation of 4.69% for a water sample fortified with 40.8 mg L−1 (1.2 mM) levels commonly reported in aquaculture and swimming pools applications. In further studies we plan to investigate improving the sensitivity of the assay by the use of more advanced voltammetric waveforms such as differential pulse voltammetry and techniques such as amperometry.
Acknowledgements
We would like to thank the University of the West of England. Dr David Patton is thanked for his assistance with the SEM and EDX analysis. Mr Paul Bowdler is thanked for his assistance in the preparation of this manuscript.
References
- A. Schwake, B. Ross and K. Cammann, Sens. Actuators, B, 1998, 46, 242–248 CrossRef CAS.
- B. W. Sheldon and J. Brake, Poult. Sci., 1991, 5, 1092–1099 CrossRef.
- N. Y. Mostafa, Global Vet., 2010, 4, 362–365 CAS.
- D. O. Ukuku, M. L. Bari, S. Kawamoto and K. Isshiki, Int. J. Food Microbiol., 2005, 104, 225–233 CrossRef CAS PubMed.
- L.-F. Pedersen and P. B. Pedersen, Aquacultural Engineering, 2012, 46, 40–46 CrossRef PubMed.
-
L. J. Schmidt, M. P. Gaikowski and W. H. Gingerich, Environmental Assessment for the Use of Hydrogen Peroxide in Aquaculture for Treating External Fungal and Bacterial Diseases of Cultured Fish and Fish Eggs, U.S. Geological Survey, Biological Resources Division, 2006, http://www.fda.gov/ucm/groups/fdagov-public/@fdagov-av-gen/documents/document/ucm072399.pdf, accessed 5/8/13.
- E. C. Hurdis and H. Romeyn, Anal. Chem., 1954, 26, 320–325 CrossRef CAS.
- R. M. Sellers, Analyst, 1980, 105, 950–954 RSC.
- P. A. Tanner and A. Y. S. Wong, Anal. Chim. Acta, 1998, 370, 279–287 CrossRef CAS.
- E. Pick and Y. Keisari, J. Immunol. Methods, 1980, 38, 161–170 CrossRef CAS.
- X. Li, D. Heryadi and A. A. Gewirth, Langmuir, 2005, 21, 9251–9259 CrossRef CAS PubMed.
- D. Vasudevan, Bull. Electrochem., 2000, 16, 277–279 CAS.
- J. Wang and T. Golden, Anal. Chem., 1989, 61, 1397–1400 CrossRef CAS.
- K. Schachl, H. Alemu, K. Kalcher, J. Jeözkova, I. Svancara and K. Vytöras, Analyst, 1997, 122, 985–989 RSC.
- W. Chen, S. Cai, Q.-Q. Ren, W. Wen and Y.-D. Zhao, Analyst, 2012, 137, 49–58 RSC.
- S. Chen, R. Yuan, Y. Chai and F. Hu, Microchim. Acta, 2013, 180, 15–32 CrossRef CAS.
- C. M. Welch, C. E. Banks, A. O. Simm and R. G. Compton, Anal. Bioanal. Chem., 2005, 382, 12–21 CrossRef CAS PubMed.
- M. A. T. Gilmartin, R. J. Ewen, J. P. Hart and C. L. Honeybourne, Electroanalysis, 1995, 7, 547–555 CrossRef CAS.
- A. A. Karyakin, E. A. Puganova, I. A. Budashov, I. N. Kurochkin, E. E. Karyakina, V. A. Levchenko and V. N. Matveyenko, Anal. Chem., 2004, 76, 474–478 CrossRef CAS PubMed.
- R. C. Cretu, D. M. Gligor, L. Muresan, I. C. Popescu and L. M. Muresan, J. Appl. Electrochem., 2006, 36, 1327–1332 CrossRef CAS.
- G. C. Zhao, M. Q. Xu and Q. Zhang, Electrochem. Commun., 2008, 1924–1926 CrossRef CAS PubMed.
- L. Gonzalez-Macia, M. Smyth and A. Killard, Electroanalysis, 2012, 24, 609–614 CrossRef CAS.
- M. Honda, T. Kodera and H. Kita, Electrochim. Acta, 1983, 28, 727–733 CrossRef CAS.
- N. D. Merkulova, G. V. Zhutaeva, N. A. Shumilova and V. S. Bagotskii, Electrochim. Acta, 1973, 18, 169–174 CrossRef CAS.
- G. Flatgen, S. Wasle, M. Lubke, C. Eickes, G. Radhakrishnan, K. Doblhofer and G. Ertl, Electrochim. Acta, 1999, 44, 4499–4506 CrossRef CAS.
- F. W. Campbell, S. R. Belding, R. Baron, L. Xiao and R. G. Compton, J. Phys. Chem. C, 2009, 113, 9053–9062 CAS.
- M. Honda, T. Kodera and H. Kita, Electrochim. Acta, 1986, 31, 377–383 CrossRef CAS.
- K. C. Honeychurch, Adv. Anal. Chem., 2013, 3A, 28–33 Search PubMed.
- H.-Z. Yu, Chem. Commun., 2004, 2633–2636 RSC.
- D. Lowinsohn, E. M. Richter, L. Angnes and M. Bertotti, Electroanalysis, 2006, 18, 89–94 CrossRef CAS.
- E. M. Richter, M. A. Augelli, S. Magarotto and L. Angnes, Electroanalysis, 2001, 13, 760–764 CrossRef CAS.
- L. Angnes, E. M. Richter, M. A. Augelli and G. H. Kume, Anal. Chem., 2000, 72, 5503–5506 CrossRef CAS.
- M.-C. Radulescu and A. F. Danet, Sensors, 2008, 8, 7157–7171 CrossRef CAS.
- D. C. Kirkpatrick, C. Antwi and R. S. Martin, Anal. Methods, 2010, 2, 811–816 RSC.
- E. M. Richter, M. A. Augelli, G. H. Kume, R. N. Mioshi and L. Angnes, Fresenius' J. Anal. Chem., 2000, 366, 444–448 CrossRef CAS.
- Y. Wenn, A.-J. Lin, H.-F. Chen, Y.-Z. Jiao and H.-F. Yang, Biosens. Bioelectron., 2013, 41, 857–861 CrossRef PubMed.
- W. Lian, L. Wang, Y. Song, H. Yuan, S. Zhao, P. Li and L. Chen, Electrochim. Acta, 2009, 54, 4334–4339 CrossRef CAS PubMed.
- E. Ferapontova and L. Gorton, Electroanalysis, 2003, 15, 484–491 CrossRef CAS.
- B. Liu and M. Wang, Int. J. Electrochem. Sci., 2013, 8, 8572–8578 CAS.
- A. M. Golsheikh, N. M. Huang, H. N. Lim, R. Zakaria and C.-Y. Yin, Carbon, 2013, 62, 405–412 CrossRef PubMed.
- C. M. Welch, C. E. Banks, A. O. Simm and R. G. Compton, Anal. Bioanal. Chem., 2005, 382, 12–21 CrossRef CAS PubMed.
- A. Balamurugan and S.-M. Chen, Electroanalysis, 2009, 21, 1419–1423 CrossRef CAS.
- S. Mao, Y. Long, W. Lia, Y. Tu and A. Deng, Biosens. Bioelectron., 2013, 48, 258–262 CrossRef CAS PubMed.
- A. Afraz, A. A. Rafati and A. Hajian, J. Solid State Electrochem., 2013, 17, 2017–2025 CrossRef CAS PubMed.
- K. Liao, P. Mao, Y. Li, Y. Nan, F. Song, G. Wang and M. Han, Sens. Actuators, B, 2013, 181, 125–129 CrossRef CAS PubMed.
- M. Vinoba, S. Kwan Jeong, M. Bhagiyalakshmi and M. Alagar, Bull. Korean Chem. Soc., 2010, 31, 3668–3674 CrossRef CAS.
- E. Kurowska, A. Brzozka, M. Jarosz, G. D. Sulka and M. Jaskula, Electrochim. Acta, 2013, 104, 439–447 CrossRef CAS PubMed.
-
F. R. Byers, Care and Handling of CDs and DVDs, A Guide for Librarians and Archivists, Council on Library and Information Resources, Washington, DC, October 2003, http://www.clir.org/pubs/reports/pub121/pub121.pdf, accessed 12/2/13 Search PubMed.
-
R. G. Compton and C. E. Banks, Understanding Voltammetry, Imperial College Press, 2nd edn, 2011, p. 400 Search PubMed.
|
| This journal is © The Royal Society of Chemistry 2013 |
Click here to see how this site uses Cookies. View our privacy policy here.  Open Access Article


