DOI:
10.1039/C2AY25904D
(Technical Note)
Anal. Methods, 2013,
5, 285-290
Fabricating three-dimensional hydrogel oligonucleotide microarrays to detect single nucleotide polymorphisms†
Received
14th August 2012
, Accepted 1st October 2012
First published on 2nd October 2012
Abstract
Here, a three-dimensional (3D) oligonucleotide microarray-based fluorescent assay has been developed for single nucleotide polymorphisms (SNPs) and allele frequency determination. The 3D oligonucleotide microarray is fabricated on a home-made polyacrylamide hydrogel microarray which is generated by UV light photopolymerization of tiny acrylamide monomer droplets on a PEG terminated glass slide. After activation by glutaraldehyde (GA), the polyacrylamide hydrogel is able to react with NH2-modified oligonucleotides with high efficiency to generate a high signal-to-background ratio without the conventional blocking step. We demonstrate that the assay is able to detect complimentary 25 mer oligonucleotide target (fragment of a tumor suppressor gene P53) down to 100 pM and SNP with true-to-false ratios (the ratio of fluorescence signal from perfect matched DNA strands to that from the one-base mismatched DNA strands) above 20. Taking advantage of the high specificity of the assay, allele frequency as low as 2% can be accurately determined.
1. Introduction
Single nucleotide polymorphisms (SNPs) are the most frequent variation among individual genomes. SNPs can be used as a fundamental tool for genetic testing, identification of human disease genes, and drug discovery.1–6 SNPs have been analyzed by various methods including gel electrophoresis, fluorescent techniques (e.g., fluorescence resonance energy transfer, FRET) biosensors, and microarray-based assays.5–27 However, SNP-based diagnosis is very labor-intensive and expensive, because a tremendous number of SNP sites must be analyzed for many patients and healthy donors. The oligonucleotide microarray technology is nowadays a relatively mature high throughput analytical method, which has been extensively used to study gene expression, methylation, and protein–DNA interactions, as well as large scale SNPs genotyping.3,5,15 The great advantage of an oligonucleotide microarray is its ability to interrogate hundreds to thousands of different sensing events in one experiment. The vast majority of these studies employed two-dimensional (2D) surfaces, which are not always ideal for oligonucleotide immobilization and hybridization.3,5,15,28–34 To obtain optimal hybridization efficiency, the immobilized oligonucleotides must be sufficiently separated for steric reasons, which decreases the amount of oligonucleotide loadable per unit area. The low loading capacity of oligonucleotide leads to a decreasing in the sensitivities of oligonucleotide microarray-based assays. One strategy to increase the loading capacity is to use three-dimensional (3D) matrixes including planar solid supports with 3D gel (e.g. polyacrylamide gel), or macromolecular (e.g. dendrimers) coatings.35–45 For instance, Mirzabekov and colleagues have developed a gel photopolymerization technique for manufacturing oligonucleotide microarrays by a three-step procedure: fabrication of the gel micromatrix, loading microvolumes of solution onto the micromatrix, and chemical immobilization of a oligonucleotide within chemically activated gel pads.38,46 Comparing with 2D substrates, the 3D hydrogels (activated polyacrylamide gel) have much higher binding capacity which can offer more reactive sites to bind with the targets, resulting in great improvement of the microarray sensitivity. In addition, the 3D hydrogel has a porous structure which creates an environment that simulates a solution phase system, in contrast to the limited binding kinetics of a solid–liquid phase interaction evident on a 2D surface.
Poly(ethylene glycols) (PEGs) have been used as components for fabricating the microarray substrate because PEGs have high biocompatibility and good chemical stability.40,41,47–51 Veiseh et al. have fabricated a protein microarray on PEG-coated silica substrate.49 The PEG-coated silica offers a protein-resistant framework for fabricating the protein pattern. In another study, the 3D protein microarrays have been created on PEG matrixes by Liedberg and colleagues.40,41 By means of microdispensing, different ligands may be immobilized in different PEG spots thereby realizing a very useful microarray chip. These studies show that PEG may be used successfully in the fabrication of microarrays for studying biomolecule interactions.
In this paper, a 3D oligonucleotide microarray has been fabricated on glutaraldehyde (GA) activated polyacrylamide hydrogel spots which are generated by UV light photopolymerization of acrylamide monomers with PEG terminated glass slides. It is possible to use the 3D oligonucleotide microarray as a sensitive platform for SNP detection. Compared with the previous Mirzabekov's approach,40,41 our method employs PEG as crosslinker to link the polyacrylamide hydrogel and glass slide surface, which improves the stability of the polyacrylamide hydrogel spot. Processing the microarray is relatively simple because it circumvents the need for a blocking-step which is usually required for microarray fabrication.
2. Experimental
2.1. Materials and reagents
DNA oligomers (see Table 1 for details) were purchased from Sangon Ltd. (Shanghai, China). Acrylamide (AAm, 40% (w/v) in water) was obtained from Aladdin Co. (Shanghai, China). N,N′-Methylenebisacrylamide solution (bis-acrylamide, 2% (w/v) in H2O), glutaraldehyde solution (GA, 25% (v/v) aqueous solution), and O-[(N-succinimidyl)succinyl-aminoethyl]-O′-methylpolyethylene glycol (NHS-PEG-OCH3, MW 750 Da) were purchased from Sigma-Aldrich Co. (USA). Benzophenone (BP) was supplied by Sinopharm Chemical Reagent Co. (China). Amine modified glass microscope slides and aldehyde modified glass microscope slides (named as 2D slides) were obtained from CapitalBio Ltd. (Beijing, China). Other chemicals were analytical grade. Milli-Q water (18.2 MΩ cm) was used in all the experiments.
Table 1 Sequences used in the experiment
| Name |
Sequence |
| Pm |
5′-AGA GAC TGG CGC TTTTT–NH2-3′ |
| Tw |
5′-GC GCC ![[G with combining low line]](https://www.rsc.org/images/entities/char_0047_0332.gif) GT CTC TCC CAG GAC AGG CA-3′ GT CTC TCC CAG GAC AGG CA-3′ |
| Tm |
5′-GC GCC ![[A with combining low line]](https://www.rsc.org/images/entities/char_0041_0332.gif) GT CTC TCC CAG GAC AGG CA-3′ GT CTC TCC CAG GAC AGG CA-3′ |
| Pf |
5′-CY5-T10 TGC CTG TCC TGG G-3′ |
2.2. Preparation of PEG modified glass slide
The amine modified glass slides were incubated in a solution containing NHS-PEG-OCH3 (1000 μg mL−1 in phosphate buffer (PB, pH 7.4, 27 mM KCl, 14 mM KH2PO4, and 43 mM Na2HPO4) for 2 h at room temperature. The slides were washed with 30 mL of PB (3 times) and 30 mL of Milli-Q water (3 times) to remove excess NHS-PEG-OCH3, and dried by centrifugation (480 g for 1 min), respectively. Then, the glass slides were immersed in the solution containing 100 μg mL−1 benzophenone in ethanol and incubated for 40 min. Subsequently, the slides were dried under vacuum environment for 1 h at 25 °C. Finally, the slides were washed with 30 mL of ethanol (3 times) and 30 mL of water (3 times) to remove unabsorbed benzophenone, respectively. The as-prepared glass slide was named as PEG modified glass slide.
2.3. Fabrication of the 3D slide
The PEG modified glass slides were used to fabricate polyacrylamide hydrogel microarray by a SmartArrayer 48 system (Capitalbio Ltd., China). The gel precursor aqueous solution (5% acrylamide (w/v), 0.12% bis-acrylamide (w/v) and 15% glycerol (v/v) in H2O) was spotted on the PEG modified glass slides by non-contact spraying, and directly irradiated by UV light (λ = 365 nm, light intensity = 4 mW cm−2) for 8 min. After photopolymerization, the unreacted monomer was washed away with 30 mL of PBS buffer (3 times) and 30 mL of water (3 times), respectively. The polyacrylamide hydrogel microarrays were dried under vacuum environment for 12 h at 25 °C. Subsequently, the polyacrylamide hydrogel microarrays were activated by 30 mL of GA solution (5% (v/v) GA in PB) for 48 h, followed by washing with 30 mL of PB buffer (3 times), 30 mL of water (3 times), dried by centrifugation (480 g for 1 min) and stored at 4 °C. The slides with activated polyacrylamide hydrogel microarrays were named as 3D slides.
2.4. Morphology characterization of the 3D slides
The morphology of the polyacrylamide hydrogel spot was characterized by field emitted scanning electron microscope (SEM, XL 30 ESEM FEG, FEI Company, USA), atomic force microscope (AFM, Veeco/Digital Instruments Inc.) operating in tapping mode, and optical microscopy (Zeiss Axio Imager A2m, Carl Zeiss, Germany), respectively. Generally, after polymerization, the slides were washed with 30 mL water for 1 h (3 times), and immersed in water for one day. Subsequently, the slides were transferred to liquid nitrogen and incubated for 30 min. Then, the slides were freeze-dried in a freeze drier (FD-1-50, Boyikang Experimental Instruments Ltd., Beijing, China) for 5 h at −50 °C under vacuum. Finally, the slides were subjected to AFM and SEM characterization. To generate thermal stability, the 3D slide was soaked in hybridization buffer (4× SSC, 0.1% (w/v) SDS) at various temperatures for 10 min.
2.5. Fabrication of 3D oligonucleotide microarrays
To avoid the exchange of different oligonucleotides, the 3D slides were divided into 12 independent subareas by a PTFE masker. The probe oligonucleotide (named as Pm, sequence shown in Table 1) was dissolved in probe buffer (3× SSC, 0.005% (w/v) SDS) at the desired concentration. 25 μL probe oligonucleotide solution was added onto each subarea and incubated for 12 h under 80% humidity at 30 °C. Then, the slides were rinsed with 30 mL of washing buffer (1× SSC, 0.01% (w/v) SDS; 3 times) and 30 mL of water (3 times), respectively. The as-prepared oligonucleotide microarrays were named as 3D oligonucleotide microarrays.
The 3D oligonucleotide microarrays were hybridized with target DNA at the desired concentration in 25 μL hybridization buffer (4× SSC, 0.1% (w/v) SDS) for 25 min at 55 °C. Then, the microarrays were subjected to a series of rinsing steps: (1) 30 mL of hybridization buffer (3 times); (2) 30 mL of washing buffer (3 times); and (3) 30 mL of water (3 times), respectively. The microarrays were dried by centrifugation (480 g for 1 min). Subsequently, the microarrays were labeled by Pf (100 nM in hybridization buffer), washed, and dried as previously described, respectively. Finally, the microarrays were detected by conventional laser confocal fluorescence microarray scanner (Luxscan-10K/A, Capitalbio Ltd., China). The polyacrylamide hydrogel spot without Pm was employed as control sample, which was hybridized, labeled, washed, and dried as previously described.
2.7. Assay for allele frequency
A series of 25 μL mixed solutions of mutant target and wild target with total 12.5 pmol in various ratios (0:100, 2:98, 5:95, 10:90, 20:80, 50:50 and 100:0) were added onto the oligonucleotide microarrays, hybridized, washed, dried and detected as previously described.
2.8. Data analysis
For data analysis, the background originating from the control sample was recorded and subtracted from each image prior to evaluation. The mean value and standard deviation of the signals were determined for the 9 spot replicates per sample from a single binding assay, respectively. The detection limit was determined to be the concentration where signal/standard deviation = 3 was reached. To determine the linear ranges of the curves, the ranges of concentrations that best fitted the linear equation y = mx + b were specified.
3. Results and discussion
3.1. Fabrication and characterization of 3D slide
The strategy of preparing 3D slide is shown in Fig. 1a. In this experiment, a monolayer of PEG was introduced onto the glass slide surface before photopolymerization. Here, the bifunctional NHS-PEG-OCH3 was used because (1) the NHS group of the compound can react efficiently with the NH2 sites on the glass slide surface; (2) the terminal group of the compound, –OCH3, enables to increase the hydrophobicity of the slide surface and also improve the interaction of the photoinitiator (PI), benzophenone with the slide surface;52,53 and (3) the (EG)n group acts as a biomolecule-resistor which circumvents the need for blocking-step usually required for microarray-base assays. Before delivering monomers, acrylamide and bis-acrylamide, to the slide surface, the PEG modified glass slide was preincubated with benzophenone. In this case, benzophenone can be retained in the hydrophobic PEG monolayer. Therefore, photopolymerization can be initiated from the inner of PEG monolayer upon UV irradiation. This is a good strategy for fabrication of the hydrogel spots on slide surface because the PEG molecules act as crosslinkers between the glass slide surface and the polyacrylamide hydrogel, leading to improved stability of polyacrylamide hydrogel spots on the slide surface in follow-up reactions (see ESI Fig. S1†). After benzophenone adsorption, the monomer solution was transferred to the PEG modified slide surface by non-contact spraying. The polyacrylamide hydrogel microarrays were obtained by photopolymerization of acrylamide and bis-acrylamide droplets under UV light irradiation. Subsequently, the polyacrylamide hydrogel was activated by GA, a homobifunctional reagent.54 This procedure leads to the formation of an outer layer of aldehyde group on polyacrylamide hydrogel, which can be used directly for covalent immobilization of amino-modified oligonucleotide. The morphology of polyacrylamide hydrogel microarray has been characterized by conventional optical microscope, AFM and SEM (as shown in Fig. 2). The polyacrylamide hydrogel spot was about 500 μm in diameter (Fig. 2a). The high density pores can be clearly observed by AFM and SEM which demonstrate the formation of porous polyacrylamide hydrogel (as shown in Fig. 2b and c). The porous structures enable the reaction capability of the 3D slide to be significantly increased.
 |
| | Fig. 1 Schematic representations of the fabrication procedure of the 3D slide (a) and 3D microarray-based fluorescent assay (b). | |
 |
| | Fig. 2 Microscopic characterizations of as-prepared polyacrylamide hydrogel microarrays. Digital image of one spot of the microarray by conventional optical microscope (a) and topography of the spot by AFM (b) and SEM (c). | |
In order to test the thermal stability, the as-prepared 3D slides were treated with hot hybridization buffer since the hybridization of DNAs is normally carried out under high temperature. The morphologies of polyacrylamide hydrogel spots remain unchanged when the temperature of the buffer is lower than 80 °C (as shown in Fig. 3 and ESI Fig. S2†). The experimental result indicates that the 3D slides have good thermal stability.
 |
| | Fig. 3 Digital images of polyacrylamide hydrogel spots in hybridization buffer at various temperatures. | |
3.2. 3D oligonucleotide microarray fabrication and SNP detection
The schematic representation of development of the oligonucleotide 3D microarray-based assay is shown in Fig. 1b. The amino-modified oligonucleotide probe (Pm) was immobilized on the 3D slide surface by a Schiff base linkage. After hybridization of the Pm by targets, Cy5 modified oligonucleotides (Pf) were used to label the hybridization events. In order to prove the ability of the 3D for SNP detection, part of the p53 exon 8 gene, 25-mer oligonucleotide, was employed as target. The DNA fragment contains a polymorphic site (Arg282Trp), where the nucleotide G in a wild type is replaced by A in a mutant.7,8 The Pm is complementary to the mutant-type target (Tm) sequence and is not complementary to the wild-type target (Tw) sequence. As shown in Fig. 4, efficient hybridization is only observed between Pm and Tm. After subtracting the fluorescence signal of control sample, the fluorescence signal from perfect matched DNA strands (Tm and Pm) was 20 times higher than that of the one-base mismatched DNA strands (Tw and Pm). The true-to-false ratio of the 3D oligonucleotide microarray-based assay is better than the previously reported values.55–58 This experimental result demonstrates that the 3D oligonucleotide microarray-based assay has good selectivity for the SNP detection. In addition, different DNA probes may be immobilized in different spots by means of microdispensing thereby realizing high throughput analysis of SNPs because the surround of spot is inert.
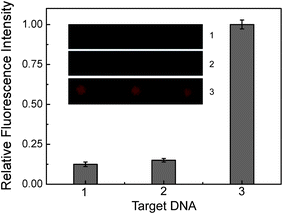 |
| | Fig. 4 Fluorescence images (1, control sample; 2, Pm hybridized with Tw; and 3, Pm hybridized with Tm) and the corresponding analysis for discrimination of SNPs. The concentration of Pm is 5 μM in probe solution, the concentration of Tm or Tw is 500 nM and the concentration of Pf is 100 nM, respectively. | |
The detection limit of the method has also been determined. As shown in Fig. 5, the Tm can be detected as low as 100 pM with 4 orders of magnitude dynamic range (1 to 10![[thin space (1/6-em)]](https://www.rsc.org/images/entities/char_2009.gif) 000 nM) by the 3D microarray-based fluorescence assay. The results (detection limit and dynamic range) are competitive with the best prior values reported previously in DNA microarray technology as recorded for cyanine dye-based or fluorescent nanoparticle-based DNA microarray.56,59–61 In addition, the 2D technique† for detecting the same target under the same conditions has a detection limit of 10 nM (see ESI Fig. S3 and S4†). The slope of the calibration line of the 3D microarray is 1.48 times higher than that of the 2D microarray. This experimental result suggests that the sensitivity of the 3D microarray-based fluorescence assay is better than that of the 2D microarray-based fluorescence assay.
000 nM) by the 3D microarray-based fluorescence assay. The results (detection limit and dynamic range) are competitive with the best prior values reported previously in DNA microarray technology as recorded for cyanine dye-based or fluorescent nanoparticle-based DNA microarray.56,59–61 In addition, the 2D technique† for detecting the same target under the same conditions has a detection limit of 10 nM (see ESI Fig. S3 and S4†). The slope of the calibration line of the 3D microarray is 1.48 times higher than that of the 2D microarray. This experimental result suggests that the sensitivity of the 3D microarray-based fluorescence assay is better than that of the 2D microarray-based fluorescence assay.
 |
| | Fig. 5 Fluorescence images and the corresponding plots of the fluorescence intensities of 3D microarrays as a function of logarithm of Tm concentrations. The concentration of Pm is 5 μM in probe solution, and the concentration of Pf is 100 nM, respectively. | |
3.3. Allele frequency determination
The quantitative determination of the allele frequency has an important significance for the association study between SNPs and diseases. A set of experiments was designed to determine allele frequency by the 3D oligonucleotide microarray-based assay. We investigated the relationship between allele frequency and the relative fluorescence intensity of test sample. The test samples were composed of Tm and Tw mixed at various ratios. The total amount of Tm and Tw was 12.5 pmol. With the mixed targets, the assay could detect mutants with an abundance as low as 2.0% (as shown in Fig. 6). This is almost the same level as that obtained with most reported SNP analysis methods.7,8,58
 |
| | Fig. 6 Fluorescence images and the corresponding plots of the relative fluorescence intensities of 3D microarrays as a function of allele frequencies. The total concentration of mutant and wild-type target is 12.5 pmol in the 25 μL hybridization buffer. The concentration of Pm is 5 μM, and the concentration of Pf is 100 nM, respectively. | |
4. Conclusion
We have generated a very effective and stable chemically activated polyacrylamide hydrogel microarray on a PEG modified glass slide by non-contact spraying. After immobilization of amino-modified oligonucleotide on the polyacrylamide hydrogel, a microarray-based fluorescent assay has been developed for SNP detection and allele frequency determination. As proof-of-principle experiments, the SNP detection and allele frequency analysis of 25-mer oligonucleotide (based on the p53 exon 8 gene) have been carefully studied. The experimental results suggest that our approach could be used as an efficient technique for genetic studies including single-nucleotide polymorphism analysis and low abundance transcripts in cells.
Acknowledgements
The authors would like to thank the NSFC (Grant nos 21075118 and 21127010) and Jilin Provincial Science and Technology Department (Grant no. 20100701) for financial support.
Notes and references
-
R. G. H. Cotton, E. Edkins and S. Forrest, Mutation Detection: A Practical Approach, Oxford University Press, Inc, New York, U.S.A, 1998 Search PubMed.
- The International HapMap Consortium, Nature, 2007, 449, 851–861 CrossRef.
- B. W. Kirk, M. Feinsod, R. Favis, R. M. Kliman and F. Barany, Nucleic Acids Res., 2002, 30, 3295–3311 CrossRef CAS.
- C. Alkan, B. P. Coe and E. E. Eichler, Nat. Rev. Genet., 2011, 12, 363–375 CrossRef CAS.
- A. Simons, B. Sikkema-Raddatz, N. de Leeuw, N. C. Konrad, R. J. Hastings and J. Schoumans, Hum. Mutat., 2012, 33, 941–948 CrossRef CAS.
- F. Erdogan, R. Kirchner, W. Mann, H. H. Ropers and U. A. Nuber, Nucleic Acids Res., 2001, 29, e36 CrossRef CAS.
- Z. P. Li, H. Tsunoda, K. Okano, K. Nagai and H. Kambara, Anal. Chem., 2003, 75, 3345–3351 CrossRef CAS.
- X. R. Duan, Z. P. Li, F. He and S. Wang, J. Am. Chem. Soc., 2007, 129, 4154–4155 CrossRef CAS.
- H. N. Liu, S. Li, L. Tian, L. S. Liu and N. Y. He, J. Nanosci. Nanotechnol., 2010, 10, 5311–5315 CrossRef CAS.
- H. Li, Z. Y. Sun, W. Y. Zhong, N. Hao, D. K. Xu and H. Y. Chen, Anal. Chem., 2010, 82, 5477–5483 CrossRef CAS.
- M. Mokry, H. Feitsma, I. J. Nijman, E. de Bruijn, P. J. van der Zaag, V. Guryev and E. Cuppen, Nucleic Acids Res., 2010, 38, e116 CrossRef.
- G. Y. Lan, W. Y. Chen and H. T. Chang, Biosens. Bioelectron., 2011, 26, 2431–2435 CrossRef CAS.
- S. Li, H. N. Liu, L. S. Liu, L. Tian and N. Y. He, Anal. Biochem., 2010, 405, 141–143 CrossRef CAS.
- W. R. Algar and U. J. Krull, Langmuir, 2010, 26, 6041–6047 CrossRef CAS.
- E. Ozkumur, S. Ahn, A. Yalcin, C. A. Lopez, E. Cevik, R. J. Irani, C. DeLisi, M. Chiari and M. S. Unlu, Biosens. Bioelectron., 2010, 25, 1789–1795 CrossRef.
- J. H. Oh and J. S. Lee, Anal. Chem., 2011, 83, 7364–7370 CrossRef CAS.
- J. A. Hu and C. Y. Zhang, Anal. Chem., 2010, 82, 8991–8997 CrossRef CAS.
- A. J. Qavi, T. M. Mysz and R. C. Bailey, Anal. Chem., 2011, 83, 6827–6833 CrossRef CAS.
- H. Zhou, J. Liu, J. J. Xu and H. Y. Chen, Anal. Chem., 2011, 83, 8320–8328 CrossRef CAS.
- A. Bromberg, E. C. Jensen, J. Kim, Y. K. Jung and R. A. Mathies, Anal. Chem., 2012, 84, 963–970 CrossRef CAS.
- G. C. Le Goff, L. J. Blum and C. A. Marquette, Anal. Chem., 2011, 83, 3610–3615 CrossRef CAS.
- Y. Q. Cheng, Q. Du, L. Y. Wang, H. L. Jia and Z. P. Li, Anal. Chem., 2012, 84, 3739–3744 CrossRef CAS.
- Y. Xiang and Y. Lu, Anal. Chem., 2012, 84, 1975–1980 CrossRef CAS.
- J. Y. Choi, Y. T. Kim, J. Ahn, K. S. Kim, D. G. Gweon and T. S. Seo, Biosens. Bioelectron., 2012, 35, 327–334 CrossRef CAS.
- K. Guo, X. Li and H. B. Kraatz, Biosens. Bioelectron., 2011, 27, 187–191 CrossRef CAS.
- M. E. Ostergaard, P. Cheguru, M. R. Papasani, R. A. Hill and P. J. Hrdlicka, J. Am. Chem. Soc., 2010, 132, 14221–14228 CrossRef CAS.
- D. Koirala, Z. B. Yu, S. Dhakal and H. B. Mao, J. Am. Chem. Soc., 2011, 133, 9988–9991 CrossRef CAS.
- H. Matsuzaki, H. Loi, S. Dong, Y. Y. Tsai, J. Fang, J. Law, X. J. Di, W. M. Liu, G. Yang, G. Y. Liu, J. Huang, G. C. Kennedy, T. B. Ryder, G. A. Marcus, P. S. Walsh, M. D. Shriver, J. M. Puck, K. W. Jones and R. Mei, Genome Res., 2004, 14, 414–425 CrossRef CAS.
- M. Schena, D. Shalon, R. W. Davis and P. O. Brown, Science, 1995, 270, 467–470 CAS.
- A. Sassolas, B. D. Leca-Bouvier and L. J. Blum, Chem. Rev., 2008, 108, 109–139 CrossRef CAS.
- N. V. Dharia, A. T. Bright, S. J. Westenberger, S. W. Barnes, S. Batalov, K. Kuhen, R. Borboa, G. C. Federe, C. M. McClean, J. M. Vinetz, V. Neyra, A. Llanos-Cuentas, J. W. Barnwell, J. R. Walker and E. A. Winzeler, Proc. Natl. Acad. Sci. U. S. A., 2010, 107, 20045–20050 CrossRef CAS.
- B. Pignataro and G. Arrabito, Anal. Chem., 2012, 84, 5450–5462 CrossRef.
- M. C. Pirrung, Angew. Chem., Int. Ed., 2002, 41, 1277–1289 CrossRef.
- A. del Campo and I. J. Bruce, Top. Curr. Chem., 2005, 260, 77–111 CrossRef CAS.
- E. Fahy, G. R. Davis, L. J. Dimichele and S. S. Ghosh, Nucleic Acids Res., 1993, 21, 1819–1826 CrossRef CAS.
- V. Afanassiev, V. Hanemann and S. Wolfl, Nucleic Acids Res., 2000, 28, e66 CrossRef CAS.
- A. Y. Rubina, E. I. Dementieva, A. A. Stomakhin, E. L. Darii, S. V. Pan'kov, V. E. Barsky, S. M. Ivanov, E. V. Konovalova and A. D. Mirzabekov, BioTechniques, 2003, 34, 1008–1022 CAS.
- D. Guschin, G. Yershov, A. Zaslavsky, A. Gemmell, V. Shick, D. Proudnikov, P. Arenkov and A. Mirzabekov, Anal. Biochem., 1997, 250, 203–211 CrossRef CAS.
- P. T. Charles, E. R. Goldman, J. G. Rangasammy, C. L. Schauer, M. S. Chen and C. R. Taitt, Biosens. Bioelectron., 2004, 20, 753–764 CrossRef CAS.
- A. Larsson, C. X. Du and B. Liedberg, Biomacromolecules, 2007, 8, 3511–3518 CrossRef CAS.
- O. Andersson, A. Larsson, T. Ekblad and B. Liedberg, Biomacromolecules, 2009, 10, 142–148 CrossRef CAS.
- M. Beier and J. D. Hoheisel, Nucleic Acids Res., 1999, 27, 1970–1977 CrossRef CAS.
- R. Benters, C. M. Niemeyer, D. Drutschmann, D. Blohm and D. Wohrle, Nucleic Acids Res., 2002, 30, e10 CrossRef.
- V. Le Berre, E. Trevisiol, A. Dagkessamanskaia, S. Sokol, A. M. Caminade, J. P. Majoral, B. Meunier and J. Francois, Nucleic Acids Res., 2003, 31, e88 CrossRef.
- X. M. Li, J. Q. Gao, D. J. Liu and Z. X. Wang, Anal. Methods, 2010, 2, 1008–1012 RSC.
- D. Y. Guschin, B. K. Mobarry, D. Proudnikov, D. A. Stahl, B. E. Rittmann and A. D. Mirzabekov, Appl. Environ. Microbiol., 1997, 63, 2397–2402 CAS.
- R. G. Chapman, E. Ostuni, S. Takayama, R. E. Holmlin, L. Yan and G. M. Whitesides, J. Am. Chem. Soc., 2000, 122, 8303–8304 CrossRef CAS.
- S. R. Benhabbour, H. Sheardown and A. Adronov, Macromolecules, 2008, 41, 4817–4823 CrossRef CAS.
- M. Veiseh, M. H. Zareie and M. Q. Zhang, Langmuir, 2002, 18, 6671–6678 CrossRef CAS.
- G. J. Wegner, A. W. Wark, H. J. Lee, E. Codner, T. Saeki, S. P. Fang and R. M. Corn, Anal. Chem., 2004, 76, 5677–5684 CrossRef CAS.
- A. G. Lee, C. P. Arena, D. J. Beebe and S. P. Palecek, Biomacromolecules, 2010, 11, 3316–3324 CrossRef CAS.
- S. W. Hu, X. Q. Ren, M. Bachman, C. E. Sims, G. P. Li and N. L. Allbritton, Anal. Chem., 2004, 76, 1865–1870 CrossRef CAS.
- W. C. Sung, H. H. Chen, H. Makamba and S. H. Chen, Anal. Chem., 2009, 81, 7967–7973 CrossRef CAS.
- P. Arenkov, A. Kukhtin, A. Gemmell, S. Voloshchuk, V. Chupeeva and A. Mirzabekov, Anal. Biochem., 2000, 278, 123–131 CrossRef CAS.
- A. Relogio, C. Schwager, A. Richter, W. Ansorge and J. Valcarcel, Nucleic Acids Res., 2002, 30, e51 CrossRef.
- X. C. Zhou and J. Z. Zhou, Anal. Chem., 2004, 76, 5302–5312 CrossRef CAS.
- S. J. Oh, J. M. Ju, B. C. Kim, E. Ko, B. J. Hong, J. G. Park, J. W. Park and K. Y. Choi, Nucleic Acids Res., 2005, 33, e90 CrossRef.
- H. Schulze, T. Barl, H. Vase, S. Baier, P. Thomas, G. Giraud, J. Crain and T. T. Bachmann, Anal. Chem., 2012, 84, 5080–5084 CrossRef CAS.
- R. J. Lipshutz, S. P. A. Fodor, T. R. Gingeras and D. J. Lockhart, Nat. Genet., 1999, 21, 20–24 CrossRef CAS.
- S. P. A. Fodor, Science, 1997, 277, 393–395 CrossRef CAS.
- D. Gerion, F. Q. Chen, B. Kannan, A. H. Fu, W. J. Parak, D. J. Chen, A. Majumdar and A. P. Alivisatos, Anal. Chem., 2003, 75, 4766–4772 CrossRef CAS.
Footnote |
| † Electronic supplementary information (ESI) available. See DOI: 10.1039/c2ay25904d |
|
| This journal is © The Royal Society of Chemistry 2013 |
Click here to see how this site uses Cookies. View our privacy policy here.