 Open Access Article
Creative Commons Attribution 3.0 Unported Licence
Optimization of Fe3O4@Ag nanoshells in magnetic field-enriched surface-enhanced resonance Raman scattering for malaria diagnosis
Clement
Yuen
and
Quan
Liu
*
Division of Bioengineering, School of Chemical and Biomedical Engineering, College of Engineering, Nanyang Technological University, 70 Nanyang Drive, Singapore 637457. E-mail: quanliu@ntu.edu.sg; Fax: +65 6791 1761; Tel: +65 6316 8748
First published on 21st August 2013
Abstract
The great potential of magnetic field enriched surface enhanced resonance Raman spectroscopy (SERRS) for early malaria diagnosis has been demonstrated previously. This technique is able to detect β-hematin, which is equivalent to a malaria biomarker (hemozoin) in Raman features, at a concentration of 5 nM. In this study, we present the optimization of nanoparticles used in the magnetic field enriched SERRS by tuning the core size and shell thickness of nanoparticles with an iron oxide core and a silver shell (Fe3O4@Ag). The discrete dipole approximation (DDA) model was introduced to investigate the localized electromagnetic field distributions and extinction efficiencies of the aggregate of Fe3O4@Ag and β-hematin, in correlation with their magnetic field enriched SERRS performance. We find that the optimal core–shell size of Fe3O4@Ag leading to the effective aggregation of Fe3O4@Ag and β-hematin under an external magnetic field with superior extinction efficiencies is the key to realize highly augmented Raman signals in this strategy. Furthermore, it is noted that the optimized result differs from the case without the external magnetic field to that with the external magnetic field. Therefore, this work demonstrates experimentally and theoretically the potential of tuning the core–shell Fe3O4@Ag for achieving the efficient magnetic field-enriched SERRS detection of β-hematin for early malaria diagnosis.
Introduction
Hemozoin is a unique biomarker in human malaria disease with isostructural and paramagnetic properties similar to those of the chemically fabricated β-hematin.1–3 The detection of these crystals (hemozoin or β-hematin) has been demonstrated by Raman spectroscopy and its variations (e.g. resonance Raman, surface enhanced Raman, and tip-enhanced Raman spectroscopy).4–7 These techniques have the advantages of fast data acquisition, minimal need for labor, and minimal requirement of skilled workers, in comparison to the microscopic examination of a blood smear that is the “gold standard” of malaria diagnosis.8Recently, our group has demonstrated magnetic field-enriched surface-enhanced resonance Raman spectroscopy (SERRS) for the sensitive detection of β-hematin by using nanoshells with an iron oxide core and a silver shell, i.e. Fe3O4@Ag. Our result shows that the detection limit of this technique in terms of the parasitemia level is comparable to that in early malaria infection at the ring stage, which suggests the great potential of this technique for early malaria diagnosis.8 The unique feature in this technique is that resonance Raman,9 surface enhanced Raman,6 and the magnetic field enrichment10 effects are integrated to give further augmentation of the Raman signal, which allows more sensitive β-hematin detection (at a concentration of 5 nM) than each of these aforesaid techniques alone.8
Although the optimizations of core and shell size-correlated plasmonic properties (e.g. Raman performance, extinction, and electromagnetic field distributions) for similar plasmonic structures have been studied in other experiments without an external magnetic field,11 these core and shell-related properties could be modified due to nanoparticle aggregation induced by the external magnetic field. Moreover, β-hematin crystals, which are the target analyte generating Raman signals for enhancement, possess an elongated shape, a large size and paramagnetic properties compared to those commonly studied molecules such as Rhodamine 6G (R6G). These factors determine that the optimization of nanoshells for the enhancement of β-hematin Raman signals would be different from other common Raman molecules. In this study, we explore the variation in the core diameter and shell thickness of Fe3O4@Ag in relation to the magnetic field-enriched SERRS of paramagnetic β-hematin crystals to maximize Raman signal enhancement.
In this paper, we present the trends in the magnetic field-enriched SERRS performance of β-hematin as a function of the core and shell size of Fe3O4@Ag nanoshells in comparison to that without the magnetic field enrichment strategy. The discrete-dipole approximation (DDA) method,12 which is flexible in handling irregular geometries,13 is exploited to evaluate the performance of Fe3O4@Ag with different core–shell sizes in the magnetic field-enriched SERRS technique. The aggregation of nanoshells due to the external magnetic field for a range of core and shell sizes during SERRS measurement is also discussed.
Methods and materials
Fabrication of core–shell Fe3O4@Ag nanoparticles
The Fe3O4 nanoparticles were fabricated by a coprecipitation technique.14 0.168 M of FeCl2·4H2O (Alfa Aesar, USA) and 0.333 M of FeCl3·6H2O (Alfa Aesar, USA) were prepared and dissolved in deionized water, prior to the introduction of 4 M NaOH (Sigma-Aldrich, USA) drop-wise to the mixture at 60 °C under vigorous mixing (15k rpm, SilentCrusherM, Heidolph, Germany). To synthesize Fe3O4 with three different radii, the addition of NaOH was stopped at pH values of 11, 13, and 14, respectively, and the mixture was heated subsequently at 70 °C for another 1 hour and cooled to room temperature under stirring, followed by separation using a magnet and then washing with deionized water. 16.2 mM of the fabricated Fe3O4 nanoparticles in 20 ml of ethanol was surface grafted with 0.15 g of polyacrylic acid (Sigma-Aldrich, USA) in 80 ml of ethanol, prior to sonication (Elma E30H, Elma, Switzerland) for 15 min. Fe3O4 was separated with a magnet, followed by washing with ethanol. About 2.1 mM of Fe3O4 were re-dispersed in ethanol and deionized water (80.6![[thin space (1/6-em)]](https://www.rsc.org/images/entities/char_2009.gif) :
:![[thin space (1/6-em)]](https://www.rsc.org/images/entities/char_2009.gif) 19.4% v/v) for Ag shell synthesis.
19.4% v/v) for Ag shell synthesis.
The Ag shells were coated by using the seed-growth reduction method.8,15 The number of Fe3O4 nanoparticles used, which was estimated by considering the weight and the size of these Fe3O4 nanoparticles, was kept identical in each of the following sets. For each size of Fe3O4, we coated the Ag shell with three different thicknesses by introducing the following mixtures drop-wise to the aforesaid Fe3O4 suspension in an ultrasonic bath.
Set 1. AgNO3 (2.8 mM, Merck, USA) was added and mixed for 30 min, prior to introduction of hydroxylamine hydrochloride (4.1 mM, MP biomedical, USA), NaOH (8.1 mM), in Triton X-100 (Bio-Rad laboratories, USA), ethanol, and deionized water (0.9![[thin space (1/6-em)]](https://www.rsc.org/images/entities/char_2009.gif) :
:![[thin space (1/6-em)]](https://www.rsc.org/images/entities/char_2009.gif) 70.8
70.8![[thin space (1/6-em)]](https://www.rsc.org/images/entities/char_2009.gif) :
:![[thin space (1/6-em)]](https://www.rsc.org/images/entities/char_2009.gif) 28.3% v/v/v);
28.3% v/v/v);
Set 2. The chemicals and their concentrations added were the same as the previous set prior to the introduction of AgNO3 (9.7 mM) in Triton X-100, ethanol, and deionized water (2![[thin space (1/6-em)]](https://www.rsc.org/images/entities/char_2009.gif) :
:![[thin space (1/6-em)]](https://www.rsc.org/images/entities/char_2009.gif) 65.3
65.3![[thin space (1/6-em)]](https://www.rsc.org/images/entities/char_2009.gif) :
:![[thin space (1/6-em)]](https://www.rsc.org/images/entities/char_2009.gif) 32.7% v/v/v).
32.7% v/v/v).
Set 3. The same procedure as stated in set 2, except that 19.4 mM instead of 9.7 mM of AgNO3 was used during the second-time addition of AgNO3.
Set 4. Additional AgNO3 (9.7 mM) was mixed into set 3, prior to the introduction of Triton X-100, ethanol, and deionized water (2![[thin space (1/6-em)]](https://www.rsc.org/images/entities/char_2009.gif) :
:![[thin space (1/6-em)]](https://www.rsc.org/images/entities/char_2009.gif) 65.3
65.3![[thin space (1/6-em)]](https://www.rsc.org/images/entities/char_2009.gif) :
:![[thin space (1/6-em)]](https://www.rsc.org/images/entities/char_2009.gif) 32.7% v/v/v).
32.7% v/v/v).
Finally, mixtures in these sets were washed and a magnet was used to separate the Fe3O4@Ag nanoparticles. The final nanoparticles were obtained by filtering (0.2 μm supor syringe filters, Pall, USA) a suspension of the Fe3O4@Ag nanoparticles in 15 ml of methanol.
Raman measurements of analytes
The preparation of analytes [Rhodamine 6G (R6G) and β-hematin], the setup for magnetic field-enriched SERRS, and Raman instrumentation were the same as reported in the previous publication.8 Briefly, for the SERS measurements of R6G (Sigma-Aldrich, USA), aqueous R6G at concentrations ranging from 10−6 to 10−9 M was adsorbed onto Fe3O4@Ag nanoshells. In the sample preparation for the SERRS evaluation of β-hematin with and without magnetic field enrichment, β-hematin crystals were fabricated by using the same acid-catalyzed method as discussed,8 at concentrations ranging from 10−3 to 10−7 M were mixed with an equal volume of Fe3O4@Ag nanoshells suspension of 0.33 ml and the number of nanoshells was about 5 × 10¹¹. These analytes were transferred to a small vial made of aluminum foil for SERS measurements with the bottom of the vial being exposed to a magnetic field of 0.198 T and a magnetic field gradient of 26.6 T m−1. These samples were excited by a 633 nm laser (Renishaw, UK) with an excitation power of 0.1 mW that was focused through a microscope objective (20×, NA = 0.4, Leica) to a spot about 3 μm in diameter. The emitted Raman signals were fed into a Czerny–Turner type spectrograph (f = 250 mm) and a holographic grating (1800 g mm−1) dispersed the incoming signal into a RemCam CCD detector (inVia, Renishaw, UK) with a spectral resolution of 2 cm−1. All spectra were acquired with an integration time of 15 s and averaged from more than five different samples, in which the typical standard deviation of the signal intensity is smaller than 5% for R6G and smaller than 10% for β-hematin. These raw data were corrected for the baseline level, then smoothed by averaging over a window of five points, and processed for removing the fluorescence background to yield the final spectra.Discrete-dipole approximation (DDA) model
The discrete-dipole approximation (DDA) model12,16 was used to calculate the extinction efficiency (Qext) of Fe3O4@Ag nanoparticles with different core and shell dimensions under the excitation wavelength of 633 nm. Qext was calculated for comparison with the experimental SERS performance of these nanoparticles, since Qext and SERS signals are closely related to the induced electromagnetic field (Eind).12,13Qext is related to the induced electromagnetic field by the imaginary (Im) part in the equation,12 | (1) |
Results
Fig. 1 shows the field emission scanning electronic microscopy (FESEM, JEOL JSM-6700F, JEOL, Japan) images of the fabricated Fe3O4@Ag nanoparticles. These Fe3O4 nanoparticles show radii of (a) 10, (b) 25, and (c) 40 nm serving as the cores of nanoshells. The cores with a radius of 10 nm were coated with 10, 30, 40, and 50 nm thick Ag [Fig. 1(a)]. The cores with a radius of 25 nm were coated with 10, 25, 45 and 60 nm thick Ag [Fig. 1(b)]. The cores with a radius of 40 nm were coated with 10, 40, 50 and 60 nm thick Ag [Fig. 1(c)]. The total size typically had a range of less than ±30 nm according to zetasizer measurements. The compositions of nanoshells were confirmed by taking energy-dispersive X-ray graphs, which show Fe, O, and Ag peaks originated from the Fe3O4 core and Ag shell (result not shown).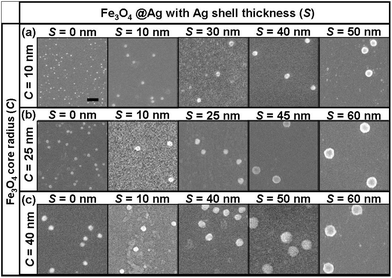 | ||
| Fig. 1 FESEM images of Fe3O4@Ag nanoparticles with different Fe3O4 core radii (C) and Ag shell thicknesses (S). (a) Raw 10 nm Fe3O4 nanoparticles and Fe3O4@Ag with Ag thicknesses of 10, 30, 40 and 50 nm. (b) Raw 25 nm Fe3O4 nanoparticles and Fe3O4@Ag with Ag thicknesses of 10, 25, 45 and 60 nm. (c) Raw 40 nm Fe3O4 nanoparticles and Fe3O4@Ag with Ag thicknesses of 10, 40, 50 and 60 nm. The scale bar indicates a length of 200 nm and is shared by all figures. | ||
Fig. 2(a) shows the SERS spectra of aqueous R6G at a concentration of 1 μM adsorbed on these Fe3O4@Ag nanoparticles whose SEM images are shown in Fig. 1 and Fig. 2(b) plots the corresponding R6G Raman peak intensities at 1508 cm−1 (aromatic C–C stretching). R6G adsorbed on these nanoparticles provides different Raman enhancements [Fig. 2(a)], which are revealed by the Raman intensities of prominent peak locations at about 615 cm−1 (C–C–C ring in-plane bending), 775 cm−1 (CH out-of-plane bending), 1310 cm−1 and 1365 cm−1 (C–C/C–N stretching), and 1508 cm−1 (aromatic C–C stretching).8 For the shell dimensions C40S60, C40S50, C40S40, C40S10, C25S60, C25S45, C25S25, C25S10, C10S50, C10S40, and C10S30, in which the first number indicates the Fe3O4 core radius and the second number gives the shell thickness, the signal enhancement is roughly 36.0, 26.4, 6.2, 1.6, 23.9, 7.8, 3.9, 1.3, 4.7, 4.3, and 2.2 times higher than that observed for C10S10. These SERS intensities are linearly proportional to the R6G concentrations adsorbed on the Fe3O4@Ag with different core and shell sizes [Fig. 2(b)], which are typical13 in SERS measurement. The general trend is that a larger Fe3O4 core and a thicker Ag shell yield higher Raman signal enhancement, with the highest Raman signal enhancement noted for C40S60. The trend in the enhancement factor with the shell and core dimensions of R6G conforms to the typical variation of the core and shell-related SERS performance.
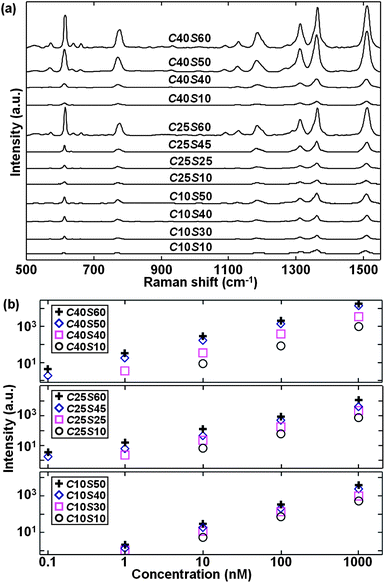 | ||
| Fig. 2 (a) Experimental SERS spectra of R6G solution at concentrations of 10−6 M adsorbed on Fe3O4@Ag nanoparticles with core–shell parameters of C40S60, C40S50, C40S40, C40S10, C25S60, C25S45, C25S25, C25S10, C10S50, C10S40, C10S30, and C10S10. C10S50 means Fe3O4@Ag with a core radius of 10 nm and an outer shell thickness of 50 nm. (b) Raman peak intensities at 1508 cm−1 (aromatic C–C stretching) for R6G solution at concentrations of 10−6, 10−7, 10−8, 10−9 and 10−10 M by using these Fe3O4@Ag nanoparticles. | ||
Fig. 3 compares the different enhancement trends in the representative SERRS spectra of β-hematin (a) without and (b) with the influence of an external magnetic field by using different Fe3O4@Ag nanoparticles. Interestingly, the trend in magnetic field-enriched SERRS performance is no longer a monotonic function of the core size or shell thickness of Fe3O4@Ag nanoparticles, based on intensities corresponding to the most prominent vibrational features of β-hematin, such as ν15 (754 cm−1, D4h notation system for resonance Raman peak studies on myoglobin),21ν22 (1120 cm−1), ν2 (1570 cm−1), or ν10 (1628 cm−1). Note that these SERS spectra of β-hematin are similar to RRS spectra reported5 and the SERS spectra in tip-enhanced Raman measurements of hemozin7 without any influence of the magnetic field. Such a similarity can originate from the fact that the free-carboxylate COOH group in β-hematin, which is supposed to be responsible for the formation of hydrogen bonds in a physisorption process,22 is difficult to attach to the OH-terminated group of Triton X-100 capped Ag surfaces because the hydrogen bond formed between the OH group of Triton X-molecules and water molecules is much stronger23 than that established with a COOH group. In contrast, R6G molecules are allowed to chemisorb with the Triton X-100 molecules24 in close proximity to the Ag shell for giving rise to stronger adsorption. Thus, attachment of Fe3O4@Ag to β-hematin can be enabled by magnetic forces under the influence of a magnetic field instead of weak adsorption. A similar observation, i.e. the weak adsorption of molecules on Ag yields SERRS spectra similar to ordinary Raman spectra, has been reported previously.25 The shell dimension of C25S45 yields the largest SERRS signal among these nanoparticles, which is about 10.3 times higher in Raman intensity than that for C10S10. Therefore, the core and shell size-correlated enhancement trends of Fe3O4@Ag are modified in the magnetic field-enriched SERRS measurement of β-hematin.
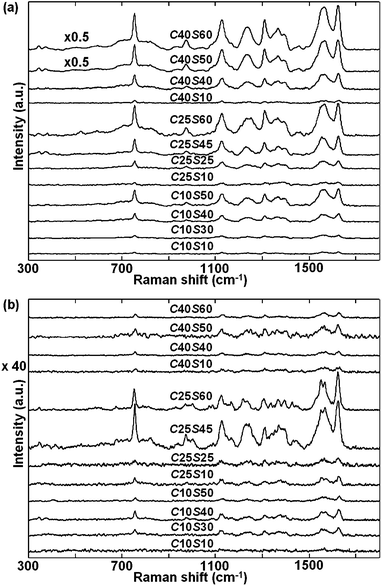 | ||
| Fig. 3 Experimental SERRS spectra of β-hematin at (a) concentration of 0.5 mM without magnetic-field enrichment and (b) concentration of 0.5 μM with magnetic-field enrichment by using Fe3O4@Ag nanoparticles of different core–shell parameters. Some spectra are scaled by the specified magnifying factors to facilitate comparison. | ||
Fig. 4 shows the corresponding β-hematin SERRS intensities at Raman peak ν10 (1628 cm−1) in the case with magnetic-field enrichment in comparison to those without magnetic-field enrichment. The magnetic-field enriched β-hematin SERRS performance is more sensitive and displays the highest SERRS intensities for C25S45 among these nanoparticles [Fig. 4(a)], which is different from the trends observed without magnetic enrichment [Fig. 4(b) and 2] that show a higher SERRS signal for a larger core. Thus, selecting the optimal core–shell dimensions of Fe3O4@Ag can improve the magnetic field-enriched SERRS detection of β-hematin.
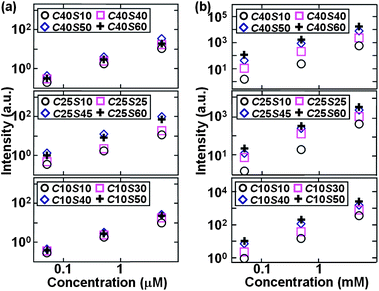 | ||
| Fig. 4 SERRS intensities at Raman peak ν10 (1628 cm−1) for β-hematin at 5 × 10⁻³, 5 × 10⁻⁴, 5 × 10⁻⁵, 5 × 10⁻⁶, 5 × 10⁻⁷, and 5 × 10⁻⁸ M by using Fe3O4@Ag nanoparticles of different core–shell parameters (a) with and (b) without magnetic enrichment. | ||
Discussion
The trend in Raman enhancement with different core–shell dimensions shown above can be explained in terms of the extinction efficiencies and magnetic enrichment effectiveness contributed by these Fe3O4@Ag nanoparticles with different core diameters and shell thicknesses.Higher SERS enhancement resulted in (1) a thicker Ag shell with the same Fe3O4 core size (e.g. C40S10, C40S40, C40S60, and C40S60) or (2) a larger core size with the same shell thickness (e.g. C10S10, C25S10, and C40S10) for the R6G SERS (Fig. 2) and β-hematin SERRS in the case without magnetic enrichment [Fig. 4(b)]. This observation is consistent with the enhancement trends derived from the extinction efficiencies in other types of core–shell nanoparticles reported in the literature.13,26 In contrast, β-hematin SERRS in the case of magnetic-field enrichment [Fig. 3(b) and 4(a)] gives a different trend and an improved sensitivity, in comparison to that without the magnetic field. These findings will be explained as follows.
One factor that may play an important role in the formation of aggregates between Fe3O4@Ag nanoshells and β-hematin as well as among nanoshells could be inter-particle forces. Among these forces, the magnetic dipole–dipole attractive and repulsive force is likely most significant in the presence of a magnetic field due to its much longer effective range than other forces such as steric interaction and electrostatic interaction.27 The magnetic force can bring two or more nanoparticles or β-hematin crystals that are originally out of the critical distance for SERS close enough (<40 nm)8 for effective SERS activities. Fe3O4@Ag nanoshells with a larger Fe3O4 core have a larger magnetic dipole moment than that of a smaller core since the dipole moment is proportional to the cube of the core diameter. As a result, these nanoparticles will form aggregates easily along the direction parallel to the magnetic field resulting in increased Raman activities. In addition, the magnetic force can be increased with a decreasing Ag shell thickness because a large Ag shell could shield the magnetic force. From the point of view of increasing the formation of aggregates, nanoshells with a large Fe3O4 core and a thin Ag shell are desirable, since the magnetic shielding effect should be minimized with a thinner outer Ag shell (similar to other magnetic nanoparticles28 reported in the literature). In our experiment, the shielding effect is nominal for the same diameter iron core with a thicker shell (e.g. C40S10, C40S40, and C40S50 in Fig. 3), which can be attributed to the greater weight that allows faster aggregation settlement at the laser focused spot.
We analyze the electromagnetic field (|E|2) distribution or the extinction efficiency (Qext) enhancement of these nanoparticles without (Fig. 5) and (Fig. 6 and 7) with the improvement influenced by neighboring Fe3O4@Ag based on the DDA method, since Raman intensities are closely related to |E|2 and Qext as discussed. These coexisting phenomena are illustrated separately for the ease of discussion. For the calculation of |E|2 distributions of a β-hematin crystal in contact with Fe3O4@Ag (Fig. 5 and 6), the β-hematin topography is obtained from FESEM [Fig. 5(f)]. A horizontally (Fig. 5 and 6) and vertically (Fig. 6) polarized 633 nm illumination is excited onto each of the investigated volume of 875 nm × 435 nm × 120 nm. The Fe3O4@Ag is modeled as a Fe3O4 spherical core of diameter 50 nm with a constant Ag shell thickness of 25 nm (unless otherwise stated) to show clearly the dependence of |E|2 distribution and Qext on the number of Fe3O4@Ag attached to a β-hematin.
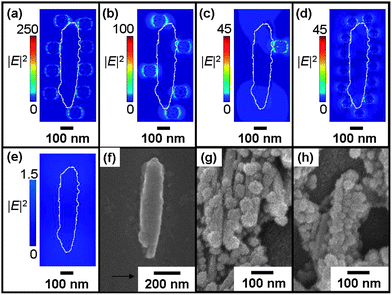 | ||
| Fig. 5 Calculated electromagnetic (|E|2) distributions of (a) 9, (b) 5, (c) 1, Fe3O4@Ag C25S25 and (d) 13 Fe3O4@Ag C20S15, in contact with the β-hematin crystal, in comparison with that (e) without Fe3O4@Ag nanoparticles at 633 nm wavelength excitation polarized along the horizontal axis. (a) is obtained by introducing four nanoparticles to (b) with the positions of the original five nanoparticles unchanged, and (b) is obtained from (c) likewise. Colors in the color bar have been tuned in (e) to avoid misconception that high |E|2 distributions can be achieved without nanoparticles. The white line demarcates the position of a β-hematin crystal. The topography of the β-hematin crystal is obtained from (f) the FESEM image. The FESEM image of Fe3O4@Ag (g) C25S25 and (h) C20S15 with β-hematin in magnetic field-enrichment. | ||
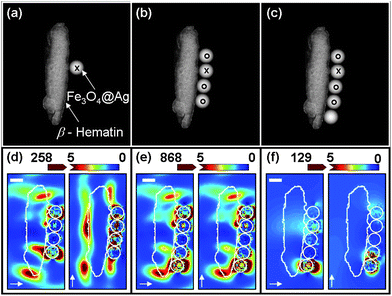 | ||
| Fig. 6 Schematic diagram used in DDA modeling of β-hematin and (a) 1, (b) 4, and (c) 5 Fe3O4@Ag nanoparticles (C25S25) at 633 nm wavelength excitation polarized along the axis as indicated by the arrows. The scale bars represent 100 nm. (d) Ratio of |E|2 distributions obtained by a point by point ratio of |E|2 distributions between (b) to (a); (e) ratio of |E|2 for (c) to (a), and (f) ratio of |E|2 for (c) to (b). The intensity in (d) and (f) is rescaled to saturate at higher values for clear illustration of the enhancement at the interface between Fe3O4@Ag and β-hematin. The white line outlines the nanoparticles and the β-hematin. | ||
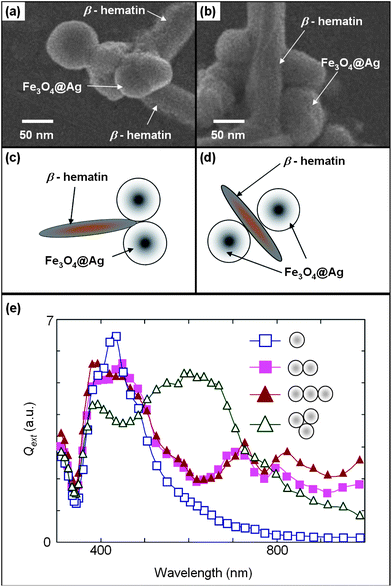 | ||
| Fig. 7 FESEM of Fe3O4@Ag aggregates at (a) the tip of a β-hematin crystal and (b) two sides of a β-hematin crystal, and the corresponding simplified schematic diagrams (c) and (d), respectively. (e) Unpolarized extinction efficiencies of Fe3O4@Ag (C25S25) for different dimers, 3-nanoparticle chain, trimers, and single nanoparticle configurations. | ||
Fig. 5 shows the |E|2 distributions of a β-hematin in contact with Fe3O4@Ag spaced at least a radius from each other, to exclude neighboring Fe3O4@Ag enhancement as shown in our results later. High |E|2 intensities are observed at contacts between β-hematin and Fe3O4@Ag [Fig. 5(a)–(d)], known as “hot spots”, in comparison to the situation without Fe3O4@Ag nanoparticles [Fig. 5(e)]. The number of hot spots increases with the number of nanoparticles attached to β-hematin with Qext of 4.4, 3.4, and 1.81 for these arrangements as shown in Fig. 5(a)–(c), respectively, which is in agreement with our previous published work8 that magnetic enrichment leads to nanoparticle aggregation with better Raman signals. Moreover, we find that smaller Fe3O4@Ag [C20S15 in Fig. 5(d) with Qext of 3.4] allows more of the Fe3O4@Ag to be attached around a β-hematin crystal [Fig. 5(g) and (h)] to create more hot spots. The comparison between Fig. 5(c) and (d) demonstrates that the increase in the number of hot spots in the arrangement C20S15, as shown in Fig. 5(d), could enlarge Qext so that its maximum |E|2 value is comparable to the arrangement of C25S25 in Fig. 5(c), although monomer C20S15 shows a lower Qext than C25S25 theoretically,26 due to a smaller core and a thinner shell.
In contrast, Fig. 6 illustrates the ratio of |E|2 distributions for different configurations of Fe3O4@Ag nanoparticles in contact with β-hematin influenced by the neighboring Fe3O4@Ag on the original nanoparticle. Real nanoparticle arrangements are simplified to spatial arrangement [e.g.Fig. 6(a)–(c)] to study the enhancement of an electromagnetic field on the original Fe3O4@Ag (marked with “×” and “o” at the same position next to the identical β-hematin) due to additional Fe3O4@Ag attached to the β-hematin crystal. We found that additional Fe3O4@Ag nanoparticles [e.g.Fig. 6(a)–(c)] that are in close contact with each other and attached to a β-hematin crystal improve the |E|2 intensity of the original nanoparticle [Fig. 6(d)–(f)]. The |E|2 intensity vicinity between the nanoparticle and β-hematin improves Raman intensity since SERS is approximated to be proportional to |Eind|4, although reduced |E|2 intensity is observed at other locations. These observations imply the same aforesaid point that the magnetic enrichment strategy leads to improved Raman performance for arrangements with more aggregations and smaller Fe3O4@Ag size.
We also account for the enhancement attributed from other Fe3O4@Ag located at the ends and opposite sides along the length [Fig. 7(a) and (b)] of the β-hematin crystal as illustrated in the simplified schematic diagrams in Fig. 7(c) and (d), respectively. Fig. 7(e) presents the extinction efficiency (Qext) for different spatial configurations of Fe3O4@Ag C25S25. At our excitation wavelength of 633 nm, a higher Qext is observed [Fig. 7(e)] for Fe3O4@Ag nanoparticle aggregations [Fig. 7(a) and (c)] that form under an external magnetic field in comparison to single-nanoparticle Qext which is analogous to dispersed nanoparticles without magnetic enrichment [Fig. 7(e), resonance peak at about 420 nm typically observed29 in individual Ag nanoparticles]. Moreover, Fe3O4@Ag positioned on opposite sides of the β-hematin crystal at about 5 to 40 nm apart creates high SERS enhancement, which is analogous to other types of SERS nanoparticles reported25 in the literature. Thus, further Raman enhancement and dissimilar core and shell size-correlated enhancement trends are noted [Fig. 3(b) and 4(a)] for aggregated nanoparticles.
To briefly summarize our investigation to explain the finding that C25S45 yields the largest Raman intensity for β-hematin SERRS, the following factors would play different roles in the determination of Raman intensity from β-hematin SERRS measurements.
1. In the absence of a magnetic field, a larger Fe3O4 core and a larger Ag shell in nanoshells would yield more significant Raman enhancement, which is evident from Fig. 2, 3(a) and 4(b).
2. When an external magnetic field is present, the magnetic attractive force would significantly increase the chance of forming the aggregates of β-hematin and nanoshells according to the SEM image shown in Fig. 5 and 6 and our previous publication.8 This observation could result in two opposing trends.
(a) From the point of view of increasing the formation of aggregates, nanoshells with a large Fe3O4 core and a thin Ag shell are desirable according to the discussion earlier about the magnetic force.
(b) However, nanoshells with a smaller size are more likely to create more hot spots around the β-hematin crystal (Fig. 5) and have much improved extinction (Fig. 6), which would result in higher Raman enhancement.
Thus, the evaluation of the above factors and calculated results (e.g. |E|2 distributions and Qext) for the different core and shell dimensions allows tuning of the magnetic field-enriched SERRS, causing C25S45 to give optimal SERRS performance instead of C40S50 in the case of magnetic enrichment. This study provides more insight into SERS performance under an external field for the paramagnetic test molecules and ferromagnetic SERS-active metal nanoshells, which would be otherwise difficult to predict based on the commonly used DDA model alone, since the forecast of the geographical distributions for these molecules and nanoparticles is unknown. The theoretical predictions presented in this work are in agreement with the experimental results (Fig. 3 and 4), which enable the nanoshell C25S45 to achieve a β-hematin detection limit of 5 nM (equivalent to detection of 30 parasites per μl in the earlier malaria stage), as reported in our previous work.8
Conclusion
In conclusion, we report the dependence of magnetic field-enriched β-hematin SERRS on the variations of the Fe3O4@Ag core size and shell thickness. We explain that the magnetic field-enriched SERRS performance of β-hematin can be further improved by tuning the extinction efficiencies, localized electromagnetic field and magnetic properties of the Fe3O4@Ag to an optimal core size and shell thickness. Hence, the optimized magnetic field-enriched SERRS performance shows the potential for sensitive β-hematin detection for early malaria diagnosis. The methodologies developed in this study will be applicable to nanoparticles of other shapes such as nanostars for SERS measurements from β-hematin, which could yield higher enhancement than nanoshells. This strategy can be also generalized to optimize SERS enhancement for nanocrystals of interest with irregular shapes in other applications.Acknowledgements
This research was funded by the Singapore Lee Kuan Yew (LKY) start-up grant. The authors are also grateful to the LKY research fellowship (Clement Yuen) for sponsoring him to carry out his postdoctoral research and the New Investigator Grant (Project no. NMRC/NIG/1044/2011) funded by the National Medical Research Council (NMRC) in Singapore (Quan Liu).Notes and references
- T. J. Egan, J. M. Combrinck, J. Egan, G. R. Hearne, H. M. Marques, S. Ntenteni, B. T. Sewell, P. J. Smith, D. Tayor, D. A. V. Schalkwyk and J. C. Walden, Biochem. J., 2002, 365, 343 CrossRef CAS PubMed.
- D. J. Sullivan, I. Y. Gluzman and D. E. Goldberg, Science, 1996, 271, 219 CAS.
- A. Butykai, A. Orban, V. Kocsis, D. Szaller, S. Bordacs, E. Tatrai-Szekeres, L. F. Kiss, A. Bota, B. G. Vertessy, T. Zelles and I. Kezsmarki, Sci. Rep., 2013, 3, 1431 CrossRef CAS PubMed.
- J. W. Kang, N. Lue, C. R. Kong, I. Barman, N. C. Dingari, S. J. Goldfless, J. C. Niles, R. R. Dasari and M. S. Feld, Biomed. Opt. Express, 2011, 2, 2484 CrossRef PubMed.
- B. R. Wood, A. Hermelink, K. R. Bambery, G. T. Webster, M. A. Khiavi, B. M. Cooke, S. Deed, D. Naumann and D. McNaughton, Analyst, 2009, 134, 1119 RSC.
- S. Cinta-Pinzaru, N. Peica, B. Kustner, S. Schlucker, M. Schmitt, T. Frosch, J. H. Faber, G. Bringmann and J. Popp, J. Raman Spectrosc., 2006, 37, 326 CrossRef CAS.
- B. R. Wood, E. Bailo, M. A. Khiavi, L. Tilley, S. Deed, T. D. Gaudig, D. McNaughton and V. Deckert, Nano Lett., 2011, 11, 1868 CrossRef CAS PubMed.
- C. Yuen and Q. Liu, J. Biomed. Opt., 2012, 17, 017005 CrossRef PubMed.
- T. Frosch, S. Koncarevic, K. Becker and J. Popp, Analyst, 2009, 134, 1126 RSC.
- D. M. Newman, J. Heptinstall, R. J. Matelon, L. Savage, M. L. Wears, J. Beddow, M. Cox, H. D. Schallig and P. F. Mens, Biophys. J., 2008, 95, 994 CrossRef CAS PubMed.
- S. Lal, S. Link and N. J. Halas, Nat. Photonics, 2007, 1, 641 CrossRef CAS.
- B. T. Draine and P. J. Flatau, J. Opt. Soc. Am. A, 1994, 11, 1491 CrossRef.
- C. Yuen, W. Zheng and Z. Huang, J. Raman Spectrosc., 2010, 41, 374 CAS.
- K. T. Wu, P. C. Kuo, Y. D. Yao and E. H. Tsai, IEEE Trans. Magn., 2001, 37, 2651 CrossRef CAS.
- Y. Zhai, J. Zhai, Y. Wang, S. Guo, W. Ren and S. Dong, J. Phys. Chem. C, 2009, 113, 7009 CAS.
- M. A. Yurkin and A. G. Hoekstra, J. Quant. Spectrosc. Radiat. Transfer, 2011, 112, 2234 CrossRef CAS PubMed.
- C. Yuen, W. Zheng and Z. Huang, J. Innov. Opt. Health Sci., 2008, 1, 267 CrossRef.
- P. B. Johnson and R. W. Christy, Phys. Rev. B: Solid State, 1972, 6, 4370 CrossRef CAS.
- A. Schegel, S. F. Alvarado and P. Wachter, J. Phys. C: Solid State Phys., 1979, 12, 1157 CrossRef.
- Y. M. Serebrennikova, J. Patel and L. H. Garcia-Rubio, Appl. Opt., 2010, 49, 180 CrossRef PubMed.
- S. Hu, K. M. Smith and T. G. Spiro, J. Am. Chem. Soc., 1996, 118, 12638 CrossRef CAS.
- M. T. Shio, F. A. Kassa, M. J. Bellemare and M. Olivier, Microbes Infect., 2010, 12, 889 CrossRef CAS PubMed.
- T. Kar and S. Scheiner, J. Phys. Chem. A, 2004, 108, 9161 CrossRef CAS.
- D. W. Phillion, D. J. Kuizenga and A. E. Siegman, J. Chem. Phys., 1974, 61, 3828 CrossRef CAS.
- P. H. B. Aoki, P. Alessio, A. Riul, D. S. Saez and C. J. L. Constantino, Anal. Chem., 2010, 82, 3537 CrossRef CAS PubMed.
- R. Bardhan, N. K. Grady, T. Ali and N. J. Halas, ACS Nano, 2010, 4, 6169 CrossRef CAS PubMed.
- S. Kumar, C. Ravikumar and R. Bandyopadhyaya, Langmuir, 2010, 26, 18320 CrossRef CAS PubMed.
- K. Kim, J. Y. Choi, H. B. Lee and K. S. Shin, ACS Appl. Mater. Interfaces, 2010, 2, 1872 CAS.
- L. Wang, C. Clavero, Z. Huba, K. J. Carroll, E. E. Carpenter, D. Gu and R. A. Lukaszew, Nano Lett., 2011, 11, 1237 CrossRef CAS PubMed.
| This journal is © The Royal Society of Chemistry 2013 |
