Toxicity of nano zinc oxide to mitochondria
Jia-han
Li
,
Xiao-rong
Liu
,
Yue
Zhang
,
Fang-fang
Tian
,
Guang-yuan
Zhao
,
Qiu-li-yang
Yu
,
Feng-lei
Jiang
* and
Yi
Liu
*
State Key Laboratory of Virology and Key Laboratory of Analytical Chemistry for Biology and Medicine (Ministry of Education), College of Chemistry and Molecular Sciences, Wuhan University, Wuhan 430072, P.R. China. E-mail: fljiang@whu.edu.cn; yiliuchem@whu.edu.cn; Fax: +86-027-68754067; Tel: +86-027-68756667
First published on 26th June 2012
Abstract
Zinc oxide nanoparticles (ZnO NPs) are increasingly applied in a diverse array of industrial and commercial products. Therefore, it is urgently required to characterize their toxic behavior. ZnO NPs have been reported to induce toxic effects at the levels of the individual organism, tissue, cell and DNA. However, little is known about the potential impacts of ZnO NPs at a subcellular level. In the present work, we investigated the toxicity of ZnO NPs to the isolated rat liver mitochondria. We found that treatment of mitochondria with ZnO NPs resulted in collapse of mitochondrial membrane potential (Δψ), swelling, depression of respiration, inner membrane permeabilization to H+ and K+, alterations of ultrastructure, release of cytochrome c, generation of reactive oxygen species (ROS), and Zn2+ liberation from ZnO NPs. These results suggested that ZnO NPs can increase the inner membrane permeability and impair the respiratory chain, thus leading to energy dissipation, oxidative stress and even apoptosis. This putative mechanism helps us learn more about the toxicology of this nanomaterial.
1. Introduction
Nanoparticles are sized between about 1 and 100 nm, showing many properties that are not seen in their bulk counterparts.1 They are increasingly applied in a diverse array of industrial and commercial products, such as fillers, opacifiers, catalysts, semiconductors, cosmetics, microelectronics, drug carriers, clothes, and sports goods.1–3 Especially, metal oxide nanoparticles are very important, because they are widely used in water-treatment agents, materials for solar batteries and automobile catalytic converters, cosmetics, sunscreens, self-cleaning coatings and textiles.4 However, recently it has been shown that many metal oxide nanoparticles may pose potential risks to human health and other organisms.4–6 Therefore, it is urgently required to understand how metal oxide nanoparticles can interact with biological system.Large amounts of ZnO nanoparticles (ZnO NPs) have been widely used in many fields, including sunscreen products, cosmetics, pigments, industrial coatings, plastic additives, semiconductors, textiles, and antibacterial agents.6,7 Previous toxicological studies showed that ZnO NPs are toxic at organism, cell and molecular levels. For example, ZnO NPs showed acute toxicity to zebrafish partly due to the release of zinc ions.8 Experiments using freshwater alga Pseudokirchneriella subcapitata revealed that their toxicity was solely attributed to dissolved zinc.9 Oxidative stress may play a primary role in inducing the cytotoxicity of ZnO NPs in human colon carcinoma cells.10 Dissolution of ZnO NPs results in elevated levels of Zn2+ which impairs mitochondrial function and leads to apoptosis in cancer cells.11Escherichia coli treated with ZnO NPs exhibited significant DNA damage, including DNA unwinding and fragmentation.12 However, little is known about the potential impacts of ZnO NPs at a subcellular level.
Mitochondria, the primary source of cellular energy, are organelles found in almost all eukaryotic cells. Meanwhile, they play a determinant role in cell signaling and apoptosis.13–17 However, because of their exquisite structures and complicated functions, mitochondria are the primary target for xenobiotics.18 Malfunctioning mitochondria may present insufficient energy production, exothermic oxygen combustion and free radical emission.13,19 In a word, mitochondrial dysfunctions lead to various diseases.15
So far, most researches regarding the toxic effects of ZnO NPs on mitochondria were performed by tracking the release from or entrapment in mitochondria of fluorescent dyes within cultured cells.20 However, this technique has some limitations. For example, measurements must be taken within a relatively short time.21 The direct effects of ZnO NPs on mitochondrial inner membrane permeabilization, bioenergetics, ultrastructure and swelling cannot be provided by this technology. In order to have a more thorough understanding of their toxicity on mitochondria, it is necessary to conduct some experiments on isolated mitochondria. Herein, we used isolated rat liver mitochondria to investigate the immediate effects of ZnO NPs on mitochondrial functions and try to address the possible mechanisms of their toxicity.
2. Experiments
2.1 Chemicals
ZnO NPs (100 nm), bovine serum albumin (BSA), rotenone, oligomycin, tetramethylrhodamine ethyl ester (TMRE), adenosine diphosphate (ADP), 2,4-dinitrophenol (DNP) and valinomycin were purchased from Sigma (St. Louis, MO). All other reagents were of analytical reagent grade, and all solutions were prepared with deionized distilled (DI) water. DI water was prepared from a Milli-Q-RO4 water purification system (Millipore).2.2 Preparation of ZnO NPs suspension
A stock suspension was prepared by suspending 80 mg of ZnO NPs in 8 ml of H2O containing 4 mg BSA.22,23 The stock suspension was sonicated for 10 min before used.242.3 Characterization of ZnO NPs
For scanning electron microscopy (SEM), ZnO NPs were untreated before scanned by a JSM-6700F FE-SEM (JEOL Ltd, Tokyo, Japan).For transmission electron microscopy (TEM), ZnO NPs were dispersed in H2O, drop-coated on copper TEM grids and scanned by a Tecnai G2 TEM at 200 kV (JEOL Ltd, Tokyo, Japan).
2.4 Isolation of mitochondria
Wistar rats (170–250 g) were purchased from Hubei Research Centre of Experimental Animals (Wuhan, China). Liver mitochondria were isolated by differential centrifugation according to the literature with minor modifications.25 The fresh liver tissue was chilled on ice bath, minced with scissors, and washed in solution A (0.22 M mannitol, 0.07 M sucrose, 0.02 M HEPES, 2 mM Tris-HCl, and 1 mM EDTA, pH 7.4). About 5 g mince were suspended in 100 ml solution A containing 0.4% BSA and homogenized with Dounce Tissue Grinders.The homogenate was centrifuged at 3000 g for 2 min. Then, the supernatant was centrifuged at 17![[thin space (1/6-em)]](https://www.rsc.org/images/entities/char_2009.gif) 500 g for 3 min. The resulting pellet was washed in solution A and centrifuged at 17500 g for 4 min. Subsequently, the pellet was resuspended in solution B (0.22 M mannitol, 0.07 M sucrose, 0.01 M Tris-HCl, and 1 mM EDTA, pH 7.4) and centrifuged at 17500 g for 4 min. The pellet was finally resuspended in solution B at a ratio of 10 ml solution B per 10 g of starting material. All operations were performed at 0–4 °C.
500 g for 3 min. The resulting pellet was washed in solution A and centrifuged at 17500 g for 4 min. Subsequently, the pellet was resuspended in solution B (0.22 M mannitol, 0.07 M sucrose, 0.01 M Tris-HCl, and 1 mM EDTA, pH 7.4) and centrifuged at 17500 g for 4 min. The pellet was finally resuspended in solution B at a ratio of 10 ml solution B per 10 g of starting material. All operations were performed at 0–4 °C.
Mitochondrial protein concentration was measured by the Biuret method using bovine serum albumin as the standard. Before experiments, we measured mitochondrial respiration with a Clark-type oxygen electrode and only mitochondrial suspensions with a RCR ≥ 3.0 were used.
2.5 Measurement of mitochondrial membrane potential
To monitor mitochondrial membrane potential (Δψ), fluorescence emission intensity of tetramethylrhodamine ethyl ester (TMRE) was detected by a LS-55 fluorophotometer (Perkin-Elmer, Norwalk, CT) equipped with a quartz cell of 1.0 cm path length at 25 °C (λex = 535 nm, λem = 590 nm). Mitochondria were dispersed in solution B with a final concentration of 0.5 mg ml−1.262.6 Measurement of mitochondrial swelling
Mitochondrial swelling was measured by alterations of absorbance at 540 nm.27 Mitochondria (0.5 mg ml−1) was suspended in 2 ml solution C (200 mM sucrose, 10 mM Tris-Mops, 1 mM Pi, 10 μM EGTA-Tris, 2 μM rotenone, and 3 μg ml−1 oligomycin, pH 7.4). Spectra were recorded at room temperature on a UNICO 4802 double beam spectrophotometer (Dayton, NJ). Ca2+ (1 μM) were added to the buffer before injecting ZnO NPs.Similar experiments were conducted to test mitochondrial inner membrane permeabilization to H+ and K+ in potassium acetate (KAc) and potassium nitrate (KNO3) medium, respectively. The KAc medium contained 135 mM KAc, 5 mM HEPES, 0.1 mM EGTA, 0.2 mM EDTA, 2 μM rotenone, and 1 μM valinomycin (pH 7.4), and the KNO3 medium contained 135 mM KNO3, 5 mM HEPES, 0.1 mM EGTA, 0.2 mM EDTA, and 2 μM rotenone (pH 7.4).28
2.7 Measurement of mitochondrial respiration
Oxygen consumption of isolated mitochondria was measured with a Clark-type oxygen electrode in a 1 ml thermostated, water-jacketed, closed chamber with magnetic stirring.29 The incubation buffer contained 125 mM sucrose, 65 mM KCl, 2.5 mM MgCl2, 5 mM KH2PO4, 5 mM HEPES, and 3 μM rotenone (pH 7.2). State 4 respiration was considered upon addition of 5 mM succinate as the energizing substrate. To induce state 3 respiration, 0.3 mM ADP was added subsequently. Finally, 1 μM FCCP was added to induce uncoupled respiration.2.8 Measurement of mitochondrial ultrastructure
Using the techniques of ultrathin sectioning and transmission electron microscopy, the ultrastructure of mitochondria was studied. Mitochondria under various experimental conditions were fixed for 30 min at 4 °C using glutaraldehyde at a final concentration of 2.5% (v/v) in PBS buffer, centrifuged to micropellets, postfixed with 1% (w/v) osmium tetroxide and dehydrated. The ultrastructure of mitochondria was observed with a Tecnai G2 transmission electron microscope.302.9 Cell viability assay
The cytotoxicity of ZnO NPs was assessed by MTT assay. HeLa cells were used for toxicity evaluation and treated with various concentrations of ZnO NPs for 72 h. Optical density measurements were carried out using an ELISA reader at 450 nm (BioTech, China) and the IC50 value (50% inhibitory concentration) was calculated by a four-parameter logistic equation.2.10 Measurement of cytochrome c
To confirm apoptosis caused by ZnO NPs, the release of cytochrome c from mitochondria was detected by Cyt-C ELISA Kit (Shanghai Hua Yi Bio Technology Co. Ltd, China) according to manufacture's protocol.2.11 Determination of free zinc released from ZnO NPs
The level of free zinc released from ZnO NPs was measured by IRIS Intrepid II XSP inductively coupled plasma-atomic emission spectroscopy (ICP-AES) (Thermo, USA). ZnO NPs dissolution was assessed using dialysis membrane of 3500 Da molecular weight cutoff.2.12 Lipid peroxidation
The effect of ZnO NPs on lipid peroxidation was evaluated by oxygen consumption using a Clark-type electrode at 25 °C in 1 ml of a medium containing 175 mM KCl, 10 mM Tris-HCl, 3 μM rotenone, 1 mM adenosine diphosphate (ADP) and 0.1 mM Fe2+ (in the presence or absence of ZnO NPs) (pH 7.2) (Fig. 10).28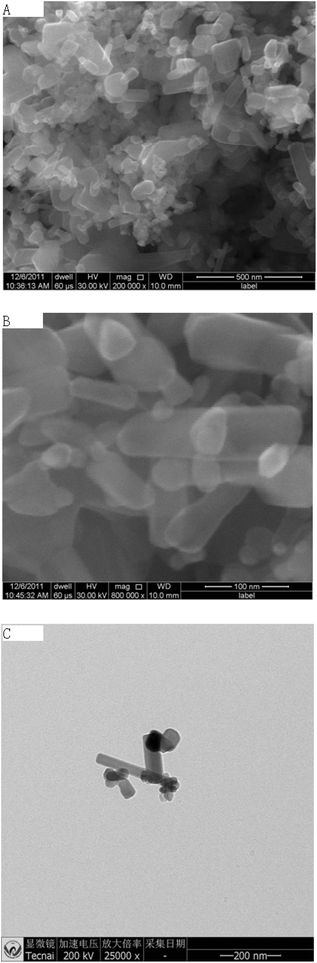
3. Results
3.1 Characterization of ZnO NPs
The morphology and size of ZnO NPs were observed by SEM and TEM. ZnO NPs were rod-shaped with a size of 100 nm (Fig. 1).3.2 Changes of mitochondrial membrane potential
The effects of ZnO NPs on mitochondrial Δψ were measured with a potentiometric fluorescent probe TMRE. TMRE can accumulate in the mitochondrial matrix with the decrease of fluorescence intensity. Upon collapse of mitochondrial Δψ, TMRE is released into the buffer, causing an increase in fluorescence intensity. As shown in Fig. 2, mitochondrial Δψ decreased with increasing concentrations of ZnO NPs.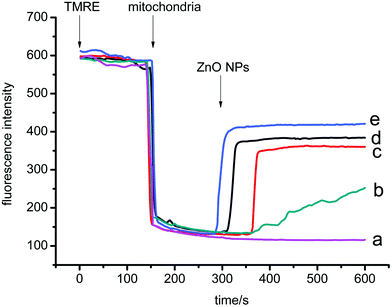 | ||
| Fig. 2 Mitochondrial membrane potential measured by changes in fluorescence emission intensity of TMRE. The traces represent typical direct recordings representative of 4 experiments obtained from different mitochondrial preparations. Traces a–e Mitochondrial suspensions (0.5 mg ml−1) were added. c (ZnO NPs)/μg ml−1: 0, 5, 13, 25, 50. | ||
3.3 Mitochondrial swelling induced by ZnO NPs
The effects of different concentrations of ZnO NPs on mitochondrial swelling were evaluated by the decrease in absorbance at 540 nm over 15 min. As shown in Fig. 3, ZnO NPs triggered mitochondrial swelling in a time- and dose-dependent manner. Taken together, data from the above experiments suggest that ZnO NPs induced mitochondrial permeability transition (MPT).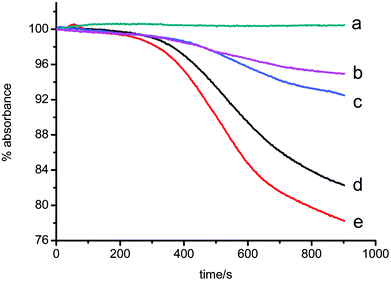 | ||
| Fig. 3 Mitochondrial swelling induced by ZnO NPs in the presence of 1 μM Ca2+. The traces represent typical direct recordings representative of 4 experiments obtained from different mitochondrial preparations. Traces a–e Mitochondrial suspensions (0.5 mg ml−1) were added. c (ZnO NPs)/μg ml−1: 0, 5, 13, 25, 50. | ||
3.4 Effects of ZnO NPs on inner membrane permeabilization to H+ and K+
The ability of ZnO NPs to act on mitochondrial inner membrane H+ conductance was examined by valinomycin-induced swelling of de-energized mitochondria suspended in KAc medium. HAc crosses the inner membrane and dissociates into Ac− and H+ in the matrix, producing a H+ gradient which impairs mitochondrial swelling. Thus, this sort of swelling can only be observed in the presence of valinomycin which allows H+ to exchange with K+ entry.31,32 In the absence of ZnO NPs, mitochondria underwent a slight swelling (Fig. 4A, trace a). In the presence of ZnO NPs (Fig. 4A, trace b, c, d, e), valinomycin-dependent mitochondrial swelling was notably increased, indicating a significant action on mitochondrial inner membrane H+ conductance.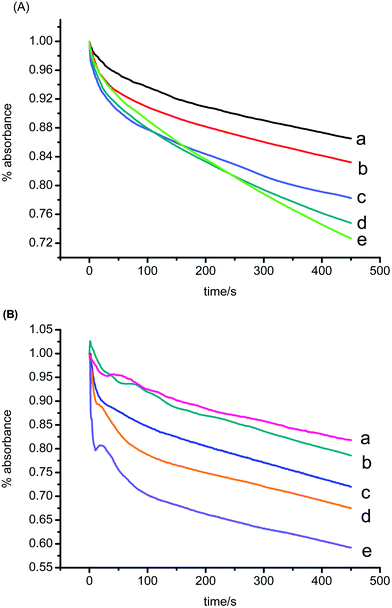 | ||
| Fig. 4 Effects of ZnO NPs on mitochondrial inner membrane permeabilization to H+ (A) and K+ (B). The traces represent typical direct recordings representative of 4 experiments obtained from different mitochondrial preparations. A Traces a–d Mitochondrial suspensions (0.5 mg ml−1) were added. c (ZnO NPs)/μg ml−1: 0, 10, 20, 30, 125. B Traces a–e Mitochondrial suspensions (0.5 mg ml−1) were added. c (ZnO NPs)/μg ml−1: 0, 15, 30, 45, 60. | ||
The ability of ZnO NPs to permeabilize mitochondrial inner membrane to K+ was tested by swelling of non-respiring mitochondria in KNO3 medium. The inner membrane is freely permeable to NO3−. So swelling can proceed in conditions of K+ permeabilization.32 As shown in Fig. 4B, ZnO NPs enhanced the K+ conductance of the inner membrane with a dose-dependent effect.
3.5 Effects of ZnO NPs on the respiration of isolated rat liver mitochondria
Fig. 5 shows the effects of ZnO NPs on mitochondrial respiration rate. In the absence of ZnO NPs, a low respiration rate at state 4 (when ADP is exhausted) indicates an intact inner membrane of isolated mitochondria.33,34 Thus mitochondria can maintain a sufficiently high electrochemical proton potential to restrict electron transport.35 Meanwhile, the high rate at state 3 (in the presence of ADP) indicates an intact respiratory chain and ATP synthase.34 Therefore, the normal processes of ATP turnover and substrate oxidation can be maintained.35 As seen in Fig. 5, the effect of ZnO NPs on state 4 respiration rate was biphasic: mitochondrial respiration was stimulated by low concentrations of ZnO NPs and inhibited by high concentrations of ZnO NPs. However, the respiration rates at state 3 and uncoupled state were significantly decreased by ZnO NPs with a dose-dependent effect.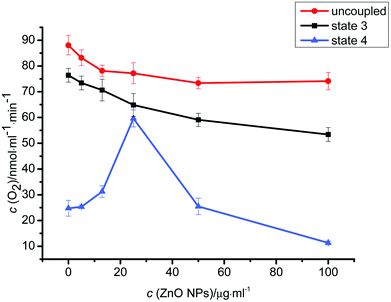 | ||
| Fig. 5 Effects of ZnO NPs on the respiration of isolated rat liver mitochondria. Respiration unit was represented as nmol O2/min mg−1 protein. Mitochondria (0.5 mg ml−1) were suspended at 25 °C in the standard medium containing succinate (5 mM) as the respiratory substrate. Results are expressed as mean ± SD. of three independent experiments. | ||
3.6 Effects of ZnO NPs on mitochondrial ultrastructure
Mitochondrial ultrastructure was observed by a transmission electron microscope. In the absence of ZnO NPs (Fig. 6A), most of the isolated rat liver mitochondria maintained the structural integrity, as demonstrated by their normal shape with a well-defined outer membrane, a narrow inter membrane space and rich cristae.36 Because of a relatively high osmolarity of the medium, mitochondria were in the condensed configuration.37 Following MPT induced by ZnO NPs (Fig. 6B, C), mitochondria were obviously swollen, with decreased matrix electron density, enlarged volume and inter membrane space, and ruptured cristae. However, there was an interesting fact that low concentrations of ZnO NPs (Fig. 6B) caused more severe damage to mitochondria than high concentrations of ZnO NPs (Fig. 6C).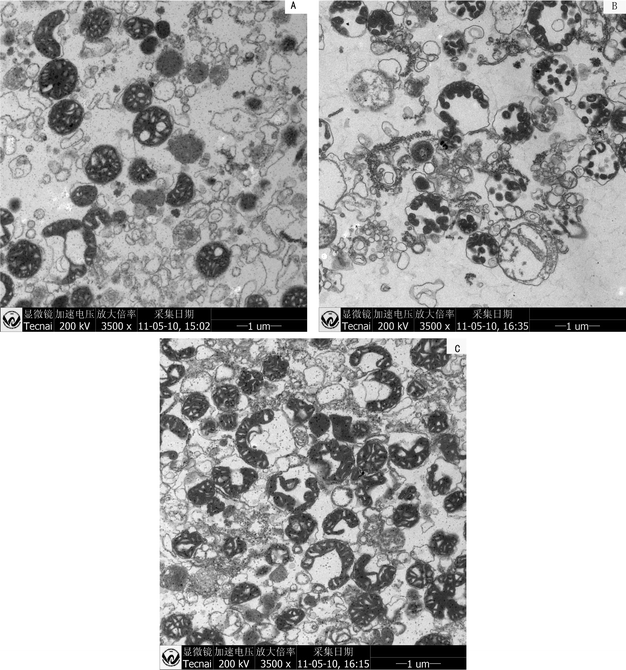 | ||
| Fig. 6 Effects of ZnO NPs on mitochondrial ultrastructure. Mitochondria were incubated in the standard medium with 0 (A), 5 (B) or 50 (C) μg ml−1 ZnO NPs. | ||
3.7 Cytotoxicity of ZnO NPs
To evaluate the toxicity of ZnO NPs at the cellular level, a MTT colorimetric assay was conducted. As shown in Fig. 7, a 72 h prolonged stimulation with ZnO NPs caused decreased cell viability in a dose-dependent manner and the IC50 of ZnO NPs was 45.7 μg ml−1.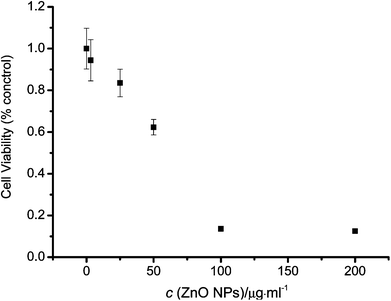 | ||
| Fig. 7 Cell viability of HeLa cells was determined by MTT assay after 72 h stimulation with various concentrations of ZnO NPs. Data were shown as mean ± SD (n = 6). | ||
3.8 Release of cytochrome c
It is generally accepted that cytochrome c release from mitochondrial intermembrane space to cytosol is one of those apoptotic features.38 To confirm that ZnO NPs induced apoptosis, the release of cytochrome c was detected. As shown in Fig. 8, in the absence of ZnO NPs, only a small amount of cytochrome c was released from mitochondria, probably due to mechanical damage in isolation process. In experimental conditions, a large amount of cytochrome c was released from the organelle independent of concentrations of ZnO NPs.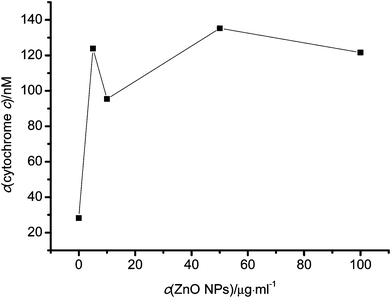 | ||
| Fig. 8 Cytochrome c release from mitochondria induced by ZnO NPs. | ||
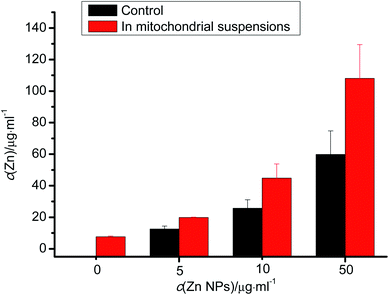
3.9 Free Zn2+ released from ZnO NPs
It is well known that Zn2+ had a great impact on mitochondria. To discover the role of free Zn2+ released from ZnO NPs in the toxicity of nano materials, we measured the concentration of Zn2+ in the absence or presence of mitochondria, respectively. In control conditions, ZnO NPs dissolved in the buffer to some degree. When interacting with mitochondria, ZnO NPs released far more Zn2+ with a dose-dependent effect.3.10 Lipid peroxidation
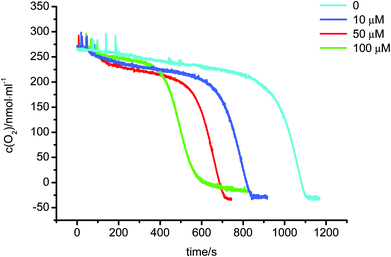
Fig. 10 showed the effect of ZnO NPs on lipid peroxidation of mitochondria. In the absence of ZnO NPs, it was easy to distinguish a two-step process in oxygen consumption. In the initial lag phase, oxygen consumption was comparatively slow, which might be related with the time required for the formation of ADP – Fe3+–˙O2− from ADP, Fe2+ and O2. No sooner was a sufficient amount of ADP – Fe3+–˙O2− generated than oxygen consumption became rapidly, which was the result of lipid peroxidation.28 ZnO NPs effectively shortened the lag phase, but had little effect on the rapid oxygen consumption phase. These results suggested that ZnO NPs enhanced the initiation of lipid peroxidation.4. Discussion
Mitochondria are the only cellular organelles that can build up a Δψ of up to 180 mV, negative inside.15 The Δψ plays a key role in regulating mitochondrial activity. Using this Δψ, mitochondria can transport charged molecules and ions.39 Δψ is the major component of the electrochemical proton gradient, which is the primary form of energy generated in mitochondria. So, the fall of Δψ may result in a decrease in the electrochemical proton gradient, causing an immediate stimulation of oxygen consumption. If the electrochemical proton gradient is not dissipated by metabolic work (e.g. protein transport or ATP synthesis), the energy of substrates is wasted in the form of heat emission.13 This study demonstrates that ZnO NPs at low concentrations (less than 25 μg ml−1) effectively collapse the mitochondrial Δψ (Fig. 2) and enhance oxygen consumption in state 4 respiration (Fig. 5), confirming that ZnO NPs exert damaging effects on mitochondrial energetics.To have a better understanding of mitochondrial bioenergetic function, the classic oxygen electrode experiments were devised.35,40 In uncoupled respiration, when the permeability of mitochondrial inner membrane is maximal, the activity of respiratory chain is determinant to the respiration rate.41 Therefore, the inhibitory effect on uncoupled respiration suggests that ZnO NPs exert an inhibitory effect on mitochondrial respiratory chain. In succinate-linked respiration, low concentrations of ZnO NPs cause increase in state 4 and decrease in state 3, suggesting that ZnO NPs at low levels affect both mitochondrial inner membrane permeability and respiratory chain/ATP synthesis.34 High concentrations of ZnO NPs cause decrease in both state 3 and state 4. Addition of 100 μg ml−1 ZnO NPs even makes the rate of state 4 respiration lower than the control value. These results indicate that high levels of ZnO NPs cause damage to the respiratory chain.42
In fact, inhibition of mitochondrial respiration impairs mitochondrial energetics directly, while MPT dissipates the electrochemical proton gradient, thus damaging mitochondrial energetics. When MPT occurs, the mitochondrial inner membrane is permeable to solutes with molecular mass up to 1500 Da.43,44 Thus, non-protein components of the mitochondrial matrix will rapidly equilibrate across the inner membrane. However, because the matrix proteins are at a higher concentration than in the medium or cytosol, they will exert a colloidal osmotic pressure, which causes mitochondrial matrix to swell.45 MPT may also lead to apoptosis. As with Pandora's Box, mitochondria are full of potentially harmful compounds, such as cytochrome c and apoptosis-inducing factors (AIFs). During MPT, these compounds are released into the cytosol, thus activating apoptotic cell death.46 In the present study, the collapse of Δψ (Fig. 2), dose-dependent swelling (Fig. 3) and alterations of mitochondrial ultrastructure (Fig. 6) caused by ZnO NPs confirm that ZnO NPs can trigger MPT.27 Apart from the energy dissipation mentioned above, MPT induced by ZnO NPs may also lead to cell apoptosis (Fig. 7 and 8), which is consistent with other reports.47,48
Under physiological conditions, the permeability of mitochondrial inner membrane to H+ and other ions must be fairly low, in order to maintain a high efficiency of energy conservation.13 Flux of H+ and K+ into the matrix can induce Δψ decrease, thus causing MPT.49,50 Moreover, some reports reveal a close relationship between mitochondrial K+ homeostasis and apoptosis. On the one hand, an enhanced mitochondrial K+ uptake leads to mitochondrial swelling, K+ accumulation and cytochrome c release. On the other hand, the increase in K+ conductance of inner membrane is responsible for an increased permeability of mitochondria to H+, leading to intracellular acidification.49,51 As can be seen from Fig. 4, ZnO NPs can enhance H+ and K+ conductance of mitochondrial inner membrane, findings that are consistent with their ability to collapse Δψ, trigger mitochondrial swelling, damage mitochondrial energetics and even lead to apoptotic cell death.
As reported, there are two toxic mechanisms of ZnO NPs, Zn2+ liberation and reactive oxygen species (ROS) production. Zn2+ can inhibit complexes of the respiratory chain or the tricarboxylic acid cycle, and stimulate MPT.52–55 In the present study, ZnO NPs degradation was observed (Fig. 9), implying that released Zn2+ was responsible for the toxic effects of ZnO NPs. ZnO NPs also induce effectively oxidative stress.10,12,56 Oxidative stress is defined as an imbalance that favors the production of ROS over antioxidant defenses.57 It is generally accepted that ROS is a major factor in the induction of MPT as well as a consequence of MPT.58 Our findings suggested that ZnO NPs favored increased ROS production in mitochondria and enhanced the initiation of lipid peroxidation (Fig. 10). Therefore, we tentatively hypothesize that release of Zn2+ and production of ROS are central to ZnO NPs toxicity (Fig. 11).
 | ||
| Fig. 9 Free zinc released from ZnO NPs. | ||
 | ||
| Fig. 10 Effect of ZnO NPs on lipid peroxidation of mitochondria. | ||
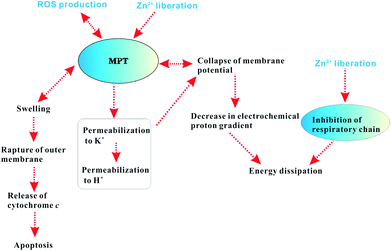 | ||
| Fig. 11 Proposed mechanism of mitochondrial dysfunction induced by ZnO NPs. | ||
This study demonstrates a putative mechanism of the toxicity of ZnO NPs to mitochondria. Due to release of Zn2+ and production of ROS, ZnO NPs increase the inner membrane permeability and impair the respiratory chain, thus leading to energy dissipation, oxidative stress and even apoptosis.
Acknowledgements
The authors gratefully acknowledge the financial support from the Chinese 973 Program (grant no. 2011CB933600) and the National Natural Science Foundation of China (grant no. 21077081, 21173026).References
- M. Auffan, J. Rose, J. Y. Bottero, G. V. Lowry, J. P. Jolivet and M. R. Wiesner, Nat. Nanotechnol., 2009, 4, 634–641 CrossRef CAS.
- A. Nel, T. Xia, L. Mädler and N. Li, Science, 2006, 311, 622 CrossRef CAS.
- R. Damoiseaux, S. George, M. Li, S. Pokhrel, Z. Ji, B. France, T. Xia, E. Suarez, R. Rallo and L. Mädler, Nanoscale, 2011, 3, 1345–1360 RSC.
- T. Puzyn, B. Rasulev, A. Gajewicz, X. Hu, T. P. Dasari, A. Michalkova, H. M. Hwang, A. Toropov, D. Leszczynska and J. Leszczynski, Nat. Nanotechnol., 2011, 6, 175–178 CrossRef CAS.
- V. L. Colvin, Nat. Biotechnol., 2003, 21, 1166–1170 CrossRef CAS.
- X. Zheng, R. Wu and Y. Chen, Environ. Sci. Technol., 2011, 45, 2826–2832 CrossRef CAS.
- M. Li, L. Zhu and D. Lin, Environ. Sci. Technol., 2011, 45, 1977–1983 CrossRef CAS.
- D. Xiong, T. Fang, L. Yu, X. Sima and W. Zhu, Sci. Total Environ., 2011, 409, 1444–1452 CrossRef CAS.
- N. M. Franklin, N. J. Rogers, S. C. Apte, G. E. Batley, G. E. Gadd and P. S. Casey, Environ. Sci. Technol., 2007, 41, 8484–8490 CrossRef CAS.
- B. De Berardis, G. Civitelli, M. Condello, P. Lista, R. Pozzi, G. Arancia and S. Meschini, Toxicol. Appl. Pharmacol., 2010, 246, 116–127 CrossRef CAS.
- A. Sasidharan, P. Chandran, D. Menon, S. Raman, S. Nair and M. Koyakutty, Nanoscale, 2011, 3, 3657–3669 RSC.
- A. Kumar, A. K. Pandey, S. S. Singh, R. Shanker and A. Dhawan, Free Radical Biol. Med., 2011, 51, 1872–1881 CrossRef CAS.
- K. B. Wallace and A. A. Starkov, Annu. Rev. Pharmacol. Toxicol., 2000, 40, 353–388 CrossRef CAS.
- Y. Liu, F. Deng, R. Zhao, X. Shen, C. Wang and S.-S. Qu, Chemosphere, 2000, 40, 851–854 CrossRef CAS.
- A. Szewczyk and L. Wojtczak, Pharmacol. Rev., 2002, 54, 101–127 CrossRef CAS.
- J. M. Hwang, H. C. Kuo, T. H. Tseng, J. Y. Liu and C. Y. Chu, Arch. Toxicol., 2005, 80, 62–73 CrossRef.
- M. Norenberg and K. Rao, Neurochem. Int., 2007, 50, 983–997 CrossRef CAS.
- N. A. G. Santos, C. Catão, N. Martins, C. Curti, M. L. P. Bianchi and A. Santos, Arch. Toxicol., 2007, 81, 495–504 CrossRef CAS.
- N. Sivalingam, J. Basivireddy, K. A. Balasubramanian and M. Jacob, Arch. Toxicol., 2007, 82, 471–481 CrossRef.
- M. Zoratti, I. Szabò and U. D. Marchi, Biochim. Biophys. Acta, 2005, 1706, 40–52 CrossRef CAS.
- R. A. Jones, A. Smail and M. R. Wilson, Eur. J. Biochem., 2002, 269, 3990–3997 CrossRef CAS.
- M. Horie, K. Nishio, K. Fujita, S. Endoh, A. Miyauchi, Y. Saito, H. Iwahashi, K. Yamamoto, H. Murayama and H. Nakano, Chem. Res. Toxicol., 2009, 22, 543–553 CrossRef CAS.
- R. Brayner, R. Ferrari-Iliou, N. Brivois, S. Djediat, M. F. Benedetti and F. Fiévet, Nano Lett., 2006, 6, 866–870 CrossRef CAS.
- A. Kumar, A. K. Pandey, S. S. Singh, R. Shanker and A. Dhawan, Free Radical Biol. Med., 2011, 51, 1872–1881 CrossRef CAS.
- L. A. Pon and E. A. Schon, Mitochondria, Academic Press, 2007 Search PubMed.
- M. R. Duchen, Diabetes, 2004, 53, S96 CrossRef CAS.
- F. Ricchelli, S. Gobbo, G. Moreno and C. Salet, Biochemistry, 1999, 38, 9295–9300 CrossRef CAS.
- M. A. S. Fernandes, J. B. A. Custódio, M. S. Santos, A. J. M. Moreno and J. A. F. Vicente, Mitochondrion, 2006, 6, 176–185 CrossRef CAS.
- J. Monteiro, P. Oliveira, A. Moreno and A. Jurado, Chemosphere, 2008, 72, 1347–1354 CrossRef CAS.
- V. Petronilli, J. Sileikyte, A. Zulian, F. Dabbeni-Sala, G. Jori, S. Gobbo, G. Tognon, P. Nikolov, P. Bernardi and F. Ricchelli, Biochim. Biophys. Acta, 2009, 1787, 897–904 CrossRef CAS.
- J. A. F. Vicente, M. S. Santos, A. E. Vercesi and V. M. C. Madeira, Pestic. Sci., 1998, 54, 43–51 CrossRef CAS.
- M. A. S. Fernandes, A. S. Jurado, R. A. Videira, M. S. Santos, A. J. M. Moreno, A. Velena, G. Duburs, C. R. Oliveira and J. A. F. Vicente, Mitochondrion, 2005, 5, 341–351 CrossRef CAS.
- V. J. Adlam, J. C. Harrison, C. M. Porteous, A. M. James, R. A. J. Smith, M. P. Murphy and I. A. Sammut, FASEB J., 2005, 19, 1088–1095 CrossRef CAS.
- L. Sun, C. Luo, J. Long, D. Wei and J. Liu, Mitochondrion, 2006, 6, 136–142 CrossRef CAS.
- M. D. Brand and D. G. Nicholls, Biochem. J., 2011, 435, 297 CrossRef CAS.
- V. Petronilli, J. Šileikytė, A. Zulian, F. Dabbeni-Sala, G. Jori, S. Gobbo, G. Tognon, P. Nikolov, P. Bernardi and F. Ricchelli, Biochim. Biophys. Acta, 2009, 1787, 897–904 CrossRef CAS.
- B. A. Scalettar, J. R. Abney and C. R. Hackenbrock, Proc. Natl. Acad. Sci. U. S. A., 1991, 88, 8057–8061 CrossRef CAS.
- C. B. L. Campos, G. R. Degasperi, D. S. Pacífico, L. C. Alberici, R. S. Carreira, F. Guimarães, R. F. Castilho and A. E. Vercesi, Biochem. Pharmacol., 2004, 68, 2197–2206 CrossRef CAS.
- Y. Uechi, H. Yoshioka, D. Morikawa and Y. Ohta, Biochem. Biophys. Res. Commun., 2006, 344, 1094–1101 CrossRef CAS.
- B. Chance and G. Williams, J. Biol. Chem., 1955, 217, 383–393 CAS.
- A. Floridi, M. D. Padova, R. Barbieri and E. Arcuri, Biochem. Pharmacol., 1999, 58, 1009–1016 CrossRef CAS.
- C. Lee, Biochim. Biophys. Acta, 1995, 1271, 21–28 CrossRef.
- F. Ricchelli, G. Jori, S. Gobbo, P. Nikolov and V. Petronilli, Int. J. Biochem. Cell Biol., 2005, 37, 1858–1868 CrossRef CAS.
- J. S. Armstrong, Mitochondrion, 2006, 6, 225–234 CrossRef CAS.
- A. W. C. Leung and A. P. Halestrap, Biochim. Biophys. Acta, 2008, 1777, 946–952 CrossRef CAS.
- N. Zamzami and G. Kroemer, Nat. Rev. Mol. Cell Biol., 2001, 2, 67–71 CrossRef CAS.
- C. Hanley, J. Layne, A. Punnoose, K. Reddy, I. Coombs, A. Coombs, K. Feris and D. Wingett, Nanotechnology, 2008, 19, 295103 CrossRef.
- M. Premanathan, K. Karthikeyan, K. Jeyasubramanian and G. Manivannan, Nanomed.: Nanotechnol., Biol. Med., 2011, 7, 184–192 CrossRef CAS.
- S. P. Yu, Prog. Neurobiol., 2003, 70, 363–386 CrossRef CAS.
- P. Bernardi, S. Vassanelli, P. Veronese, R. Colonna, I. Szabó and M. Zoratti, J. Biol. Chem., 1992, 267, 2934–2939 CAS.
- R. A. Eliseev, J. D. Salter, K. K. Gunter and T. E. Gunter, Biochim. Biophys. Acta, 2003, 1604, 1–5 CrossRef CAS.
- X. R. Liu, J. H. Li, Y. Zhang, Y. S. Ge, F. F. Tian, J. Dai, F. L. Jiang and Y. Liu, J. Membr. Biol., 2011, 244, 105–112 CrossRef CAS.
- D. Jiang, P. G. Sullivan, S. L. Sensi, O. Steward and J. H. Weiss, J. Biol. Chem., 2001, 276, 47524–47529 CrossRef CAS.
- E. Bossy-Wetzel, M. V. Talantova, W. D. Lee, M. N. Schölzke, A. Harrop, E. Mathews, T. Götz, J. Han, M. H. Ellisman, G. A. Perkins and S. A. Lipton, Neuron, 2004, 41, 351–365 CrossRef CAS.
- A. M. Brown, B. S. Kristal, M. S. Effron, A. I. Shestopalov, P. A. Ullucci, K. F. R. Sheu, J. P. Blass and A. J. L. Cooper, J. Biol. Chem., 2000, 275, 13441–13447 CrossRef CAS.
- W. Lin, Y. Xu, C. C. Huang, Y. Ma, K. B. Shannon, D. R. Chen and Y. W. Huang, J. Nanopart. Res., 2008, 11, 25–39 CrossRef.
- M. Ott, V. Gogvadze, S. Orrenius and B. Zhivotovsky, Apoptosis, 2007, 12, 913–922 CrossRef CAS.
- M. D. Norenberg and K. V. R. Rao, Neurochem. Int., 2007, 50, 983–997 CrossRef CAS.
| This journal is © The Royal Society of Chemistry 2012 |