Acenaphthenequinone induces cell cycle arrest and mitochondrial apoptosis via disruption of cellular microtubules†
Amlan
Das
,
Diptiman
Choudhury
,
Subhendu
Chakrabarty
,
Abhijit
Bhattacharya
and
Gopal
Chakrabarti
*
Department of Biotechnology and Dr B.C. Guha Centre for Genetic Engineering and Biotechnology, University of Calcutta, 35 Ballygunge Circular Road, Kolkata, WB 700019, India. E-mail: gcbcg@caluniv.ac.in; Fax: +91-33-2461-4849; Tel: +91-33-2461-5445
First published on 26th June 2012
Abstract
Acenaphthenequinone (AcQ) is a polycyclic aromatic hydrocarbon, present in diesel exhausts. In this report, mechanism(s) of cytotoxicity of AcQ in human lung epithelial cells (A549) and human peripheral blood mononuclear cells (PBMC) have been investigated. Treatment with AcQ resulted in the disruption of the microtubule network in A549 cells in time and concentration-dependent manners and caused cell cycle arrest in the G2/M phase and apoptosis, with an IC50 value of ∼35 and ∼14 μM for 24 h and 48 h respectively. AcQ induced apoptosis in PBMC cells (IC50 ≈ 15 μM, 24 h). We found up-regulation of cyclin B1 and down-regulation of cyclin D1 caused G2/M arrest in treated cells. Up-regulation of pro-apoptotic proteins like p53 and Bax, and down-regulation of anti-apoptotic protein Bcl-2 were observed in treated A549 cells. Loss of mitochondrial membrane potential and activation of caspase-3 as well as release of mitochondrial cytochrome c was also obtained. AcQ also inhibited the tubulin polymerization in cell free system (IC50 ≈ 10 μM). The stoichiometry of AcQ binding to purified tubulin was nearly 1![[thin space (1/6-em)]](https://www.rsc.org/images/entities/char_2009.gif) :1 with a dissociation constant of 11.0 ± 0.8 μM at 25 °C. Interaction of AcQ with tubulin resulted in conformational changes, monitored by quenching of tryptophan fluorescence, tubulin–colchicine and tubulin–ANS binding and CD experiments.
:1 with a dissociation constant of 11.0 ± 0.8 μM at 25 °C. Interaction of AcQ with tubulin resulted in conformational changes, monitored by quenching of tryptophan fluorescence, tubulin–colchicine and tubulin–ANS binding and CD experiments.
Introduction
Rapid urbanization, associated with the expansion of industries and transport have led to an alarming increase in the levels of air pollution, which has become a major threat to the health of millions of people worldwide. Diesel exhaust particles (DEP) are the major contributors to particulate air pollution and comprise a wide array of organic compounds including polycyclic aromatic hydrocarbons (PAH), nitro aromatic hydrocarbons, heterocyclics, quinones, aldehydes and aliphatic hydrocarbons.1–3 Exposure to DEP results in acute and chronic respiratory problems, asthmatic complications, carcinogenesis in lung tissue, and allergic disorders.4–6 Several epidemiological surveys conducted with individuals occupationally exposed to diesel emissions revealed that there is an association between DEP exposure and COPD (chronic obstructive pulmonary disease) mortality risk.7–9 Quinoid PAHs are the major constituents of the exhausts emitted by diesel and gasoline-powered engines. They can lead to apoptosis and inflammatory responses via generation of reactive oxygen species (ROS).10–13 Acenaphthenequinone (AcQ) (Fig. 1A) is a quinoid PAH, reported to be present in the atmosphere at concentrations up to 7.1 ng m−3 (California Regional Particulate Air Quality Study [CRPAQS]). There are several reports which have confirmed the presence of AcQ in diesel emissions.14–16 But there are only a few reports regarding the mechanism of AcQ-induced cytotoxicity. Two very recent studies have revealed that treatment of AcQ in A549 cells causes the generation of ROS, via activation of 5-lipoxygenase and modulation of cox-2 expression,17,18 but no direct target of AcQ in cells has been explored yet. Hence the cellular and molecular mechanisms of AcQ-induced cytotoxicity require further elucidation. Microtubules are the major dynamic cytoskeletal components, which act as potential targets for various cytotoxic agents like rotenone,19 1,4-benzoquinone (PBQ),20 peroxynitrite21 and cigarette smoke.22,23 Disruption of the microtubule network eventually leads to apoptosis.19–23 Microtubules are composed of tubulin heterodimers (α and β), which participate in various cellular processes such as cell signaling, cell motility, organelle transport, maintenance of cell polarity and separation of the duplicated centrosomes in cell division.24–27 Loss of microtubule integrity and dynamics is found to be associated with the pathogenesis of several disorders like Alzheimer's disease (AD)28,29 Parkinson's disease,30 atherosclerosis31 and lung emphysema.22 In the present study we have investigated the possible mechanism(s) of AcQ-induced cytotoxicity in lung epithelial cells (A549). In spite of having tumorigenic properties, A549 has been used extensively to elucidate the toxicology of several agents like cigarette smoke, DEPs, PBQ, and acrolein, to name a few.17,18,20,22,32 There are also reports of using A549 as an in vitro model for investigating several lung disorders like COPD or emphysema.33–36 Hence for exploring the cytotoxic effects of AcQ, A549 cells have been chosen as the in vitro model. We have demonstrated that AcQ perturbs the microtubule cytoskeleton in cells, binds directly to purified tubulin and subsequently results in the mitochondria-dependent activation of caspase-3, the central executioner of apoptosis. A549 cells are lung cells although they are cancerous; therefore, to observe the effect of AcQ on normal cells we have used human peripheral blood mononuclear cells (PBMC). We found AcQ also induces PBMC cellular apoptosis in a concentration dependent manner suggesting a systemic toxic effect of AcQ in the body.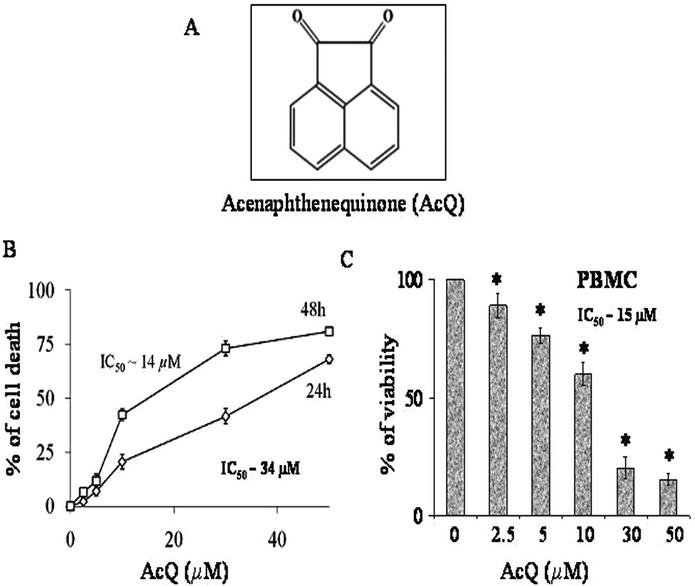 | ||
| Fig. 1 Effect of AcQ on viability of PBMC and A549 cells. (A) Chemical structure of acenaphthenequinone (AcQ). (B) Loss of viability of A549 cells. Cultured A549 cells were treated with increasing concentrations of AcQ (0–50 μM) for 24 h and 48 h respectively, and cell viability assay was performed by MTT (described in the Experimental). Data are represented as mean ± SEM (*P < 0.05) (AcQ untreated cell) vs. AcQ-treated cells, where n = 4. (C) Effect of different concentrations of AcQ on viability of PBMC cells after 24 h of treatment. Data are represented as mean ± SEM (*P < 0.05), where n = 4. | ||
Results
Loss of viability of the human lung epithelium (A549) and human peripheral blood mononuclear (PBMC) cells in the presence of AcQ
Viability of A549 cells was estimated by MTT assay after treatment with different concentrations of AcQ for 24 h and 48 h, respectively (Fig. 1B). Treatment with AcQ resulted in time- and dose-dependent loss of cell viability in A549 cells. In the presence of 10 μM AcQ, the viable population of A549 was reduced by 43% after 48 h of incubation, while after 24 h of incubation the cell viability was reduced by 21%. Similarly treatment with 30 μM of AcQ resulted in the decline of viable population by 41% and 73%, after incubation for 24 h and 48 h, respectively. The IC50 (50% inhibitory concentration) was calculated from the graph and it was found to be ∼14 ± 0.8 μM for AcQ after 48 h of treatment and 34 μM after 24 h of treatment. We also checked the effect of AcQ on cell viability of normal cells such as PBMC cells by trypan blue exclusion assay after treatment with different doses of AcQ for 24 h (Fig. 1C). PBMC cells were found to be susceptible to AcQ treatment. At 5 μM AcQ, the viable population of PBMC was reduced by 23%, while at 10 μM AcQ, it was further reduced by 40% (Fig. 1C). The calculated IC50 for AcQ was found to be 15 μM.Inhibition of the cell cycle progression of A549 cells by AcQ
To examine the effect of AcQ on cell cycle progression of A549 cells, the cell cycle phase distribution of AcQ-treated A549 cells was analyzed using a flow cytometer (Fig. 2). A gradual accumulation of the AcQ-treated A549 cells in the G2/M phase as well as in the sub G0/G1 phase of the cell cycle was observed in a dose- and time-dependent manner (Fig. 2A and 2B). The sub G0/G1, and G2/M population in the untreated A549 cells were 5%, and 14%, respectively, and in the presence of 30 μM AcQ, the sub G0/G1, and G2/M populations became 29% and 32%, respectively. At a higher dose, such as 50 μM AcQ, the number of cells in the sub G0/G1 phase had increased considerably with a simultaneous decrease in the G2/M population (Fig. 2A). We there after checked the cell cycle arrest pattern at lower time points (0–12 h), and found that up to 3 h there was no change in the cell distribution pattern or the death pattern in comparison with the control. Arrest of the cell cycle in A549 cells started at ∼6 h exposure to AcQ dose. We found a gradual increase in the sub G0/G1 population as well as the G2/M population after 6 and 12 h exposure. At 6 and 12 h incubation the sub G0/G1 populations were ∼5.0% and ∼23% respectively and the G2/M populations were ∼14 and ∼22% respectively (Fig. 2B). These results indicate that AcQ is inhibiting the cell cycle progression of A549 cells at the G2/M phase.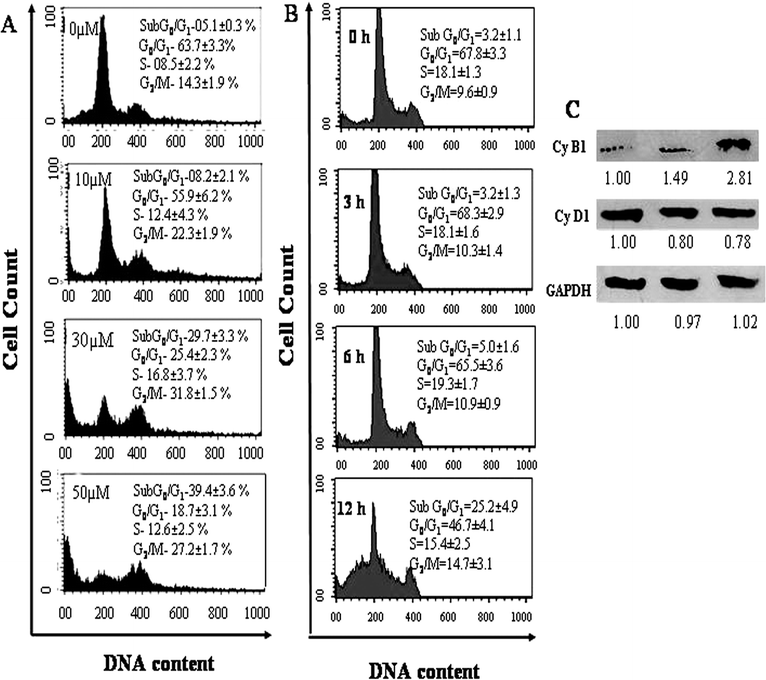 | ||
| Fig. 2 Effect of AcQ on cell cycle progression of A549 cells in dose- and time-dependent manners. (A) Effect of different concentrations of AcQ on A549 cell cycle distribution. Cultured cells (1 × 10⁶ cells per mL) were treated with AcQ (0–50 μM) for 24 h. The distribution of the cell cycle was analyzed by flow cytometry, and the percentage distribution in distinct phases of the cell cycle was determined using ModFIT software (Becton Dickinson). (B) Time-dependent effect of AcQ on A549 cell cycle distribution. Cultured A549 cells were incubated with 30 μM of AcQ for 0–24 h and cell cycle distributions were determined using flow cytometry. Data are represented as mean ± SEM (P < 0.05) vs. control (AcQ untreated cells), where n = 3. (C) Western blots for cell cycle regulatory proteins cyclin B1 and cyclin D1. Untreated and 24 h AcQ treated A549 cells were investigated by SDS-PAGE for Western blots. Proteins were identified using specific monoclonal antibodies as described in the Materials and methods section. GAPDH was used as loading control. | ||
It is well known that cell cycle cyclins play a major role in controlling the cell cycle progression. We estimated the total concentration of cyclin B1 and cyclin D1 in 24 h AcQ (0–30 μM)-treated A549 cells. We observed concentration-dependent accumulation of cyclin B1 and concentration-dependent decrease of cyclin D1 expression (Fig. 2A). In the presence of 10 μM AcQ, 1.5-fold more cyclin B1, and in the presence of 30 μM AcQ, 2.8-fold more cyclin B1, was accumulated compared to untreated cells. The variation in the cyclin D1 concentration might be due to a dose dependent shift of the A549 cell population from the G0/G1 to G2/M phase. These findings again support the induction of cell cycle arrest in the G2/M phase.
Induction of apoptosis in A549 cells by AcQ
To investigate whether AcQ is inducing apoptosis of the cultured mammalian cell lines, FITC-conjugated annexin V and PI-double staining were performed with both untreated and AcQ-treated PBMC and A549 cells. The analysis of samples using flow cytometry showed that both cell lines were subject to apoptosis in the presence of AcQ in a dose-dependent fashion (Fig. 3). In untreated cells, the number of early apoptotic (annexin V positive and PI negative) populations was 5% and 1.4% for PBMC and A549 cells, respectively. In the presence of IC50 concentration (10 μM) of AcQ, the early apoptotic population of PBMC cells had significantly increased to 35%, and a small population of cells (6%) was in the late apoptotic (annexin V positive and PI positive) phase. Similarly, at 30 μM (IC50 concentration) AcQ, about 38% of the A549 cells were found to be early apoptotic and 7% of the cells were found to be in the late apoptotic phase.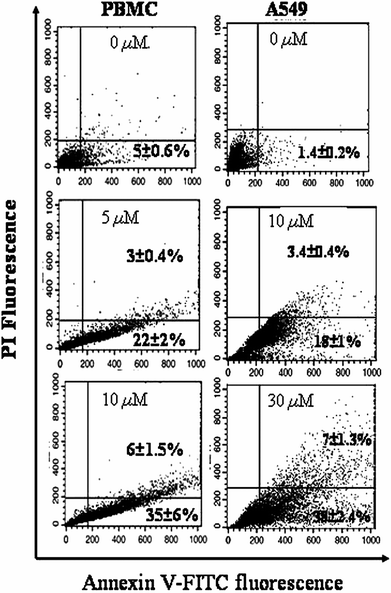 | ||
| Fig. 3 Induction of cellular apoptosis of A549 cells by AcQ treatment. Acenaphthenequinone was added to the confluent cultures of PBMC (0–10 μM AcQ) and A549 cells (0–30 μM AcQ), and cells were incubated for 24 h. Apoptosis (annexin-V positive and PI negative for early apoptotic and annexin-V and PI both positive for late apoptotic) cells were analyzed by flow cytometry (details are described in the Experimental section). Dot plot representations of annexin-V-FITC-fluorescence (x-axis) vs. PI-fluorescence (y-axis) are displayed. Data are presented as mean ± SEM (P < 0.05) where n = 3. Dot plots represent the best of data collected from three experiments with similar results and the respective populations are represented as mean ± SEM (P < 0.05) vs. control (AcQ untreated cell), where n = 3. | ||
Loss of mitochondrial membrane potential (MMP) and modulation of apoptosis regulatory proteins in AcQ-treated A549 cells
Alterations in the mitochondrial membrane potential were monitored with the fluorescent probe JC-1 by using FACS (Fig. 4A). At higher mitochondrial membrane potential, the monomeric JC-1 dye aggregated to form “J-aggregates” and emitted red fluorescence, while at lower MMP it existed as the monomer and emitted green fluorescence. Flow cytometric analysis of the AcQ-treated A549 cells revealed that with increasing concentration of AcQ, the population having the “J-aggregates” and emitting the red fluorescence decreased. This was accompanied by an increase in the population with green fluorescence. When A549 cells were treated with 10 μM AcQ, the FL-2 (red) population had decreased to 79 ± 6.1% from 97 ± 5.3% (untreated cells), and the FL-1 (green) population had increased significantly to 21 ± 2.2% from 3 ± 0.9% (untreated cells) (Fig. 4A). Similarly at 30 μM AcQ, the FL-2 (red) population had decreased to 48 ± 6%, and the FL-1 (green) population had increased to 52 ± 4.3%.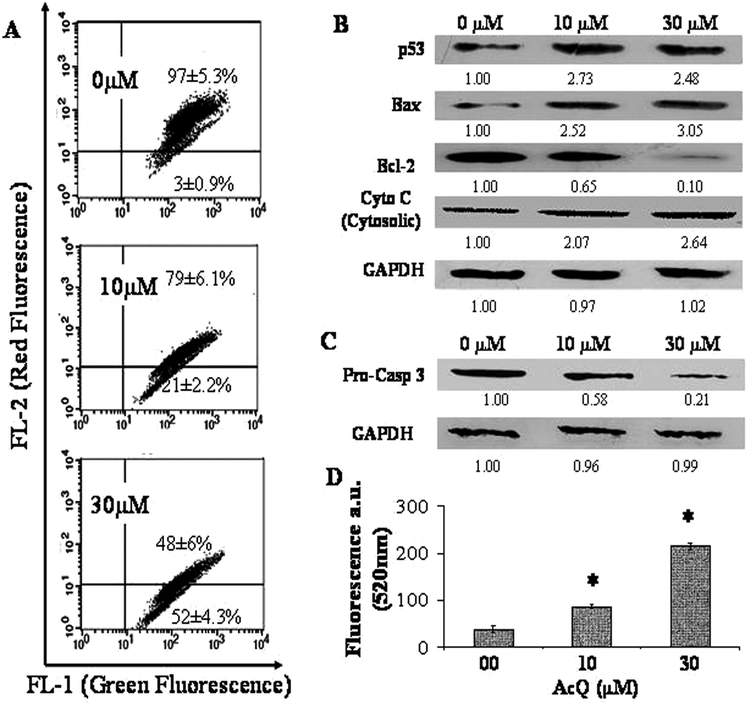 | ||
| Fig. 4 AcQ induced apoptosis through the mitochondrial pathway. (A) Alteration in mitochondrial membrane potential (MMP) in AcQ-treated A549 cells. Cultured A549 cells (1 × 10⁶ cells per mL) were incubated with AcQ (0–30 μM) for 24 h, stained with JC-1 and analyzed by flow cytometry. The lower right quadrant of the dot plot includes cells with collapsed MMP, in which JC-1 forms monomers and emits green fluorescence, while the upper right quadrant includes cells with normal MMP, in which JC-1 aggregates, and gives red fluorescence. Dot plots represent the best of data collected from three experiments with similar results and the respective populations are represented as mean ± SEM (P < 0.05) vs. control (AcQ untreated cell), where n = 3. (B) Western blot analysis for different cell cycle regulatory proteins (p53, Bax, Bcl-2) and cytosolic cytochrome c to confirm induction of cellular apoptosis due to AcQ treatment. Cultured A549 cells were treated with different concentrations of AcQ (0–30 μM) for 24 h. Whole cell protein extracts were prepared (except for cytochrome c) before running SDS-PAGE. For identification of the release of cytochrome c in cytosol, cytosolic extracts were prepared from AcQ-treated (0–30 μM) A549 cells. Proteins were blotted using the respective primary antibodies and HRP conjugated corresponding secondary antibodies (details are in the Experimental section). Each membrane was blotted 3 times after antibody stripping. GAPDH was used as loading control. The intensity of each band was determined using Quantity 1 software (Biorad, USA). (C) Degradation of pro-caspase 3 in AcQ treated A549 cells. Cells were incubated with (0–30 μM) AcQ for 24 h. Western blotting was performed against pro-caspase 3. GAPDH was used as loading control. (D) Fluorimetric analysis of the caspase-3 activity in the A549 cells treated with AcQ (0–30 μM) by using carboxyfluorescein-labeled fluoromethyl ketone peptide inhibitor (FLICA) of caspase-3. Data are represented as mean ± SEM (*P < 0.05 vs. control, n = 3). | ||
AcQ induced apoptosis in lung epithelial cells, therefore we checked the level of expression of different apoptosis regulatory proteins like p53, Bax, Bcl-2 and pro-caspase 3 in AcQ-treated A549 cells (Fig. 4B). Western blotting experiments revealed that the level of expression of p53 was increased in AcQ-treated cells (Fig. 4B). We also found an increase of expression of pro-apoptotic protein Bax and a decrease of expression of anti-apoptotic protein Bcl-2 and as a result the Bax/Bcl-2 ratio was increased in AcQ treated A549 cells. The change in the Bax/Bcl-2 ratio supported the induction of mitochondrial apoptosis in treated cells (Fig. 4B). It was also observed that loss of mitochondrial integrity resulted in the release of cytochrome c in the cytosol of the AcQ-treated A549 cells. Release of cytochrome c in the cytosol of AcQ (0–30 μM) treated A549 cells was monitored by Western blotting using anti-cytochrome c antibody (Fig. 4B). It was found that with the increase of concentration of AcQ, the amount of cytochrome c released in cytosol increased in the treated A549 cells.
For further confirmation we estimated the total pro-caspase 3 (pro-casp 3) levels in AcQ treated cells in comparison with untreated cells. A sharp decrease of pro-casp 3 levels was obtained due to treatment with AcQ (Fig. 4C). GAPDH was estimated from each lane to check equal loading (Fig. 4C).
Activation of caspase-3 of AcQ-treated A549 cells
We therefore investigated whether the release of cytochrome c in cytosol stimulates activation of the caspase-3 in the AcQ treated A549 cells and this was observed fluorimetrically (Fig. 4D). It had already been found that treatment of AcQ on A549 cells caused degradation of Pro-caspase-3 (Fig. 4C). Now to monitor whether degradation of Pro-casp 3 led to an increase in the caspase-3 activity we used FLICA. The green fluorescent signal of FLICA, an indicator of caspase-3, is a direct measure of the amount of active caspase-3 present in the cells. The green fluorescence of FLICA in the A549 cells obtained at 520 nm was found to increase linearly with the AcQ concentrations with respect to the untreated cells. When the cells were treated with 10 μM AcQ, around 2.0 ± 0.3-fold increase in the caspase-3 activity was observed and on treatment with 30 μM AcQ, the caspase-3 activity was increased by 5.6 ± 1.2-fold (Fig. 4D).Alteration in cellular morphology of A549 cells by AcQ, accompanied by the disruption of microtubule network
To examine the effect of AcQ on the morphology of A549 cells, phase contrast images of AcQ-treated cells were taken and it was observed that the regular morphology of the lung epithelial cells was altered in the treated cells (data not shown). At doses of 10 μM and 30 μM AcQ, cells were found to have contracted and become more round in shape (data not shown).Since microtubules play important roles in the maintenance of cell shape and morphology, and treatment with AcQ caused the cell cycle progression to arrest at mitosis (Fig. 2A and 2B), we further monitored the structure of cellular microtubules of A549 cells in the presence of AcQ. Confocal microscopic studies demonstrated that AcQ disrupted the microtubule network in both dose- and time-dependent fashions (Fig. 5A).
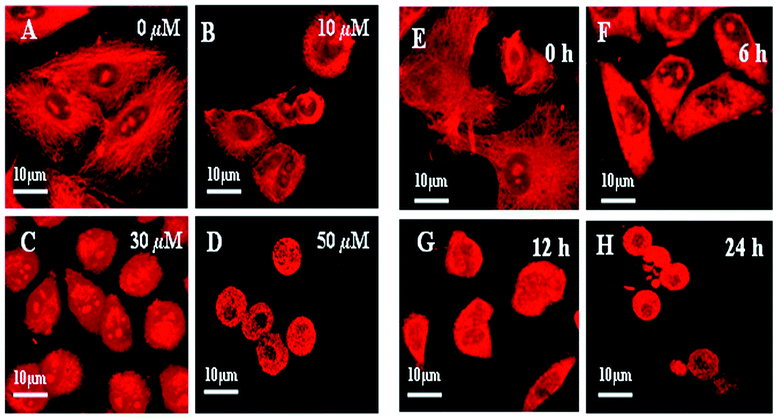 | ||
| Fig. 5 Dose- and time-dependent disruption of the microtubule network in the AcQ- treated A549 cells. Cultured A549 cells were incubated in the presence of 0 μM (A), 10 μM (B), 30 μM (C) and 50 μM (D) AcQ for 24 h, and microtubule images were taken under a Zeiss confocal microscope LSM 510 meta by using mouse monoclonal anti-α-tubulin antibody and the corresponding rhodamine conjugated (red) secondary antibody. The results represent the best of data collected from three experiments with similar results (n = 3). For the time-dependent study, cultured A549 cells were incubated in the presence of 30 μM AcQ for different time intervals. Cells were fixed and microtubule images were taken under a Zeiss confocal microscope LSM 510 meta by using mouse monoclonal anti-α-tubulin antibody and the corresponding rhodamine conjugated (red) secondary antibody, after 0 h (E), 6 h (F), 12 h (G) and 24 h (H) of incubation. The results represent the best of data collected from three experiments with similar results (n = 3). | ||
A concentration-dependent effect of AcQ on cellular microtubules was observed, when A549 cells were incubated with different concentrations of AcQ (0–50 μM) for 24 h. In the untreated cells, normal microtubule networks were observed (Fig. 5A and 5E). However, upon treatment with 10 μM AcQ for 24 h, damage to the microtubule network in A549 cells was quite prominent (Fig. 5B) compared to the untreated cells (Fig. 5A). Disruption of the microtubule network was more severe when the A549 cells were treated with 30 μM AcQ (Fig. 5C) and 50 μM AcQ (Fig. 5D), respectively. It was further observed that the mode of AcQ-induced microtubule depolymerization was irreversible in nature (Fig. S1†).
The time–kinetics data showed that treatment with 30 μM AcQ resulted in the depolymerization of cellular microtubules after 6 h of treatment (Fig. 5F) and on further incubation for 12 h, the extent of depolymerization was found to be more severe (Fig. 5G). After 24 h of treatment, significant depolymerization of the microtubule network was observed (Fig. 5H).
Perturbation of the spindle microtubules by AcQ
Since AcQ was found to arrest the cell cycle progression of A549 cells in the G2/M phase and further resulted in the depolymerization of the interphase microtubule network, we investigated the effect of AcQ on the spindle microtubules. In the untreated cells, normal bipolar spindles were observed with chromosomes congressed in the form of compact metaphase plates (Fig. 6A–6C). At lower AcQ concentration around 10 μM, spindle microtubules were moderately disorganized but the chromosomes were found to be misaligned from the metaphase plate (Fig. 6D–6F). At 30 μM AcQ, spindle microtubules were completely depolymerized, with the chromosomes unable to organize in the metaphase plate (Fig. 6G–6I).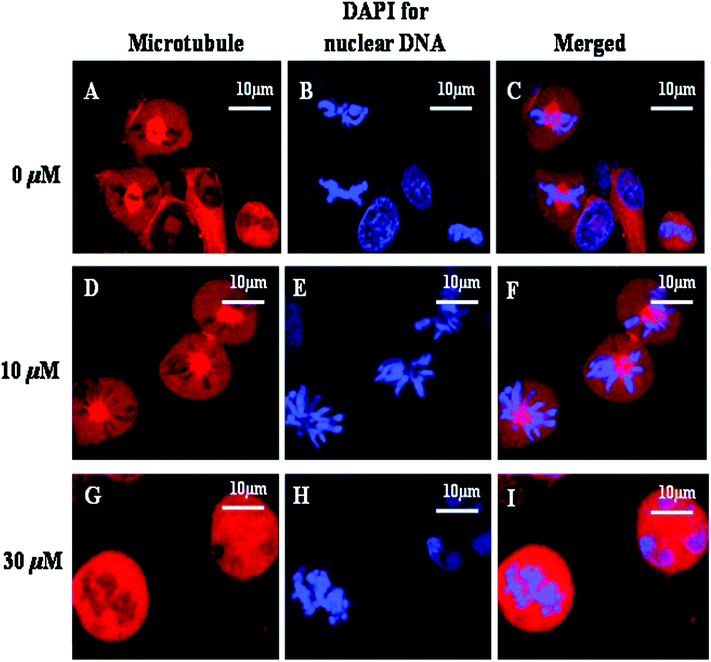 | ||
| Fig. 6 Effects of AcQ on spindle microtubule and chromosome organization of A549 cells. A549 cells were grown in the presence of 0 μM (A–C), 10 μM (D–F), and 30 μM AcQ (G–I), for 18 h. The spindle microtubule was tagged with rhodamine (red), and the chromosomal arrangement was tagged with DAPI (blue). Details of the experiments are described in the Experimental section. The results represent the best of data collected from three experiments with similar results (n = 3). | ||
Inhibition of temperature-dependent reassembly of cold-depolymerized microtubules of A549 cells by AcQ
Dynamic microtubules, when incubated under cold conditions (4 °C) for 4–6 h, were readily depolymerized (Fig. 7A and 7B). Upon incubation at 37 °C, the depolymerized microtubules were again assembled into fibrous network-like structures (Fig. 7C). The temperature dependent reassembly of the cold-depolymerized microtubules in A549 cells was found to be inhibited by AcQ in a concentration-dependent fashion. In untreated A549 cells, microtubules were formed within the 60 min of incubation at 37 °C (Fig. 7C), while in the presence of 30 μM AcQ, a few distorted microtubules were formed after 60 min of incubation (Fig. 7D and 7E). These results clearly indicated that AcQ inhibits the reassembly of microtubules in lung epithelium cells.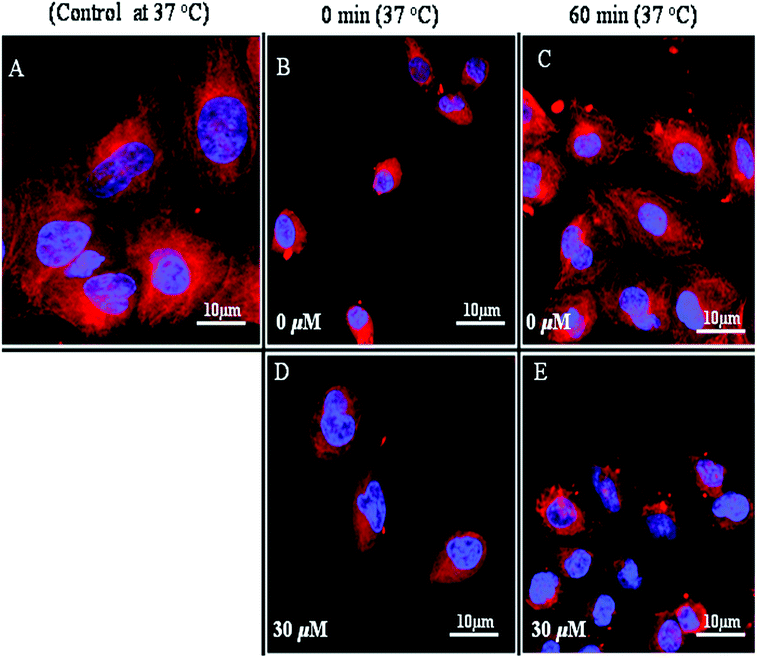 | ||
| Fig. 7 Inhibition of microtubule reassembly in lung epithelial cells after cold depolymerization in the presence of AcQ. Microtubules of cultured A549 cells (A) were depolymerized by incubation at 4 °C, and the cold medium was replaced by warm medium and the cells were then incubated in the presence of 0 μM AcQ (B–C), and 30 μM AcQ (D–E) at 37 °C for 0 min and 60 min, respectively. Images of the reassembled microtubules in the untreated and treated A549 cells were captured using anti-α-tubulin (mouse monoclonal) antibody and the corresponding rhodamine conjugated (red) secondary antibody with a LSM 510 Meta confocal microscope. The results represent the best of data collected from three experiments with similar results (n = 3). | ||
Inhibition of tubulin polymerization by AcQ in cell free system
Since AcQ disrupts the cellular microtubules, we were interested to examine the direct effect of AcQ on tubulin-polymerization in a cell free system. Polymerization of the purified tubulin (15 μM) in the absence or presence of AcQ was monitored by light scattering assay (Fig. 8A). Inhibition of tubulin polymerization was observed in a concentration-dependent manner and 50% inhibition of microtubule polymerization (IC50) occurred at AcQ concentration of 10 μM (Fig. 8A). Thus, AcQ inhibits tubulin polymerization effectively in a cell free system. | ||
Fig. 8 Loss of the functional and structural properties of tubulin in the presence of AcQ. (A) Inhibition of microtubule assembly by AcQ in a dose-dependent manner as monitored by light scattering at 350 nm. Tubulin (15 μM) was polymerized separately in the presence of AcQ (0–20 μM), and polymerization of tubulin was monitored spectrophotometrically at 37 °C. Data represent the best of three independent experiments with similar results (n = 3). (B) Inhibition of colchicine binding activity of tubulin in the presence of 0 μM ( ), 5 μM ( ), 5 μM ( ), 10 μM ( ), 10 μM ( ), 15 μM ( ), 15 μM ( ), 20 μM ( ), 20 μM ( ), and 25 μM ( ), and 25 μM ( ) AcQ by fluorescence spectroscopy. Details of the assay are described in the Methods section. Data represent the best of three independent experiments with similar results (n = 3). (C) Time-dependent quenching of the tryptophan fluorescence of tubulin treated with AcQ. Tubulin (2 μM) was incubated with 10 μM AcQ for 30 min, and fluorescence was measured after 1 min, 10 min, 20 min, and 30 min intervals, until the reaction became saturated. Data are represented as mean ± SEM (P < 0.05 vs. control, n = 3). (D) Dose-dependent quenching of the tryptophan fluorescence of tubulin (1 μM) in the presence of AcQ (0–20 μM) after incubation at room temperature for 30 min. (Inset) A plot of tubulin tryptophan fluorescence at 335 nm vs. AcQ concentration. All data are represented as mean ± SEM (P < 0.05 vs. control, n = 3). ) AcQ by fluorescence spectroscopy. Details of the assay are described in the Methods section. Data represent the best of three independent experiments with similar results (n = 3). (C) Time-dependent quenching of the tryptophan fluorescence of tubulin treated with AcQ. Tubulin (2 μM) was incubated with 10 μM AcQ for 30 min, and fluorescence was measured after 1 min, 10 min, 20 min, and 30 min intervals, until the reaction became saturated. Data are represented as mean ± SEM (P < 0.05 vs. control, n = 3). (D) Dose-dependent quenching of the tryptophan fluorescence of tubulin (1 μM) in the presence of AcQ (0–20 μM) after incubation at room temperature for 30 min. (Inset) A plot of tubulin tryptophan fluorescence at 335 nm vs. AcQ concentration. All data are represented as mean ± SEM (P < 0.05 vs. control, n = 3). | ||
Loss of the colchicine binding activity of tubulin by AcQ
Colchicine binding activity is a very important functional property of tubulin. Colchicine does not fluoresce in aqueous solution, but when it binds to tubulin, its fluorescence enhances significantly at 430 nm.37 AcQ was found to inhibit the binding of colchicine to tubulin in a dose-dependent fashion (Fig. 8B). About 39.3 ± 5.8%, and 49 ± 4.0% quenching of tubulin–colchicine fluorescence at 340 nm were observed, in the presence of 5 μM and 10 μM AcQ, respectively.Binding of AcQ to tubulin and determination of the stoichiometry and dissociation constant (Kd) of AcQ–tubulin interaction
Treatment of the purified tubulin (1 μM) with AcQ (10 μM) resulted in the time-dependent quenching of the tryptophan fluorescence, which also indicates direct interaction of AcQ with tubulin. When tubulin (1 μM) was incubated with 10 μM AcQ, tryptophan fluorescence is decreased by 24% within 1 min of the reaction and after 30 min 36% quenching was observed. (Fig. 8C). The slow increase in the level of tryptophan quenching indicates time-dependent binding of AcQ to tubulin at 25 °C and it takes about 30 min to reach completion. The decrease in tryptophan fluorescence of tubulin in the presence of AcQ was also observed in a concentration-dependent manner (Fig. 8D, inset). At a concentration of 5 μM AcQ, about 20 ± 4.0% quenching of the tubulin fluorescence was observed, while at 10 μM AcQ 35 ± 4.0% of quenching was observed. Analyzing the data obtained from the concentration dependent tryptophan quenching of tubulin upon AcQ binding, the stoichiometry and the dissociation constant (Kd) of the tubulin–AcQ interaction were calculated. Stoichiometry of the ligand–protein complex was determined using the Job plot and the stoichiometry of binding was found to be 1:1 (Fig. 9A). The dissociation constant was estimated from the double reciprocal plot of the binding data (Fig. 9B and 9C). The dissociation constant (Kd) obtained from such plots was found to be 11 ± 0.8 μM, which indicates the fair binding of AcQ to tubulin.
![Binding of AcQ to tubulin. (A) Job plot of AcQ binding to tubulin for determination of stoichiometry. The concentrations of tubulin and AcQ were varied continuously, keeping the total concentration of constant at 5 μM. The corrected fluorescence intensities at 335 nm were plotted against the mole fractions of AcQ. Data represent the best of three independent experiments with similar results. (B) Double reciprocal plot of AcQ binding to tubulin. Fmax has been determined from the plot of 1/(F0 − F) and 1/[AcQ]. (C) The linear plot of binding of AcQ to tubulin. Data are representative of three identical experiments. (D) A plot of tubulin–ANS fluorescence at 480 nm vs. AcQ concentration. (E) CD spectra of tubulin (1 μM) incubated in the presence of different concentrations of AcQ (0–10 μM). The results represent the best of data collected from three experiments with similar results (n = 3). Details of all the above experiments are described in the Experimental section.](/image/article/2012/TX/c2tx00013j/c2tx00013j-f9.gif) | ||
| Fig. 9 Binding of AcQ to tubulin. (A) Job plot of AcQ binding to tubulin for determination of stoichiometry. The concentrations of tubulin and AcQ were varied continuously, keeping the total concentration of constant at 5 μM. The corrected fluorescence intensities at 335 nm were plotted against the mole fractions of AcQ. Data represent the best of three independent experiments with similar results. (B) Double reciprocal plot of AcQ binding to tubulin. Fmax has been determined from the plot of 1/(F0 − F) and 1/[AcQ]. (C) The linear plot of binding of AcQ to tubulin. Data are representative of three identical experiments. (D) A plot of tubulin–ANS fluorescence at 480 nm vs. AcQ concentration. (E) CD spectra of tubulin (1 μM) incubated in the presence of different concentrations of AcQ (0–10 μM). The results represent the best of data collected from three experiments with similar results (n = 3). Details of all the above experiments are described in the Experimental section. | ||
AcQ induced structural changes in tubulin
To investigate the structural insight of interaction of AcQ with tubulin, tubulin–ANS binding was studied in the absence and presence of AcQ. The hydrophobic molecule 1,8-anilinonaphthalenesulphonate (1,8-ANS) has been used to investigate AcQ-induced conformational changes in tubulin.38 ANS has very weak fluorescence in aqueous solution, but its fluorescence increases several-fold when it forms a complex with tubulin. It was observed that ANS binding to tubulin was inhibited by AcQ in a concentration-dependent manner (Fig. 9D). For example, at 10 μM AcQ, tubulin–ANS fluorescence was reduced by 23 ± 7% and at 25 μM AcQ it was reduced by 38 ± 6%. The reduction in fluorescence of the ANS–tubulin complex by AcQ indicates the affinity of AcQ for the hydrophobic pockets of tubulin.Further it was found that the secondary structure of tubulin is perturbed in the presence of AcQ, as confirmed by circular dichroism spectroscopy studies. About 16% of the total secondary structure was lost at a dose of 10 μM AcQ (Fig. 9E), while at higher doses the damage was more prominent.
4. Discussions
Diesel exhaust particles are the major contributors to particulate air pollution, which leads to several acute complications and chronic respiratory and allergic problems in lung tissues.2–6 Acenaphthenequinone is a quinoid PAH, which is reported to be present in diesel smoke emissions.14–16 Previously it was reported that AcQ results in the generation of ROS in lung epithelium A549 cells via modulation of NF-κB and 5-lipoxygenase activities,17,18 but the detailed mechanism of AcQ-induced cytotoxicity through direct target(s) in cells has not been reported.In the present study we have found that AcQ interacts with the tubulin–microtubule dynamic equilibrium in cells and also in cell-free systems and causes cell death. This may be one of the pathways through which AcQ causes cytotoxicity to mammalian cells and the results of detailed studies support this hypothesis. We observed that AcQ depolymerizes cellular microtubule networks by direct binding with tubulin. Targeting of AcQ to the protein causes alteration of the structural and functional properties of mammalian microtubules in vitro. AcQ inhibits the reassembly of depolymerized microtubules into a well developed microtubular network in cells. Microtubules are one of the most important cargo transport systems of the cells. It helps in chromosomal segregation during mitosis, cellular signal and organelle transport, cellular motility and much more. Exposure of cells to AcQ leads to damage of this intercellular transport system. AcQ causes damage of both interphase microtubules and spindle microtubules. It is already reported in the literature that many of the toxic agents show cytotoxicity via damaging the cellular microtubule system for example rotenone,19 1,4-benzoquinone (PBQ),20 peroxynitrite,21 cigarette smoke.22,23 All these agents are reported to interact with the purified tubulin in a cell free system and also cellular microtubules, and finally lead to apoptosis of the mammalian cells. We also observed that microtubule damage of AcQ leads to induction of cell cycle arrest at the G2/M phase and cellular apoptosis. Western blots showed that microtubule damage by AcQ causes G2/M arrest by altering the accumulation of cell cycle regulatory cyclin proteins. The arrested cells thereafter shift to apoptosis by the mitochondrial pathway. One of the key mediators of AcQ treated cell arrest and death in A549 cells is p53. We found up-regulation of p53 expression led to alteration of the Bax/Bcl-2 ratio in A549 cells, which thereafter led to a change in the mitochondrial membrane potential in the cells causing release of cytochrome c and activation of caspase-3.
To investigate whether AcQ directly binds to mammalian tubulin in cell-free systems, extensive binding studies of AcQ with purified tubulin were performed. It was found that AcQ directly bound to the purified tubulin. Binding of AcQ leads to the alteration of structural and functional properties of the protein. It caused major conformational changes in the protein secondary structure. The hydrophobic fluorescence probes such as 1-anilinonaphthalene-8-sulfonic acid (ANS) or bis-ANS are routinely used to determine ligand-induced conformational changes in tubulin.38 AcQ inhibited the formation of an ANS–tubulin complex in a dose-dependent manner which supports the direct binding of AcQ to tubulin. Those structural changes caused the loss of the most important functional property of tubulin which is polymerization into microtubules. Thus it was confirmed that the disruption of microtubule network in A549 cells was due to direct binding of the AcQ to the protein.
The chemistry of AcQ binding to tubulin in cell-free system was found to be different from that of other quinones such as para-benzoquinone (PBQ). PBQ forms a covalent adduct with the tubulin sulfhydryl, which is known as the Michael adduct.39,40 Previously we showed that PBQ results in the gradual unfolding of the native conformation of tubulin20 and administration of NAC inhibits this process (Fig. S2;† C and D). But no such protection is conferred by NAC, when tubulin is incubated with AcQ (Fig. S2;† A and B). Formation of the Michael adduct by PBQ with the tubulin sulfhydryls can be monitored by the change in the absorbance maxima of PBQ at 240 nm, to 310 nm (PBQ–tub complex). When PBQ is incubated with NAC, a similar characteristic peak is obtained at around 310 nm. Thus when PBQ is added to tubulin in the presence of NAC, the adduct formation takes place very rapidly and the tubulin structure gets protection from PBQ induced unfolding. But no such distinguishable spectral change was found when AcQ was incubated with NAC (Fig. S2,† E). Hence it is evident that AcQ has a lower affinity for the –SH groups. Among the available chemical reactions of AcQ, there are no reports of its reactivity with the sulfhydryl groups,41 although a minor loss of the reactive cysteine residues was observed when tubulin was treated with AcQ. But it may be concluded that loss of tubulin thiols may be due to the conformational changes in the protein structure (Fig. S2,† F). Further it was found that treatment of AcQ resulted the dose-dependent quenching of the tubulin–ANS fluorescence. This result proves that AcQ has a very high affinity towards the hydrophobic pocket present in the tubulin structure.
Diesel exhausts are a major air pollutant in both urban as well as suburban regions. People inhale those toxic agents regularly during breathing. The lungs and blood are the major areas where these toxic agents have rapid effects. The cellular as well as biochemical studies confirmed that tubulin–microtubules are a potential target of AcQ mediated damage in lung and blood tissues. This kind of damage may lead to various serious clinical problems for human health including emphysema and many hematological disorders.
Experimental
Chemicals and reagents
Nutrient mixture F12 Ham (supplemented with 1 mM L-glutamine), RPMI, FBS, Penicillin–streptomycin and Amphotericin B were purchased from HyClone, USA. Human lung epithelium cells (A549) were obtained from the National Centre for Cell Science, Pune, India. Trypsin-Versene (1X) was purchased from Cambrex Bioscience, USA; monoclonal anti-α-tubulin antibody (raised in mouse), mouse monoclonal anti-p53 antibody, mouse monoclonal anti-Bax antibody, rabbit monoclonal anti-cyclin B1, mouse monoclonal anti-cyclin D1, rabbit monoclonal anti-Bcl-2 antibody, goat-polyclonal anti-pro-caspase 3, GTP, PIPES, MgCl2, EGTA, DAPI, DTNB, Histopaque 1077 and acenaphthenequinone (AcQ) were purchased from SIGMA, USA. Mouse monoclonal anti-cytochrome c antibody, anti-GAPDH antibody, HRP conjugated anti-mouse, anti-rabbit, anti-goat antibody, TRITC conjugated anti-mouse IgG antibody were purchased from Santa Cruz, CA, USA. All other chemicals and reagents are analytical grade and were purchased from Sisco Research Laboratories, India.Cell culture and maintenance
Human type II lung epithelium cells (A549) were maintained in the nutrient mixture HAM'S F12 supplemented with 1 mM L-glutamine, 10% fetal bovine serum, 50 μg mL−1 penicillin, 50 μg mL−1, streptomycin and 2.5 μg mL−1 amphotericin B. Cells were cultured at 37 °C in a humidified atmosphere containing 5% CO2. Cells were grown in tissue culture flasks until they were 80% confluent before trypsinisation with 1 × Trypsin-Versene and splitting. The morphology of normal and treated cells was observed by Olympus inverted microscope model CKX41.Human blood peripheral mononuclear cells (PBMC) were immediately separated by density gradient centrifugation. Briefly, 5 mL blood was layered carefully over an equal volume of Histopaque 1077 and subjected to centrifugation for 30 min at 400g. PBMC were collected from the buff-coloured layer formed at the plasma–Histopaque 1077 interface and then suspended at a cell count of 1 × 10⁶ cells per mL in RPMI media. The cells were maintained in the RPMI medium containing 10% FBS.
Cell treatment
Cultured PBMC and A549 were grown to confluency (1 × 10⁶ cells per mL) in a 35 mm Petri plate (Nunc, Denmark), treated with different concentrations of AcQ and incubated for 24 h, unless otherwise stated.Cell viability assay
Viability of the A549 cells, in the presence of AcQ, were assessed by MTT assay. Cultured A549 cells were grown in 96-well culture plates (1 × 10⁴ cells per well), treated with different concentrations of AcQ (0–100 μM), incubated for 24 h and 48 h respectively. After incubation 50 μL of MTT (2 mg mL−1) solution in PBS were added to each well. This was incubated until a purple precipitate was visible. The absorbance was measured on an ELISA reader (MultiskanEX, Lab systems, Helsinki, Finland) at a test wavelength of 570 nm and a reference wavelength of 650 nm.20Viability of the PBMC cells, in the presence of AcQ, was assessed by the trypan blue exclusion method. Cultured PBMC and A549 cells were grown up to ∼80% confluency in 35 mm tissue culture, treated with different concentrations of AcQ (0–50 μM) and then incubated for 24 h. Cell viability was determined by the trypan blue exclusion method and results were given as the mean ± SEM of three independent experiments.
Dose and time dependent cell cycle analysis by flow cytometry
The cell cycle arrest of the A549 cells in the presence of AcQ was monitored by flow cytometry. For determining the effect of different concentrations of AcQ on lung epithelium A549 cells, cells were grown at a density of 106 cells per mL and then incubated in the presence of AcQ (0–50 μM) for 24 h. For time dependent cell cycle analysis A549 cells were incubated with 30 μM of AcQ for 3, 6, 12 and 24 h before cell cycle analysis. Cell cycle analysis was done using flow cytometry by labeling the nuclear DNA with propidium iodide (PI).22Analysis for apoptotic and necrotic cells by flow cytometry
Apoptosis was measured using flow cytometry by quantifying detectable phosphatidylserine on the outer cell membrane of apoptotic cells. Both PBMC and A549 cells were grown to confluency (1 × 10⁶) and simultaneously treated with different AcQ concentrations (0–30 μM) for 24 h, respectively. Apoptosis analysis of the treated and untreated cells was performed after staining with FITC conjugated annexin V, PI was used as counter stain, using the Becton Dickinson FACSCalibur, following the method described in ref. 20.Western blot experiment
Western blot analyses were performed to investigate the intracellular status of different cell cycle regulatory proteins including p53, cyclin B1, Cyclin D1, Bax, Bcl-2, Procaspase-3, GAPDH (glyceraldehydes-3 phosphate dehydrogenase) and cytochrome c in the control (untreated) and different concentrations (10 and 30 μM) of AcQ-treated A549 cells. A total of 50 μg of protein was loaded in each lane after denaturing with SDS and β-mercapto-ethanol. Western blotting was performed using a polyvinylidene difluoride (PVDF) membrane following the protocol published in.20 Membranes were blotted with different anti-human antibodies included; mouse monoclonal anti-p53 antibody (1:2000), rabbit monoclonal anti-cyclin B1 (1:1500), mouse monoclonal anti-cyclin D1 (1:1500), mouse monoclonal anti-Bax antibody (1:2000), rabbit monoclonal anti-Bcl-2 antibody (1:1000), mouse monoclonal anti-GAPDH (1:1500), goat polyclonal anti-pro-caspase 3 (1:1000), and mouse monoclonal anti-cytochrome c antibody (1:1000). Each membrane was blotted 3 times (after stripping). Respective HRP conjugated secondary antibodies were (1:2000, 1:1500 and 1:1000 for 1st, 2nd and 3rd blotting respectively) used to detect the bands using chemiluminescence technique.
Detection of mitochondrial membrane potential (MMP) by JC-1 staining
Mitochondrial membrane potential was determined flow cytometrically using the lipophilic cationic fluorescent dye JC-1 (Sigma, USA), which is known to accumulate in living mitochondria. For flow cytometric analysis A549 cells treated with AcQ (0–30 μM) were incubated for 15 min with 1 μg mL−1 of JC-1 in culture medium at 37 °C. Green fluorescence and red fluorescence were detected by FL-1 and FL-2 filters, respectively, using Becton Dickinson FACS Caliber flow cytometer.20Preparation of the cytosolic extract for detection of cytochrome c (cyto c) release in the AcQ treated A549 cells
Cultured A549 cells were grown to confluency in 90 mm Petri dishes and then treated with AcQ (0–30 μM) for 24 h. Cytosolic extracts of the AcQ-treated cells were prepared by using the 1 × extraction buffer A (isotonic solution, 10 mM HEPES, pH 7.5, containing 200 mM mannitol, 70 mM sucrose and 1 mM EGTA), following the published protocol.20Release of the cytochrome c in the cytosol of the apoptotic cells was detected by Western blotting, using mouse monoclonal anti-cytochrome c antibody (clone 6H2.B4, BD Pharmingen, San Diego, CA, USA).
Assay of caspase-3 activity by fluorometric method
In situ assay kit, fluorescein (Chemicon International, APT 403) was used to assess the activation of caspase-3 in the A549 cells, treated with AcQ (0–30 μM), by following the method described in ref. 20. In this assay carboxyfluorescein-labeled fluoromethyl ketone peptide inhibitor (FLICA) of caspase-3 (FAM-DEVD-FMK) was used, which produced a green fluorescence at around 520 nm, after being excited at 488 nm. Fluorescence was measured using an excitation wavelength of 490 nm and an emission wavelength of 520 nm by PTI fluorescence spectrophotometer.Sample preparation for confocal microscopy
Cultured A549 cells were grown at a density of ∼5 × 10⁵ cells per mL and incubated in the presence of AcQ (0–30 μM). Subsequently cells were washed twice by PBS, fixed by 2% paraformaldehyde and processed following the protocol described in ref. 20 and 22. Images of the cellular microtubules were taken by Zeiss confocal microscope (LSM 510 Meta) by using a mouse monoclonal anti-α-tubulin antibody (1:200 dilutions, Sigma, USA) followed by anti-mouse TRITC conjugated IgG antibody (1:150 dilutions) and cellular nuclear DNA were stained with DAPI (1 μg mL−1).
Time-dependent assembly of the microtubules in A549 cells after cold treatment
Time dependent reassembly of the cold-treated microtubules of A549 cells in the presence of AcQ (0–30 μM) were observed by immunofluorescence against α-tubulin using Zeiss confocal microscope (LSM 510 Meta). Cultured A549 cells (1 × 10⁶ cells per mL) were subjected to cold shock by incubation at 4 °C for 6 h. After cold treatment, the cold medium was replaced with warm medium containing the indicated doses of AcQ and subsequently was incubated at 37 °C. Cells were then fixed at different time points (0, and, 60 min) with 2% (v/v) paraformaldehyde at room temperature for 20 min. The fixed cells were then processed according to the method discussed previously to visualize the reassembled microtubules and DNA, respectively, using a Zeiss LSM 510 Meta confocal microscope.Purification of mammalian tubulin from goat brain
Tubulin was isolated from goat brain by two cycles of temperature-dependent assembly and disassembly in PEM buffer containing 50 mM PIPES, 1 mM EGTA, and 0.5 mM MgCl2, pH 6.9 in presence of 1 mM GTP, followed by two more cycles in 1 M glutamate buffer.20 Aliquots were flash-frozen in liquid nitrogen and stored at −70 °C. The protein concentration was estimated by the method of Bradford42 using bovine serum albumin as the standard.Tubulin polymerization assay
Assembly of tubulin into microtubules was monitored using light scattering techniques at 350 nm using V-630 Jasco Spectrophotometer. Tubulin (15 μM) was polymerized in the presence of different concentrations of AcQ (0–25 μM) and polymerization was initiated in polymerization buffer (50 mM PIPES, 1 mM MgSO4, 1 mM EGTA, pH 6.8) at 37 °C just after adding 1 mM GTP to the assembly. Polymerization of tubulin dimmers to microtubules was assayed by monitoring the turbidity at 350 nm.Spectroflurimetric studies
Fluorescence measurements of tubulin–tryptophan fluorescence were performed using a fluorescence spectrophotometer model F-7000 using a 1 cm path length quartz cuvette for all fluorescence measurements and the results were corrected for the inner filter effect according to Lakowicz’ equation [eqn (1)]:43| F = Fobs antilog [(Aex + Aem) | (1) |
Alterations in the intrinsic tryptophan fluorescence of tubulin (2 μM) in the presence of different concentrations of AcQ (0–20 μM) was monitored after excitation at 295 nm, to detect conformational changes. Each sample was incubated at room temperature for 30 min. Tryptophan fluorescence was measured by using a Hitachi fluorescence spectrophotometer model F-7000.
Determination of the stoichiometry of AcQ–tubulin binding by Job plot
Stoichiometry of AcQ-binding to tubulin was determined using the method of continuous variation.44 Several mixtures of tubulin and AcQ were prepared by continuously varying concentrations of tubulin and AcQ in the mixture keeping the total concentration of AcQ plus tubulin constant at 5 μM. Reaction mixtures were incubated at 25 °C for 60 min and the quenching of tryptophan fluorescence was recorded at 335 nm.Determination of the binding constant (Kd) of tubulin–AcQ
The interaction dissociation constant (Kd) of tubulin–AcQ binding was determined, following the method described in ref. 44. Tubulin (2 μM) was incubated with varying concentrations of AcQ (0–20 μM) at 25 °C for 60 min. The fluorescence intensity was measured at 335 nm upon excitation at 295 nm. The apparent decrease in the fluorescence values in the presence of varying concentrations of AcQ were corrected for the inner filter effect.43,44 The fraction of binding sites (X) occupied by AcQ was determined using the equation X = (F0 − F)/Fmax, where F0 is the fluorescence intensity of tubulin in the absence of AcQ, F is the corrected fluorescence intensity of tubulin in the presence of AcQ, and Fmax is calculated from the plot of 1/(F0 − F) versus 1/[AcQ] and extrapolating 1/[AcQ] to zero. The dissociation constant (Kd) was determined using the relationship in eqn (2):| Fmax/(F0 − F) = 1 + Kd/Lf | (2) |
:1 as determined from the Job plot.
Assay of tubulin–colchicine binding in the presence of AcQ
To determine whether AcQ was interfering with the colchicine binding of tubulin, the fluorescence of tubulin (3 μM) and colchicine (5 μM) complex in the presence of various concentration of AcQ (0–20 μM) was monitored, after incubation for 30 min at 37 °C. The tubulin–colchicine complex was excited at 350 nm and wave length scanning was performed between 310–400 nm.ANS binding to tubulin
1-Anilino-8-naphthalenesulphonic acid (1,8-ANS) binding to tubulin in the presence of AcQ was determined by measuring the fluorescence of the ANS–tubulin complex. Tubulin (2 μM) was incubated with AcQ (0–25 μM) for 30 min at 37 °C to form a tubulin–AcQ complex. Then ANS (10 μM) was added to the tubulin–AcQ complex and incubated for 30 min at 37 °C. The fluorescence spectrum of the sample was taken from 400–500 nm upon excitation at 370 nm.44Circular dichroism studies of tubulin treated with AcQ
Circular dichroism studies of tubulin (1 μM) incubated with varying concentrations of AcQ (0–10 μM) were done on a Jasco J600 spectropolarimeter. Protein secondary structure was monitored in the 200–260 nm wavelength regions using a cell of path length 0.1 cm. A spectral bandwidth of 1 nm and a time constant of 2 s, with the scan speed of 50 nm min−1, were used for these measurements.20 Tubulin was incubated in the presence of AcQ (0–10 μM) at 25 °C for 30 min and CD spectra were taken.Statistical analysis
Data are presented as the mean of at least three independent experiments along with standard error of the mean (SEM). Statistical analysis of data was done by one-way analysis of variance (ANOVA), with Student–Newman–Keul test by using Sigma plot 11.0. The P value <0.05 was considered to be statistically significant.Conclusion
Nowadays an increasing amount of studies on the effect of toxic compounds derived from human activity on health has been going on. The growing use of petroleum fuels such as diesel leads to increasing amounts of toxic chemicals in the environment which are affecting human health. The present study investigates the target oriented molecular mechanism of the toxicity of AcQ, a polyaromatic hydrocarbon present in diesel exhausts. It is demonstrated that AcQ targets the microtubule cytoskeleton, and simultaneously activates mitochondria dependent cell death. Previous studies show that microtubule networks are very susceptible to toxic chemicals and causing cellular apoptosis. This study also supports this. By identifying the molecular target of toxic chemicals like AcQ, which is continuously emitted from diesel exhausts, the health hazards of the chemical are confirmed. As a preventive measure, a policy limiting the emission of AcQ from diesel exhausts could be implemented.Conflict of interest
There authors declare that there are no conflicts of interest.Acknowledgements
The work was supported by grants from the Department of Science and Technology, Govt. of India (No. SR/SO/BB-14/2008) and the Department of Biotechnology, Govt. of India (No. BT/PR12889/AGR/36/624/2009) to G.C. Confocal Microscope and FACS facilities are developed by the grant from the National Common Minimum Program, Govt. of India. A.D. was supported by a fellowship (SRF) from the Centre for Research in Nanoscience and Nanotechnology, University of Calcutta. D.C. was supported with a fellowship by CSIR, Govt. of India.References
- H. E. Wichmann, Diesel exhaust particles, Inhalation Toxicol., 2007, 19, 241–244 Search PubMed.
- Y. Bai, A. K. Suzuki and M. Sagai, The cytotoxic effects of diesel exhaust particles on human pulmonary artery endothelial cells in vitro, role of active oxygen species, Free Radical Biol. Med., 2001, 30, 555–562 Search PubMed.
- C. Clunies-Ross, B. R. Stanmore and G. J. Millar, Dioxins in diesel exhaust, Nature, 1996, 381, 379 CrossRef CAS.
- R. J. Delfino, Epidemiologic evidence for asthma and exposure to air toxics, linkages between occupational, indoor, and community air pollution research, Environ. Health Perspect., 2002, 110, 573–589 CAS.
- P. H. Danielsen, S. Loft and P. Møller, DNA damage and cytotoxicity in type II lung epithelial (A549) cell cultures after exposure to diesel exhaust and urban street particles, Toxicology, 2008, 5, 1–12 Search PubMed.
- L. Bao, S. Chen, L. Wu, T. K. Hei, Y. Wu, Z. Yu and A. Xu, Mutagenicity of diesel exhausts particles mediated by cell-particle interaction in mammalian cells, Toxicology, 2007, 229, 91–100 Search PubMed.
- R. W. Atkinson, H. R. Anderson, J. Sunyer, J. Ayres, M. Baccini, J. M. Vonk, A. Boumghar, F. Forastiere, B. Forsberg, G. Touloumi, J. Schwartz and K. Katsouyanni, Acute effects of particulate air pollution on respiratory admissions, results from APHEA 2 project. Air pollution and health, a European approach, Am. J. Respir. Crit. Care Med., 2001, 164, 1860–1866 Search PubMed.
- J. E. Hart, F. Laden, M. B. Schenker and E. Garshick, Chronic obstructive pulmonary disease mortality in diesel-exposed railroad workers, Environ. Health Perspect., 2006, 114, 1013–1017 Search PubMed.
- J. Kagawa, Health effects of diesel exhaust emissions—a mixture of air pollutants of worldwide concern, Toxicology, 2002, 181–182, 349–353 CrossRef CAS.
- T. S. Hiura, N. Li, R. Kaplan, M. Horwitz, J. C. Seagrave and A. E. Nel, The role of a mitochondrial pathway in the induction of apoptosis by chemicals extracted from diesel exhaust particles, J. Immunol., 2000, 165, 2703–2711 Search PubMed.
- A. Baulig, M. Garlatti, V. Bonvallot, A. Marchand, R. Barouki, F. Marano and A. Baeza-Squiban, Involvement of reactive oxygen species in the metabolic pathways triggered by diesel exhaust particles in human airway epithelial cells, Am. J. Physiol. Lung Cell. Mol. Physiol., 2003, 285, 671–679 Search PubMed.
- J. A. Nightingale, R. Maggs, P. Cullinan, L. E. Donnelly, D. F. Rogers, R. Kinnersley, K. F. Chung, P. J. Barnes, M. Ashmore and A. Newman-Taylor, Airway inflammation after controlled exposure to diesel exhaust particulates, Am J. Respir. Crit. Care Med., 2000, 162, 61–66 Search PubMed.
- M. Y. Chung, R. A. Lazaro, D. Lim, J. Jackson, J. Lyon, D. Rendulic and A. S. Hasson, Aerosol-borne quinones and reactive oxygen species generation by particulate matter extracts, Environ. Sci. Technol., 2006, 40, 4880–4886 Search PubMed.
- C. A. Jakober, S. G. Riddle, M. A. Robert, H. Destaillats, M. J. Charles, P. G. Green and M. J. Kleeman, Quinone emissions from gasoline and diesel motor vehicles, Environ. Sci. Technol., 2007, 41, 4548–4554 Search PubMed.
- C. A. Jakober, P. G. Green and M. J. Kleeman, LC-MS analysis of carbonyl compounds and their occurrence in diesel emissions, Anal. Chem., 2006, 78, 5086–5093 CrossRef CAS.
- M. Shimmo, P. Anttila, K. Hartonen, T. Hyötylänen, J. Paatero, M. Kulmala and M. L. Riekkola, Identification of organic compounds in atmospheric aerosol particles by on-line supercritical fluid extraction-liquid chromatography-gas chromatography-mass spectrometry, J. Chromatogr., A, 2004, 1022, 151–159 CrossRef CAS.
- S. W. Chung, A. Toriba, H. Y. Chung, B. P. Yu, T. Kameda, N. Tang, R. Kizu and K. Hayakawa, Activation of 5-lipoxygenase and NF-kappa B in the action of acenaphthenequinone by modulation of oxidative stress, Toxicol. Sci., 2008, 101, 152–158 Search PubMed.
- S. W. Chung, H. Y. Chung, A. Toriba, T. Kameda, N. Tang, R. Kizu and K. Hayakawa, An environmental quinoid polycyclic aromatic hydrocarbon, enaphthenequinone, modulates cyclooxygenase-2 expression through reactive oxygen species generation and nuclear factor kappa B activation in A549 cells, Toxicol. Sci., 2007, 95, 348–355 Search PubMed.
- P. Srivastava and D. Panda, Rotenone inhibits mammalian cell proliferation by inhibiting microtubule assembly through tubulin binding, FEBS J., 2007, 274, 4788–4801 Search PubMed.
- A. Das, S. Chakrabarty, D. Choudhury and G. Chakrabarti, 1,4-Benzoquinone (PBQ) induced toxicity in lung epithelial cells is mediated by the disruption of the microtubule network and activation of caspase-3, Chem. Res. Toxicol., 2010, 23, 1054–1066 Search PubMed.
- L. M. Landino, M. T. Koumas, C. E. Mason and J. A. Alston, Modification of tubulin cysteines by nitric oxide and nitroxyl donors alters tubulin polymerization activity, Chem. Res. Toxicol., 2007, 20, 1693–700 Search PubMed.
- A. Das, A. Bhattacharya and G. Chakrabarti, Cigarette smoke extract induces disruption of structure and function of tubulin-microtubule in lung epithelium cells and in vitro, Chem. Res. Toxicol., 2009, 22, 446–459 Search PubMed.
- P. Poggi, P. R. Rota and R. Boratto, The volatile fraction of cigarette smoke induces alterations in the human gingival fibroblast cytoskeleton, J. Periodontal Res., 2002, 37, 230–235 Search PubMed.
- H. Lodish, D. Baltimore, A. Berk, S. L. Zipursky, P. Matsudaira and J. Darnell, Molecular and Cellular Biology, ed. H. Lodish, D. Baltimore, A. Berk, S. L. Zipursky, P. Matsudaira and J. Darnell, 4th edn, W. H. Freeman, New York, 1999 Search PubMed.
- K. H. Downing and E. Nogales, Tubulin and microtubule structure, Curr. Opin. Cell Biol., 1998, 650(10), 16–22 Search PubMed.
- M. A. Jordon and L. Wilson, Mechanism of action of antitumor drugs that interact with microtubules and tubulin, Nat. Rev. Cancer, 2004, 4, 253–265 CrossRef CAS.
- A. Desai and T. Mitchison, Microtubule polymerization dynamics, Annu. Rev. Cell Dev. Biol., 1997, 13, 83–117 CrossRef CAS.
- A. M. Boutte, R. L. Woltjer, L. J. Zimmerman, S. L. Stamer, K. S. Montine, M. V. Manno, P. J. Cimino, D. C. Liebler and T. J. Montine, Selectively increased oxidative modifications mapped to detergent, insoluble forms of Abeta and beta, III tubulin in Alzheimer's disease, FASEB J., 2006, 20, 1473–1483 Search PubMed.
- M. Paula Barbosa, M. A. Tavares and A. Cadete Leite, A quantitative study of frontal cortex dendritic microtubules in patients with Alzheimer's disease, Brain Res., 1987, 417, 39–42 Search PubMed.
- B. Blanchard-Fillion, D. Prou, M. Polydoro, D. Spielberg, E. Tsika, Z. Wang, S. L. Hazen, M. Koval, S. Przedborski and H. Ischiropoulos, Metabolism of 3, nitrotyrosine induces apoptotic death in dopaminergic cells, J. Neurosci., 2006, 26, 6124–6130 Search PubMed.
- D. Bernhard, A. Csordas, B. Henderson, A. Rossmann, M. Kind and G. Wick, Cigarette smoke metal, catalyzed protein oxidation leads to vascular endothelial cell contraction by depolymerization of microtubules, FASEB J., 2005, 19, 1096–1107 Search PubMed.
- J. Roy, P. Pallepati, A. Bettaieb and D. A. Averill-Bates, Acrolein induces apoptosis through the death receptor pathway in A549 lung cells: role of p53, Can. J. Physiol. Pharmacol., 2010, 88, 353–368 Search PubMed.
- U. Deschla, J. Vogela and M. Aufderheide, Development of an in vitro exposure model for investigating the biological effects of therapeutic aerosols on human cells from the respiratory tract, Exp. Toxicol. Pathol., 2011, 63, 593–598 Search PubMed.
- P. A. Martorana, E. Cavarra, M. Lucattelli and G. Lungarella, Models for COPD involving cigarette smoke, Drug Discovery Today: Dis. Models, 2006, 3, 225–230 Search PubMed.
- P. Kirkham and I. Rahman, Oxidative stress in asthma and COPD: antioxidants as a therapeutic strategy, Pharmacol. Ther., 2006, 111, 476–494 Search PubMed.
- N. Dey, A. Das, A. Ghosh and I. B. Chatterjee, Activated charcoal filter effectively reduces p-benzosemiquinone from the mainstream cigarette smoke and prevents emphysema, J. Biosci., 2010, 35, 217–230 Search PubMed.
- B. Bhattacharyya and J. Wolff, Promotion of fluorescence upon binding of colchicine to tubulin, Proc. Natl. Acad. Sci. U. S. A., 1974, 71, 2627–2631 CAS.
- K. Gupta, J. Bishop, A. Peck, J. Brown, L. Wilson and D. Panda, Antimitotic antifungal compound benomyl inhibits brain microtubule polymerization and dynamics and cancer cell proliferation at mitosis by binding to a novel site in tubulin, Biochemistry, 2004, 43, 6645–6655 CrossRef CAS.
- E. Pfeiffer and M. Metzler, Interaction of p-benzoquinone and p-biphenoquinone with microtubule proteins in vitro, Chem.-Biol. Interact., 1996, 102, 37–53 Search PubMed.
- I. Santa-María, M. A. Smith, G. Perry, F. Hernández, J. Avila and F. J. Moreno, Effect of quinones on microtubule polymerization: a link between oxidative stress and cytoskeletal alterations in Alzheimer's disease, Biochim. Biophys. Acta, Mol. Basis Dis., 2005, 1740, 472–480 Search PubMed.
- E. I. H. Sayed, H. A. Hamid, A. A. Kassem and M. Shoukry, Synthesis and reactions of acenaphthenequinones-part-2. The reactions of acenaphthenequinones, Molecules, 2002, 7, 155–188 Search PubMed.
- M. M. Bradford, A rapid and sensitive method for the quantization of microgram quantities of protein utilizing the principle of protein-dye binding, Anal. Biochem., 1976, 72, 248–714 CrossRef CAS.
- J. R. Lakowicz, Principles of Fluorescence Spectroscopy, Kluwer Academic/Plenum Publishers, New York, 2nd edn, 1999, Page 35 of 53 Search PubMed.
- S. Mukherjee, B. R. Acharya, B. Bhattacharyya and G. Chakrabarti, Genistein arrests cell cycle progression of A549 cells at the G2/M phase and depolymerizes interphase microtubules through binding to a unique site of tubulin, Biochemistry, 2010, 49, 1702–1712 Search PubMed.
Footnote |
| † Electronic supplementary information (ESI) available. See DOI: 10.1039/c2tx00013j |
| This journal is © The Royal Society of Chemistry 2012 |