DOI:
10.1039/C2RA22019A
(Paper)
RSC Adv., 2012,
2, 11829-11835
Enhanced visible-light photocatalytic H2-production performance of multi-armed CdS nanorods
Received
3rd September 2012
, Accepted 2nd October 2012
First published on 2nd October 2012
Abstract
Visible light photocatalytic H2 production from aqueous solutions using solar light is of great importance from the viewpoint of solar energy conversion and storage and environment protection. In this study, a novel visible-light-driven photocatalyst, multi-armed CdS nanorods, was synthesized using a solvothermal method with dodecylamine as solvent. The prepared CdS nanorod samples showed especially high and stable photocatalytic H2-production activity with aqueous lactic acid solution as sacrificial reagent and Pt as co-catalyst under visible light irradiation. The CdS nanorod sample prepared at 140 °C for 12 h exhibited a high H2-production rate of 1.21 mmol h−1 (about 3.2 times higher than that of CdS nanoparticles (NPs) formed in water) with a very small amount of Pt (0.23 wt%) and a quantum efficiency (QE) of 51% at a wavelength of 420 nm. This high photocatalytic H2-production activity can be attributed to the synergistic effects of several factors such as the hexagonal phase structure, high surface area, great pore volume and good crystallization. Furthermore, the prepared CdS nanorod sample was photostable and no photocorrosion was observed after photocatalytic recycling. Our work demonstrated that multi-armed CdS nanorods were a promising candidate for the development of high-performance visible-light photocatalysts in photocatalytic H2 production and that the morphology of the CdS nanocrystals had a great effect on the photocatalytic H2-production activity.
1. Introduction
The global energy crisis and environmental problems caused by the depletion of fossil fuel reserves and combustion of fossil energy resources have led to the aggressive search for alternative energy resources.1–3 Hydrogen energy is a storable and environmentally friendly fuel for the future. Photocatalysis technology has been considered as a promising and useful way to convert solar energy into hydrogen energy since Fujishima and Honda first reported the photocatalytic splitting of water on TiO2 electrodes in 1972.4–8 There is great interest in the development of highly active and stable semiconductor photocatalysts to produce clean and renewable hydrogen by water splitting using solar energy.9–12 However, most of the photocatalysts developed for splitting water can solely absorb ultraviolet (UV) light, which accounts for only 4% of solar radiation energy. Thus, it is highly desirable to develop visible-light-driven photocatalysts, capable of using the more abundant visible light which accounts for about 43% of the solar spectrum.13 Chalcogenides are regarded as good candidates for visible-light photocatalysts. Among them, CdS has been intensively explored for photocatalytic H2 production because its band gap (2.4 eV) matches well with the spectrum of sunlight and the conduction band edge is more negative than the H2O/H2 redox potential.14
However, it is not easy to prepare a CdS photocatalyst with good photocatalytic H2-production activity due to many factors, such as preparation conditions, particle size, morphology, crystallinity, and so on, influencing photocatalytic activity.15 In order to obtain very active CdS photocatalysts, numerous efforts have been made to prepare various morphological CdS materials, including nanoporous nanosheets and hollow nanorods,16 nanowires,17 nanorods,18 solid and hollow nanospheres,19 nanosteps,20 and microtowers.21 Previous work has shown that bare CdS with good photocatalytic activity should possess the following material-related characteristics. Firstly, good crystallinity and large surface area are necessary. Secondly, cadmium sulfide nanocrystals with a hexagonal crystal structure have shown higher photocatalytic activity compared with pure cubic or a mixture of cubic and hexagonal phases.22,23 Thirdly, deposition of a noble metal co-catalyst on the semiconductor surface has proved to be a very effective method for enhancing photocatalytic H2-production activity.16,24 However, it is still an interesting challenge to synthesize highly active and stable CdS photocatalysts with controllable shape, size and crystallinity.
Recently, there have been some reports on the synthesis of CdS nanorod-based materials using thermal evaporation, hot colloidal and solvothermal routes.25–28 Among these approaches, the solvothermal method is relatively simple and has no need for pre-synthesis of the precursors. For example, Chen et al.29 and Gao et al.30 reported the solvothermal synthesis of multi-armed CdS nanorods in ethylenediamine solvent and Wang et al.31 successfully prepared CdS multipods through solvothermal synthesis in dodecylamine solvent. However, to the best of our knowledge, no previous work regarding the application of multi-armed CdS nanorods in photocatalytic H2 production has been reported. In this study, we report the synthesis of multi-armed CdS nanorods via a solvothermal route and their enhanced photocatalytic H2-production activity using lactic acid as a sacrificial reagent and Pt as a co-catalyst under visible light. Furthermore, the influence of morphology, specific surface area and crystallization on the photocatalytic H2-production activity of the CdS nanocrystals was investigated and discussed, and high visible-light photocatalytic H2-production performance was achieved using the multi-armed CdS nanorods as a photocatalyst.
2. Experimental
2.1 Sample preparation
All the reagents used in the experiments were of analytical grade (purchased from Shanghai Chemical Industrial Company) and used without further purification. Deionized (DI) water was used in all experiments. In a typical synthesis of multi-armed CdS nanorods, 10 mmol of Cd(OAc)2·2H2O was dissolved in 50 mL of dodecylamine (DAA) under magnetic stirring at about 50 °C to form a clear solution. After that, 15 mmol of thioacetamide (TAA) was added under stirring. The mixed solution was then transferred into a dried 100 mL Teflon-lined autoclave and maintained for 12 h at 100, 140 or 180 °C. After the reaction, the autoclave was allowed to cool to room temperature, and the yellow precipitate was collected by centrifugation and rinsed six times with absolute alcohol and distilled water alternately. The final product was dried in an oven at 60 °C for 10 h. The resulting samples obtained at 100, 140 and 180 °C were labeled as R100, R140 and R180, respectively. To investigate the effect of particle morphology on the H2-production efficiency, CdS nanoparticles were also prepared under the same conditions, except that dodecylamine was replaced by the same volume of distilled water. The nanoparticle samples obtained at 100, 140 and 180 °C were labeled as P100, P140 and P180, respectively. Table 1 summarizes the experimental conditions used in this work.
Table 1 Experimental conditions for the preparation of the samples studied and the corresponding physical properties
| Sample |
T/°C |
Morphology |
Phasea |
S
BET/m2 g−1 |
PVb/cm3 g−1 |
APSc/nm |
QE/% |
|
H: hexagonal, C: cubic.
PV: pore volume.
APS: average pore size.
|
| R100 |
100 |
Multi-armed rods |
H |
68 |
0.21 |
13 |
40.0 |
| R140 |
140 |
Multi-armed rods |
H |
46 |
0.31 |
27 |
51.0 |
| R180 |
180 |
Multi-armed rods |
H |
42 |
0.24 |
23 |
40.2 |
| P100 |
100 |
Nanoparticles |
C,H |
24 |
0.07 |
12 |
18.1 |
| P140 |
140 |
Nanoparticles |
C,H |
19 |
0.08 |
16 |
19.9 |
| P180 |
180 |
Nanoparticles |
C,H |
17 |
0.06 |
15 |
18.7 |
2.2 Characterization
X-ray diffraction (XRD) patterns were obtained on a D/Max-RB X-ray diffractometer (Rigaku, Japan) with Cu-Kα irradiation at a scan rate of 0.05° s−1. Transmission electron microscopy (TEM) and high-resolution transmission electron microscopy (HRTEM) analyses were conducted on a JEM-2100F electron microscope (JEOL, Japan). X-ray photoelectron spectroscopy (XPS) measurements were done on a VG ESCALAB MKII XPS system with a Mg-Kα source and a charge neutralizer. All the binding energies were referenced to the C1s peak at 285.0 eV of the surface adventitious carbon. The Brunauer–Emmett–Teller (BET) surface areas (SBET) of the samples were measured by nitrogen adsorption using a Micromeritics ASAP 2020 nitrogen adsorption apparatus (USA). All powdered samples were degassed in a vacuum environment at 100 °C prior to nitrogen adsorption measurements. The BET surface area was calculated by a multipoint BET method using adsorption data in the relative pressure (P/P0) range of 0.05–0.3. A desorption isotherm was used to determine the pore size distribution via the Barrett–Joyner–Halenda (BJH) method, assuming a cylindrical pore model. The volume of adsorbed nitrogen at the relative pressure (P/P0) of 0.99 was used to determine the pore volume and the average pore size. UV-vis diffused reflectance spectra of the samples were obtained using a UV-vis spectrophotometer (UV-2550, Shimadzu, Japan). BaSO4 was used as a reflectance standard in a UV-vis diffuse reflectance experiment.
2.3 Photocatalytic H2-production activity
The photocatalytic H2-production experiments were performed in a 100 mL Pyrex flask at ambient temperature and atmospheric pressure, and the three openings of the flask were sealed with silicone rubber septa. A 350 W Xe arc lamp through a UV-cutoff filter (≤420 nm) positioned 5 cm in front of the photocatalytic reactor was used as a visible-light source (22 cm away from the photocatalytic reactor). The focused intensity on the flask was measured using a visible-light radiometer (Model: FZ-A, China) was ca. 150 mW cm−2 in the wavelength range of 420–1000 nm. In a typical photocatalytic experiment, 50 mg of the catalyst was suspended in 80 mL of a mixed solution of lactic acid (8 mL) and water (72 mL) under magnetic stirring and side-irradiation. A certain amount of H2PtCl6·6H2O aqueous solution was dripped into the system to load Pt onto the surface of the photocatalyst by a photochemical reduction deposition method. Before irradiation, the suspensions were bubbled with nitrogen for 40 min to remove the dissolved oxygen and to ensure that the reaction system was under anaerobic conditions. Continuous magnetic stirring was applied at the bottom of the reactor in order to keep the photocatalyst particles suspended during the whole experiment. 0.4 mL of gas was intermittently sampled through the septum, and the hydrogen concentration was analyzed using a gas chromatograph (GC-14C, Shimadzu, Japan, TCD, nitrogen as a carrier gas and 5 Å molecular sieve column). All glassware was carefully rinsed with distilled water prior to use. The apparent quantum efficiency (QE) was also measured under the same photocatalytic reaction conditions except that the light source was different. Four LEDs (3 W, 420 nm, Shenzhen LAMPLIC Science Co. Ltd. China), positioned 1 cm away from the reactor in four different directions, were used as light sources to trigger the photocatalytic reaction. The focused intensity and areas on the flask for each LED were ca. 6.0 mW cm2 and 1 cm2, respectively. The QE was calculated according to eqn (1):| | 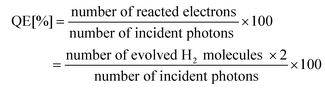 | (1) |
3. Results and discussion
3.1 Phase structures and morphology
Multi-armed CdS nanorods were synthesized by a solvothermal method in dodecylamine (see Experimental section and Table 1). XRD was used to investigate the changes in phase structure and crystallization of the prepared samples at different temperatures. Fig. 1 shows XRD patterns of the samples R100, R140 and R180. All the diffraction peaks can be easily indexed to the pure hexagonal phase of CdS with lattice parameters a = 4.1 Å and c = 6.7 Å, which are in good agreement with literature values (JCPDS No. 41-1049). In contrast, the preparation of CdS NPs samples (see Fig. 2b and c) by a hydrothermal method gave material with a mixture of cubic and hexagonal phases (see Fig. 2a). The prepared CdS NPs have sizes from ca. 20 to 50 nm and appear to be heavily aggregated (see Fig. 2b); single particles exhibit good crystallization (see Fig. 2c). As can be also seen in Fig. 1 and 2a, no diffraction peaks of impurities are found, indicating that the products are pure CdS. Further observation shows that with increasing temperature, the intensities of all diffraction peaks increase and there is a simultaneous reduction of their widths, suggesting the formation of longer CdS nanorods and enhancement of crystallization. It is interesting to note that the intensity of the (002) diffraction peak of the CdS nanorods is significantly enhanced, indicating a preferential orientation growth in the [001] direction (along the c-axis).
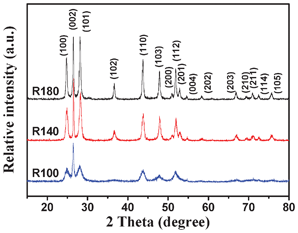 |
| | Fig. 1 XRD patterns of the samples R100, R140 and R180. | |
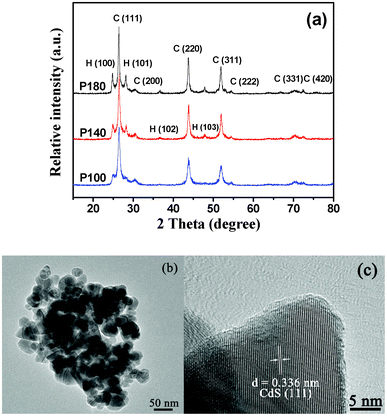 |
| | Fig. 2 XRD patterns (a) of the samples P100, P140 and P180, and TEM (b) and HRTEM images (c) of the P140 sample. | |
TEM images (Fig. 3) of sample R140 clearly indicate the formation of well-defined multi-armed CdS nanorods. The lengths of the nanorods are not uniform and ca. 70–150 nm, but the diameters of the nanorods are very uniform and about 13 nm. A HRTEM image (Fig. 3b) shows clearly the lattice fringes which are vertical to one of the arms. The lattice spacing (ca. 0.336 nm) observed in this image agrees well with the distance between the (002) lattice planes of hexagonal wurtzite-structured CdS, which confirms that CdS nanorods grow along the c-axis [001] direction. TEM and HRTEM images also indicate that the surfaces of nanorod are very smooth and of highly crystalline nature, respectively.
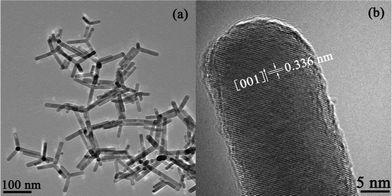 |
| | Fig. 3 (a) TEM and (b) HRTEM images of the sample R140. | |
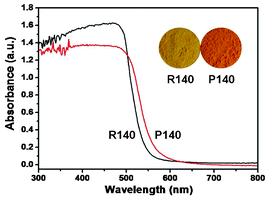 |
| | Fig. 4 UV-vis absorption spectra and the corresponding photos (insets) of the samples R140 and P140. | |
3.3 BET surface areas and pore size distributions
Generally, a catalyst with a high specific surface area and a big pore volume is indispensable in the enhancement of photocatalytic performance, due to the combined effects of many factors including more surface active sites and photocatalytic reaction centers, ease of transportation of reactant molecules and products through the interconnected porous network, and enhanced harvesting of irradiation light by multiple scattering within the porous framework.34 Herein, the porous structure and BET surface areas of CdS nanorods and NPs were investigated using nitrogen sorption measurements. Fig. 5 presents nitrogen adsorption–desorption isotherms and the corresponding pore-size distribution curves (inset in Fig. 5) of the R140 and P140 samples. The nitrogen adsorption–desorption isotherms for the R140 sample have isotherms of type IV and very narrow hysteresis loops at relative pressures close to unity, indicating the presence of large mesopores (mesopores have widths between 2 and 50 nm) and macropores (>50 nm). The isotherms of the R140 sample exhibit H3 hysteresis loops associated with the presence of slit-like pores due to aggregation of nanorods.35 The corresponding pore-size distribution curve (inset in Fig. 5) of the R140 sample exhibits a wide pore-size distribution from 3 to 269 nm in the mesoporous and macroporous region, which will provide efficient transport pathways for reactant and product molecules.36 However, the isotherm of the P140 sample is slightly different from that of the R140 sample, which has two hysteresis loops, indicating bimodal pore-size distributions in the mesoporous and macroporous regions. The shapes of the two hysteresis loops are different from each other. At low relative pressures between 0.7 and 0.9, the hysteresis loops are of type H2, which can be observed for pores with narrow necks and wider bodies (ink-bottle pores).37 However, at high relative pressures between 0.9 and 1.0, the shape of the hysteresis loop is of a type H3, associated with plate-like particles giving rise to narrow slit-shaped pores.37 The P140 sample shows a bimodal pore-size distribution, consisting of fine intra-aggregated pores with a maximum pore diameter of 9.0 nm, and larger interaggregated pores with a maximum pore diameter of 46.0 nm. The above mentioned hierarchically organized porous structures might be extremely useful in photocatalytic hydrogen production as they would provide efficient transport pathways to the interior void space. Further observations from Fig. 5 show that at high P/P0 range (approaching 1.0), the isotherms of the R140 sample shift up and its hysteresis loop is bigger compared to the P140 sample, indicating that the R140 sample has a bigger pore volume. This also implies that multi-armed CdS nanorods are more beneficial for the formation of mesopores and macropores than CdS NPs. The BET specific surface areas, pore volumes, and average pore size of all the samples are summarized in Table 1. The BET surface area of both the nanorod and NP samples gradually decreases with increasing reaction temperature. This is ascribed to the enhancement of crystallization according to the XRD results.
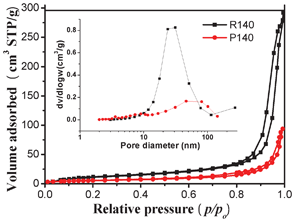 |
| | Fig. 5 Nitrogen adsorption–desorption isotherms and the corresponding pore-size distribution curves (inset) of the samples R140 and P140. | |
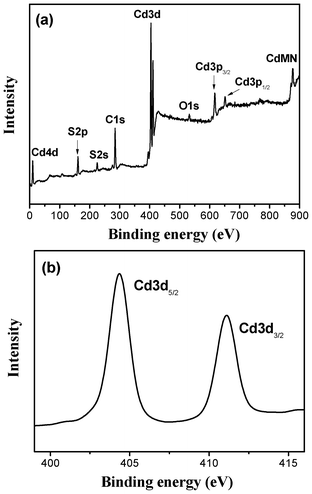
3.4 XPS analysis
The surface element composition of the prepared CdS nanorods and the chemical status of Cd in the samples were analyzed by XPS. Fig. 6a presents a typical XPS survey spectrum of the R140 sample. Cd, S, O, and C are observed and the corresponding photoelectron peaks appear at binding energies of 404.3 (Cd3d), 160.8 (S2p), 532 (O1s) and 285 eV (C1s), respectively. The atomic ratio of Cd to S is almost 1![[thin space (1/6-em)]](https://www.rsc.org/images/entities/char_2009.gif) :1, which is in good agreement with the nominal atomic composition of CdS. The carbon peak is attributed to the residual carbon from the sample and adventitious hydrocarbon from the XPS instrument itself. Fig. 6b presents the high-resolution XPS spectrum of Cd3d for the R140 sample. The binding energies corresponding to Cd3d5/2 and Cd3d3/2 are 404.3 and 411.1 eV, respectively, indicative of Cd2+ in CdS. The 6.8 eV difference between the binding energies the of Cd3d5/2 and Cd3d3/2 peaks is also characteristic of +2 Cd3d states.38 The XPS results are consistent with the XRD results. Furthermore, the strong peak at 160.8 eV is assigned to the binding energy of S2p, which is a typical value for metal sulfides.36
:1, which is in good agreement with the nominal atomic composition of CdS. The carbon peak is attributed to the residual carbon from the sample and adventitious hydrocarbon from the XPS instrument itself. Fig. 6b presents the high-resolution XPS spectrum of Cd3d for the R140 sample. The binding energies corresponding to Cd3d5/2 and Cd3d3/2 are 404.3 and 411.1 eV, respectively, indicative of Cd2+ in CdS. The 6.8 eV difference between the binding energies the of Cd3d5/2 and Cd3d3/2 peaks is also characteristic of +2 Cd3d states.38 The XPS results are consistent with the XRD results. Furthermore, the strong peak at 160.8 eV is assigned to the binding energy of S2p, which is a typical value for metal sulfides.36
3.5 Photocatalytic activity
The applicability of chalcogenide nanomaterials in H2 production has been widely explored.16,39 In this work, the photocatalytic H2 production of the samples studied was evaluated under visible light irradiation using lactic acid as scavenger and Pt as co-catalyst. Control experiments indicated that no appreciable H2 was measured in the absence of either irradiation or photocatalyst, suggesting that H2 was only produced by photocatalytic reactions on the photocatalyst under visible light. Fig. 7 displays a comparison of photocatalytic H2-production rates for the multi-armed CdS nanorods and CdS NPs loaded with a very small amount of Pt (0.23 wt%) under visible-light irradiation. As can be seen from this figure, the H2-production rate of the nanorod samples is significantly greater than that of the NPs samples. This result clearly demonstrates a substantial enhancement of the photocatalytic H2-production activity of multi-armed CdS nanorods. This is ascribed to the following three factors: (1) the CdS nanorods feature increased surface area and pore volume, which provides a larger amount of surface active sites for adsorption of reactant molecules and facilitates mass transfer, making the photocatalytic process more efficient. (2) Hexagonal CdS nanocrystals usually show higher photocatalytic H2-production activity than cubic CdS nanocrystals.22 (3) CdS nanorods with a short bulk-to-surface diffusion distance due to small diameter are beneficial to the migration of photogenerated electrons and holes to the surface and the suppression of electron–hole recombination in the bulk. Consequently, it is not surprising that multi-armed CdS nanorods exhibit enhanced photocatalytic H2-production activity.
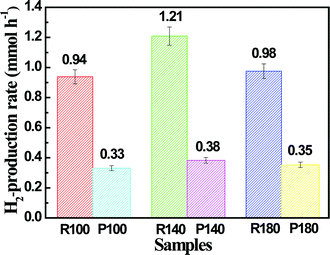 |
| | Fig. 7 Comparison of the photocatalytic H2-production activity of the samples R100, R140, R180, P100, P140 and P180 in aqueous lactic acid solution under visible-light irradiation. | |
Among the three nanorod samples, the R140 sample shows the highest photocatalytic activity, giving a H2-production rate of 1.21 mmol h−1 with a quantum efficiency (QE) of 51%, which obviously exceeded that of the samples R100 and R180. This high photoactivity can be ascribed to the balance between specific surface areas and crystallization. It is well known that specific surface areas and crystallization are two conflicting factors influencing the photocatalytic activity. For example, amorphous TiO2 powders usually show a large specific surface area, but a poor or negligible photocatalytic activity. This is due to amorphous TiO2 containing a large amount of crystalline defects (i.e. imperfections, impurities, dangling bonds, or microvoids) located on the surface and in the bulk of particles, which enhances the recombination rate of photogenerated electrons and holes, thus causing poor photoactivity.40 Therefore, a large surface area is an important factor influencing photocatalytic activity, but not a decisive factor. This indicates that crystallization is another important requirement for high photocatalytic activity. The R100 sample exhibits high specific surface areas, but relatively weak crystallization (see Table 1 and Fig. 1). Therefore, it is not surprising that its activity is lower than that of the R140 sample. Furthermore, the R180 sample exhibits good crystallization, but relatively low specific surface areas (see Fig. 1 and Table 1) and its activity is also lower than that of the R140 sample. Thus, it is easy to understand that the R140 sample shows the highest photocatalytic activity because it possesses a relatively large surface area and good crystallization.41 To the best of our knowledge, this is the first report of the preparation and enhanced visible-light photocatalytic H2-production activity of multi-armed CdS nanorods in aqueous lactic acid solution. We believe that the prepared porous multi-armed CdS nanorods are also of great interest in solar cells, catalysis, separation technology, biomedical engineering and nanotechnology.
Fig. 8 presents the dependence of the rate of hydrogen evolution on the amount of Pt co-catalyst loaded on the R140 sample. In general, deposition of noble metal Pt onto a semiconductor surface can efficiently enhance the separation of the photogenerated electrons and holes, prolonging their lifetime, and meanwhile suppress the reverse reaction between O2 and H2, which results in the enhancement of photocatalytic H2-production activity.24 It should be noted that in the absence of Pt, the R140 sample shows very low or negligible photocatalytic H2-production activity due to the rapid recombination of photogenerated electrons and holes in pure CdS. Moreover, the fast backward reaction (recombination of hydrogen and oxygen into water), and the presence of a large H2-production overpotential on the CdS surface make CdS alone inactive in photocatalytic water splitting. However, in the presence of a small amount of Pt (0.08 wt%), the activity of the R140 sample is significantly enhanced and increased by up to 51.5 times. The photocatalytic activity of the sample further increased with increasing Pt content from 0.08 to 0.23 wt%. The highest photocatalytic activity, 1.21 mmol h−1, was achieved at a Pt content of 0.23 wt%; this value exceeds that of pure CdS nanorods without Pt by 60.5 times. A further increase in Pt content causes a decrease of the photocatalytic activity. This is due to an increase in the opacity and light scattering, leading to a decrease in irradiation passing through the reaction suspension solution.24,42 Other explanations are: (i) partial blockage of the CdS nanorod surface active sites due to deposition of excessive Pt and (ii) deterioration of the catalytic properties of Pt metal NPs due to their aggregation and growth.24 Therefore, it is not surprising that the photocatalytic activity of the sample decreases in the presence of excessive Pt. This also suggests that a suitable loading content of Pt is crucial for optimizing the photocatalytic activity of CdS nanorods.
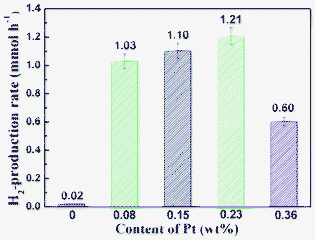 |
| | Fig. 8 Effect of the Pt loading content on the H2-production rate of sample R140 in aqueous lactic acid solution. | |
As is known, metal sulfide photocatalysts are unstable in the water-oxidation reaction under visible-light because S2− is more susceptible to oxidation than water, thereby causing photocorrosion of the photocatalyst.9 Furthermore, common hole scavengers such as methanol and ethanol are excellent fuels themselves and thus their utilization as hole scavengers is meaningless. Thus, lactic acid (also known as milk acid, a chemical compound that plays a role in various biochemical processes) aqueous solution was chosen in this work in order to suppress the photocorrosion of the CdS catalyst. The stability of the CdS nanorods (sample R140) was evaluated by performing recycling experiments of the photocatalyst under similar conditions (see Fig. 9). After four recycles, H2 evolution did not decrease, which indicates good stability during the photocatalytic production of H2 from lactic acid aqueous solution.
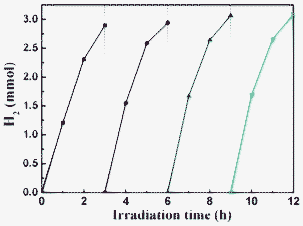 |
| | Fig. 9 Time course of photocatalytic production of H2 from lactic acid aqueous solutions over the sample R140 under visible-light irradiation. | |
4. Conclusions
In summary, a facile solvothermal method was developed for the preparation of multi-armed CdS nanorods, which showed high photocatalytic H2-production efficiency from lactic acid aqueous solution under visible light with Pt as co-catalyst. The photocatalytic H2 production of CdS nanorods could be dramatically improved by loading a low amount of Pt and the optimal Pt content was found to be 0.23 wt%. The morphology of the CdS nanocrystals exhibited a significant influence on the pore volume and photocatalytic H2-production activity. Multi-armed CdS nanorods were more beneficial to the formation of mesopores and macropores, and had much better photocatalytic activity than CdS NPs. Hydrothermal temperatures also had an obvious influence on the photoactivity of CdS, and multi-armed CdS nanorods prepared at 140 °C showed the highest photocatalytic activity due to the combined effect of several factors including the phase structure, surface area, pore volume and crystallization. The highest visible-light photocatalytic H2-production rate for the R140 sample was 1.21 mmol h−1 with a quantum efficiency of 51% at 420 nm using 0.23 wt% Pt as co-catalyst, which exceeded that of CdS NPs (P140) by 3.2 times. After four recycling experiments of the photocatalytic hydrogen production for the R140 sample in the presence of lactic acid, the CdS nanorods did not exhibit any great loss in the photocatalytic activity, confirming that the prepared CdS nanorods were stable and not photocorroded. The prepared multi-armed CdS nanorods are also of great interest for solar cells, photonic and optoelectronic devices, sensors, catalysis, biomedical engineering and nanotechnology.
Acknowledgements
This work was partially supported by the 973 Program (2013CB632402 and 2009CB939704), the 863 Program (2012AA062701), NSFC (51072154, 21177100 and 51272199) and the Natural Science Foundation of Hubei Province (2010CDA078). This work was also financially supported by the Fundamental Research Funds for the Central Universities and the Self-determined and Innovative Research Funds of SKLWUT.
References
- M. Gratzel, Nature, 2001, 414, 338–344 CrossRef CAS.
- A. Ishikawa, T. Takata, J. N. Kondo, M. Hara, H. Kobayashi and K. Domen, J. Am. Chem. Soc., 2002, 124, 13547–13553 CrossRef CAS.
- R. D. Cortright, R. R. Davda and J. A. Dumesic, Nature, 2002, 418, 964–967 CrossRef CAS.
- A. Fujishima and K. Honda, Nature, 1972, 238, 37–38 CrossRef CAS.
-
(a) Q. J. Xiang, J. G. Yu and M. Jaroniec, J. Am. Chem. Soc., 2012, 134, 6575–6578 CrossRef CAS;
(b) S. W. Liu, J. G. Yu and M. Jaroniec, J. Am. Chem. Soc., 2010, 132, 11914–11916 CrossRef CAS;
(c) Q. J. Xiang, J. G. Yu and M. Jaroniec, Chem. Soc. Rev., 2012, 41, 782 RSC;
(d) J. Zhang, J. G. Yu, M. Jaroniec and J. R. Gong, Nano Lett., 2012, 12, 4584 CrossRef CAS.
- M. R. Hoffmann, S. T. Martin, W. Choi and D. W. Bahnemann, Chem. Rev., 1995, 95, 69–96 CrossRef CAS.
- J. H. Park, S. Kim and A. J. Bard, Nano Lett., 2006, 6, 24–28 CrossRef CAS.
-
(a) J. G. Yu, Y. Hai and B. Cheng, J. Phys. Chem. C, 2011, 115, 4953–4958 CrossRef CAS;
(b) J. G. Yu, B. Yang and B. Cheng, Nanoscale, 2012, 4, 2670–2677 RSC;
(c) J. G. Yu and J. R. Ran, Energy Environ. Sci., 2011, 4, 1364–1371 RSC.
- A. Kudo and Y. Miseki, Chem. Soc. Rev., 2009, 38, 253–278 RSC.
- Z. G. Zou, J. H. Ye, K. Sayama and H. Arakawa, Nature, 2001, 414, 625–627 CrossRef CAS.
-
(a) J. Zhang, J. Yu, Y. Zhang, Q. Li and J. R. Gong, Nano Lett., 2011, 11, 4774–4779 CrossRef CAS;
(b) J. G. Yu, J. Zhang and M. Jaroniec, Green Chem., 2010, 12, 1611–1614 RSC.
- H. Kato, K. Asakura and A. Kudo, J. Am. Chem. Soc., 2003, 125, 3082–3089 CrossRef CAS.
-
(a) Q. Li, B. Guo, J. Yu, J. Ran, B. Zhang, H. Yan and J. R. Gong, J. Am. Chem. Soc., 2011, 133, 10878–10884 CrossRef CAS;
(b) Q. J. Xiang, J. G. Yu, W. G. Wang and M. Jaroniec, Chem. Commun., 2011, 47, 6906–6908 RSC.
-
(a) M. Matsumura, Y. Saho and H. Tsubomura, J. Phys. Chem., 1983, 87, 3807–3808 CrossRef CAS;
(b) Y. Hong, J. Zhang, X. Wang, Y. Wang, Z. Lin, J. Yu and F. Huang, Nanoscale, 2012, 4, 2859–2862 RSC.
- X. Chen, S. Shen, L. Guo and S. S. Mao, Chem. Rev., 2010, 110, 6503–6570 CrossRef CAS.
- N. Bao, L. Shen, T. Takata and K. Domen, Chem. Mater., 2008, 20, 110–117 CrossRef CAS.
- N. Bao, L. Shen, T. Takata, D. Lu and K. Domen, Chem. Lett., 2006, 35, 318–319 CrossRef CAS.
- C. M. Janet and R. P. Viswanath, Nanotechnology, 2006, 17, 5271–5277 CrossRef CAS.
- C. Li, J. Yuan, B. Han and W. Shangguan, Int. J. Hydrogen Energy, 2011, 36, 4271–4279 CrossRef CAS.
- D. Jing and L. Guo, J. Phys. Chem. B, 2006, 110, 11139–11145 CrossRef CAS.
- M. Muruganandham, Y. Kusumoto, C. Okamoto, A. Muruganandham, M. Abdulla-Al-Mamun and B. Ahmmad, J. Phys. Chem. C, 2009, 113, 19506–19517 CAS.
- N. Bao, L. Shen, T. Takata, K. Domen, A. Gupta, K. Yanagisawa and C. A. Grimes, J. Phys. Chem. C, 2007, 111, 17527–17534 CAS.
- M. Matsumura, S. Furukawa, Y. Saho and H. Tsubomura, J. Phys. Chem., 1985, 89, 1327–1329 CrossRef CAS.
- J. G. Yu, L. Qi and M. Jaroniec, J. Phys. Chem. C, 2010, 114, 13118–13125 CAS.
- M. Zhang, T. Zhai, X. Wang, Y. Ma and J. Yao, Cryst. Growth Des., 2010, 10, 1201–1206 CAS.
- Y. W. Jun, S. M. Lee, N. J. Kang and J. Cheon, J. Am. Chem. Soc., 2001, 123, 5150–5151 CrossRef CAS.
- Y. C. Li, X. H. Li, C. H. Yang and Y. F. Li, J. Mater. Chem., 2003, 13, 2641–2648 RSC.
- J. Joo, H. B. Na, T. Yu, J. H. Yu, Y. W. Kim, F. X. Wu, J. Z. Zhang and T. Hyeon, J. Am. Chem. Soc., 2003, 125, 11100–11105 CrossRef CAS.
- M. Chen, Y. Xie, J. Lu, Y. J. Xiong, S. Y. Zhang, Y. T. Qian and X. M. Liu, J. Mater. Chem., 2002, 12, 748–753 RSC.
- F. Gao, Q. Lu, S. Xie and D. Zhao, Adv. Mater., 2002, 14, 1537–1540 CrossRef CAS.
- X. Wang, Z. Feng, D. Fan, F. Fan and C. Li, Cryst. Growth Des., 2010, 10, 5312–5318 CAS.
- S. Shen, L. Guo, X. Chen, F. Ren and S. S. Mao, Int. J. Hydrogen Energy, 2010, 35, 7110–7115 CrossRef CAS.
- L. Shen, N. Bao, P. E. Prevelige and A. Gupta, J. Phys. Chem. C, 2010, 114, 2551–2559 CAS.
-
(a) J. G. Yu, S. W. Liu and M. H. Zhou, J. Phys. Chem. C, 2008, 112, 2050–2057 CrossRef CAS;
(b) J. G. Yu, L. J. Zhang, B. Cheng and Y. R. Su, J. Phys. Chem. C, 2007, 111, 10582–10589 CrossRef CAS;
(c) J. G. Yu, Y. R. Su and B. Cheng, Adv. Funct. Mater., 2007, 17, 1984–1990 CrossRef CAS.
-
(a) K. S. W. Sing, D. H. Everett, R. A. W. Haul, L. Moscou, R. A. Pierotti, J. Rouquerol and T. Siemieniewska, Pure Appl. Chem., 1985, 57, 603–619 CrossRef CAS;
(b) J. R. Ran, J. G. Yu and M. Jaroniec, Green Chem., 2011, 13, 2708–2713 RSC.
-
(a) W. G. Wang, J. G. Yu, Q. J. Xiang and B. Cheng, Appl.
Catal., B, 2012, 119–120, 109–116 CAS;
(b) J. Zhang, S. W. Liu, J. G. Yu and M. Jaroniec, J. Mater. Chem., 2011, 21, 14655–14662 RSC.
- L. F. Qi, J. G. Yu and M. Jaroniec, Phys. Chem. Chem. Phys., 2011, 13, 8915–8923 RSC.
- D. H. Wang, L. Wang and A. W. Xu, Nanoscale, 2012, 4, 2046–2053 RSC.
- J. G. Yu and J. Zhang, Dalton Trans., 2010, 39, 5860–5867 RSC.
- J. S. Jang, U. A. Joshi and J. S. Lee, J. Phys. Chem. C, 2007, 111, 13280–13287 CAS.
- Q. J. Xiang, J. G. Yu and M. Jaroniec, Nanoscale, 2011, 3, 3670–3678 RSC.
|
| This journal is © The Royal Society of Chemistry 2012 |
Click here to see how this site uses Cookies. View our privacy policy here.