Light–thermal conversion organic shape-stabilized phase-change materials with broadband harvesting for visible light of solar radiation†
Yunming
Wang
,
Bingtao
Tang
* and
Shufen
Zhang
State Key Laboratory of Fine Chemicals, Dalian University of Technology, P.O. Box 89, West Campus, 2 Linggong Rd, Dalian, 116024, China. E-mail: tangbt@dlut.edu.cn; Fax: 86-411-84986264; Tel: 86-411-84986267
First published on 28th September 2012
Abstract
To achieve highly efficient utilization of sunlight, organic shape-stabilized phase change materials (OSPCMs) with light–thermal conversion and visible light (solar radiation) harvesting abilities were designed and synthesized through color matching (yellow, red, and blue) according to the solar irradiation energy density. These materials exhibited excellent rapid and broadband visible light-harvesting, light–thermal conversion, thermal energy storage, and form-stable (remained in the same state upon transition) effects. The chemical structures of OSPCMs were verified using Fourier transform infrared and proton nuclear magnetic resonance techniques. Differential scanning calorimetry results indicated that the melting temperatures and latent heats of the synthesized OSPCMs ranged from 48 °C to 64 °C and from 107.1 J g−1 to 138.5 J g−1, respectively. The novel materials show a reversible (more than 200 cycles) phase transition (crystalline state change) via ON/OFF switching of visible light irradiation. Colour matching showed that the light-to-heat conversion and thermal energy storage efficiency (η) of the OSPCMs significantly improved upon solar irradiation.
Introduction
Solar energy is clean, inexhaustible, and readily available.1,2 Thus, harnessing solar energy is one of the most promising ways to address today's energy issues.3–8 Solar-thermal energy,9,10 which is a direct and efficient application of solar radiation, is of particular interest. However, the intermittence of solar irradiation in time and space is difficult to predict. Addressing this challenge requires considerable innovation in technology, which in turn requires advances in the underlying basic science, particularly in the storage of solar energy.11,12 For example, a phase transition was introduced to materials with high energy storage densities and small temperature changes during thermal energy charge/discharge. The new phase change materials have some smart features, such as latent heat storage (LHS) with high storage density, shape stability, and adjustable phase transition temperature.13–18 Thus, phase transition heat storage is an effective solution to intermittent solar irradiation in time and space. However, the other fatal drawback of solar thermal energy applications is that visible light (which accounts for approximately 44% of solar radiation)19 almost cannot be directly or effectively applied because of low thermal efficiency.12 Thus, harvesting and converting visible sunlight into thermal energy could be a highly promising way of improving the efficiency of solar energy utilization. Recently, we first reported a strategy in which we have a combination of light-to-heat conversion and phase change energy storage based on a dye and a phase change material. In our previous communication, the new materials converted the 500 nm to 650 nm light band into stored heat energy through the phase transition.20 In this paper, organic shape-stabilized phase change materials (OSPCMs) with broadband visible light (400 nm to 700 nm) harvesting ability were designed and synthesized through color matching (yellow, red, and blue) according to the solar irradiation energy density.21 The visible sunlight utilization efficiency was also further improved. Using photothermal calculation methods, the visible light-to-heat conversion and energy storage efficiencies of color-matching OSPCMs were determined (η > 0.71) under visible light irradiation (from 400 nm to 700 nm), which were higher than that (η < 0.62) of PEG 10![[thin space (1/6-em)]](https://www.rsc.org/images/entities/char_2009.gif) 000-co-Dye (yellow, red or blue) (ESI Fig. S1†). Therefore, color-matching OSPCMs are an essential prerequisite for the realization of the highly efficient utilization of solar radiation.
000-co-Dye (yellow, red or blue) (ESI Fig. S1†). Therefore, color-matching OSPCMs are an essential prerequisite for the realization of the highly efficient utilization of solar radiation.
Experimental
Materials
Analytical-grade polyethylene glycol (PEG, Mn = 10![[thin space (1/6-em)]](https://www.rsc.org/images/entities/char_2009.gif) 000, Shanghai National Medicines Co. Inc., China) was dried at 80 °C under high vacuum (−0.1 kPa) for 48 h. Analytical-grade toluene (Tianjin National Medicines Co. Inc., China) was dried for 48 h using a 5 Å molecular sieve and then distilled prior to use. Analytical-grade toluene-2,4-diisocyanate (TDI, Tianjin Kemiou Chemical Reagent Co. Inc., China) and dibutyltin dilaurate (DBT, Tianjin Kemiou Chemical Reagent Co. Inc., China) were used as received. All other reagents were of analytical grade and used as received.
000, Shanghai National Medicines Co. Inc., China) was dried at 80 °C under high vacuum (−0.1 kPa) for 48 h. Analytical-grade toluene (Tianjin National Medicines Co. Inc., China) was dried for 48 h using a 5 Å molecular sieve and then distilled prior to use. Analytical-grade toluene-2,4-diisocyanate (TDI, Tianjin Kemiou Chemical Reagent Co. Inc., China) and dibutyltin dilaurate (DBT, Tianjin Kemiou Chemical Reagent Co. Inc., China) were used as received. All other reagents were of analytical grade and used as received.
Synthesis
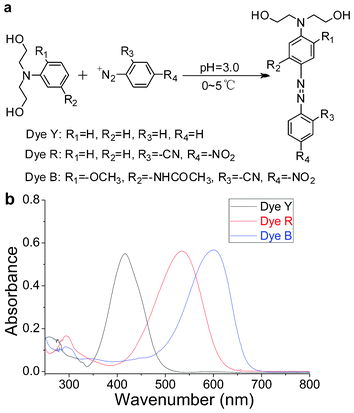 | ||
| Fig. 1 (a) Chemical structures and synthetic scheme for dyes. (b) UV-Vis spectra of dyes (in tetrahydrofuran). | ||
Dye Y. A mixture of aniline (10.0 mmol), 2.5 ml concentrated hydrochloric acid, and 20.0 ml H2O was stirred vigorously. The resultant solution was cooled in an ice bath to below 5.0 °C and stirred as sodium nitrite (NaNO2, 0.73 g, 10.5 mmol) in 5 ml H2O was rapidly added. The reaction mixture was stirred at 5.0 °C until a clear solution was formed. The solution was added to 30.0 ml H2O that contained N,N-dihydroxyethylaniline (1.81 g, 10.0 mmol) and 1.5 ml concentrated hydrochloric acid while maintaining the temperature at below 5.0 °C. The resulting solution was stirred at 0 °C to 5.0 °C for 4.5 h. The pH of the reaction solution was then adjusted to 7.0 by adding 10% sodium carbonate (Na2CO3) solution. The solid was filtered and dried to yield a yellow solid. The Dye Y was obtained by recrystallization in a mixed solution of ethanol and water (Vethanol![[thin space (1/6-em)]](https://www.rsc.org/images/entities/char_2009.gif) :
:![[thin space (1/6-em)]](https://www.rsc.org/images/entities/char_2009.gif) Vwater = 1
Vwater = 1![[thin space (1/6-em)]](https://www.rsc.org/images/entities/char_2009.gif) :
:![[thin space (1/6-em)]](https://www.rsc.org/images/entities/char_2009.gif) 1). Yield, 83.1%. ξDye
1). Yield, 83.1%. ξDye![[thin space (1/6-em)]](https://www.rsc.org/images/entities/char_2009.gif) Y = 31
Y = 31![[thin space (1/6-em)]](https://www.rsc.org/images/entities/char_2009.gif) 866.
866.
Dye R. NaNO2 (0.69 g, 10 mmol) was dissolved in 8 ml conc. H2SO4 at 0 °C to 5 °C and then heated to 70 °C for 15 min. The reaction mixture was then cooled to 0 °C. 2-Cyan-4-nitroaniline (1.63 g, 10 mmol) was added to the above solution over 30 min. After stirring for 12 h, the diazonium salt was dropped into 30 ml H2O that contained N,N-dihydroxyethylaniline (1.81 g, 10.0 mmol) and 1.5 ml concentrated hydrochloric acid while maintaining the temperature at below 5.0 °C. The resulting solution was stirred at 0 °C to 5.0 °C for 4.5 h. The pH of the reaction solution was then adjusted to 7.0 by adding 10% Na2CO3 solution. The solid was filtered and dried to yield a red solid. The Dye R was obtained through recrystallization in a mixed solution of ethanol and water (Vethanol![[thin space (1/6-em)]](https://www.rsc.org/images/entities/char_2009.gif) :
:![[thin space (1/6-em)]](https://www.rsc.org/images/entities/char_2009.gif) Vwater = 1
Vwater = 1![[thin space (1/6-em)]](https://www.rsc.org/images/entities/char_2009.gif) :
:![[thin space (1/6-em)]](https://www.rsc.org/images/entities/char_2009.gif) 1). Yield, 81.6%. ξDye
1). Yield, 81.6%. ξDye![[thin space (1/6-em)]](https://www.rsc.org/images/entities/char_2009.gif) R = 44
R = 44![[thin space (1/6-em)]](https://www.rsc.org/images/entities/char_2009.gif) 011.
011.
Dye B was synthesized and purified according to the previously described procedure for Dye R. Yield, 78.3%. ξDye![[thin space (1/6-em)]](https://www.rsc.org/images/entities/char_2009.gif) B = 47
B = 47![[thin space (1/6-em)]](https://www.rsc.org/images/entities/char_2009.gif) 773.
773.
![[thin space (1/6-em)]](https://www.rsc.org/images/entities/char_2009.gif) 000, TDI, and DBT in freshly distilled toluene were mixed with stirring for 6 h under N2 at 40 °C to 45 °C to produce an NCO-terminated prepolymer (Compound 1). A stoichiometric amount of the chain extender Compound 2 was added, and the reaction was continued for 6 h at 100 °C. The molecular weights of the PEG 10
000, TDI, and DBT in freshly distilled toluene were mixed with stirring for 6 h under N2 at 40 °C to 45 °C to produce an NCO-terminated prepolymer (Compound 1). A stoichiometric amount of the chain extender Compound 2 was added, and the reaction was continued for 6 h at 100 °C. The molecular weights of the PEG 10![[thin space (1/6-em)]](https://www.rsc.org/images/entities/char_2009.gif) 000-co-Dye Y/R/B were evaluated from the intrinsic viscosity (η) that was measured in toluene solvent using an Ubbelohde capillary viscometer at 25 °C. According to the literature,22 the viscosity-average molecular weight (Mv) of the PEG 10
000-co-Dye Y/R/B were evaluated from the intrinsic viscosity (η) that was measured in toluene solvent using an Ubbelohde capillary viscometer at 25 °C. According to the literature,22 the viscosity-average molecular weight (Mv) of the PEG 10![[thin space (1/6-em)]](https://www.rsc.org/images/entities/char_2009.gif) 000-co-Dye Y/R/B was related to the intrinsic viscosity based on eqn (1):
000-co-Dye Y/R/B was related to the intrinsic viscosity based on eqn (1):|η| = 2.1 × 10⁻⁴ × ![[M with combining macron]](https://www.rsc.org/images/entities/i_char_004d_0304.gif) v0.82 v0.82 | (1) |
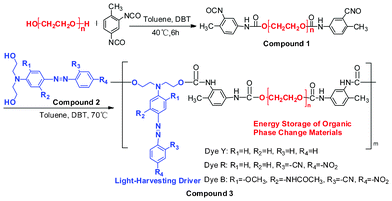 | ||
| Scheme 1 Chemical structures and synthetic scheme for solar thermal conversion materials with phase-change energy storage. | ||
The obtained reaction solution of the OSPCMs with a known azo bond concentration was mixed and stirred evenly according to the solar irradiation energy density. The color-matching OSPCMs were vacuum-evaporated and further dried for 48 h at 80 °C under vacuum (−0.1 kPa) prior to testing. Throughout the manuscript, Compound 3 is abbreviated to OSPCMs (Table 1).
| Sample | Compositiona | M v (× 107)b |
|---|---|---|
a Molar ratios of polyethylene glycol (PEG), toluene-2,4-diisocyanate (TDI), and the dye.
b The viscosity-average molecular weight (Mv) of the PEG 10![[thin space (1/6-em)]](https://www.rsc.org/images/entities/char_2009.gif) 000-co-Dye Y/R/B. 000-co-Dye Y/R/B.
|
||
PEG 10![[thin space (1/6-em)]](https://www.rsc.org/images/entities/char_2009.gif) 000-co-Dye Y 000-co-Dye Y |
PEG 10![[thin space (1/6-em)]](https://www.rsc.org/images/entities/char_2009.gif) 000 000![[thin space (1/6-em)]](https://www.rsc.org/images/entities/char_2009.gif) : :![[thin space (1/6-em)]](https://www.rsc.org/images/entities/char_2009.gif) TDI TDI![[thin space (1/6-em)]](https://www.rsc.org/images/entities/char_2009.gif) : :![[thin space (1/6-em)]](https://www.rsc.org/images/entities/char_2009.gif) Dye Y = 1 Dye Y = 1![[thin space (1/6-em)]](https://www.rsc.org/images/entities/char_2009.gif) : :![[thin space (1/6-em)]](https://www.rsc.org/images/entities/char_2009.gif) 2 2![[thin space (1/6-em)]](https://www.rsc.org/images/entities/char_2009.gif) : :![[thin space (1/6-em)]](https://www.rsc.org/images/entities/char_2009.gif) 1 1 |
2.16 |
PEG 10![[thin space (1/6-em)]](https://www.rsc.org/images/entities/char_2009.gif) 000-co-Dye R 000-co-Dye R |
PEG 10![[thin space (1/6-em)]](https://www.rsc.org/images/entities/char_2009.gif) 000 000![[thin space (1/6-em)]](https://www.rsc.org/images/entities/char_2009.gif) : :![[thin space (1/6-em)]](https://www.rsc.org/images/entities/char_2009.gif) TDI TDI![[thin space (1/6-em)]](https://www.rsc.org/images/entities/char_2009.gif) : :![[thin space (1/6-em)]](https://www.rsc.org/images/entities/char_2009.gif) Dye R = 1 Dye R = 1![[thin space (1/6-em)]](https://www.rsc.org/images/entities/char_2009.gif) : :![[thin space (1/6-em)]](https://www.rsc.org/images/entities/char_2009.gif) 2 2![[thin space (1/6-em)]](https://www.rsc.org/images/entities/char_2009.gif) : :![[thin space (1/6-em)]](https://www.rsc.org/images/entities/char_2009.gif) 1 1 |
2.25 |
PEG 10![[thin space (1/6-em)]](https://www.rsc.org/images/entities/char_2009.gif) 000-co-Dye B 000-co-Dye B |
PEG 10![[thin space (1/6-em)]](https://www.rsc.org/images/entities/char_2009.gif) 000 000![[thin space (1/6-em)]](https://www.rsc.org/images/entities/char_2009.gif) : :![[thin space (1/6-em)]](https://www.rsc.org/images/entities/char_2009.gif) TDI TDI![[thin space (1/6-em)]](https://www.rsc.org/images/entities/char_2009.gif) : :![[thin space (1/6-em)]](https://www.rsc.org/images/entities/char_2009.gif) Dye B = 1 Dye B = 1![[thin space (1/6-em)]](https://www.rsc.org/images/entities/char_2009.gif) : :![[thin space (1/6-em)]](https://www.rsc.org/images/entities/char_2009.gif) 2 2![[thin space (1/6-em)]](https://www.rsc.org/images/entities/char_2009.gif) : :![[thin space (1/6-em)]](https://www.rsc.org/images/entities/char_2009.gif) 1 1 |
2.34 |
Sunlight irradiation experimental section
A photothermal conversion schematic diagram was shown in our previous published paper.20 The light-to-heat conversion system consists of a foam insulation system, the OSPCMs in a weighing bottle (R = 2.5 cm) and a light source. A power meter (VLP-2000, Changchun Femtosecond Technology Co. Ltd., Jilin, China) was used to measure and verify the power of the light irradiation from the solar and simulated light source (CHF-XM-500W, Beijing Chang Tuo Technology Co. Ltd., Beijing, China). The data collecting and processing devices consist of two subsystems, the temperature versus time data collection system and the computer processing system. The temperature versus time data collection system consists of a Pt thermocouple, a thermocouple-to-analog connector (RS-232-RS-485, Instrument Co. Ltd., Jiangsu Suke, China), and a data logger (SK-130RD106062560021A1, Instrument Co. Ltd., Jiangsu Suke, China).The transduction and storage efficiency of OSPCMs
The visible light-to-heat transduction and energy storage efficiency (η) of the OSPCMs was calculated using irradiation from the simulated light source (with an area of 4.90 cm2 measured under light irradiation).20 The temperature change of the OSPCMs was measured with a numeric control. Using photothermal calculation methods, the parameter η is obtained from the following equation (eqn (2)): | (2) |
Characterization
The physical and chemical characterization of the OSPCMs, dyes, and PEG 10![[thin space (1/6-em)]](https://www.rsc.org/images/entities/char_2009.gif) 000 was performed as described below.
000 was performed as described below.
The structural analysis of the OSPCMs and dyes was performed using a Fourier transform infrared (FTIR) spectrophotometer (Nicolet Avatar 320, KBr pellets). Proton nuclear magnetic resonance (1H NMR) analysis (in DMSO-d6, with TMS as the internal standard) was performed on a Bruker AV-400 spectrometer, with the chemical shifts reported as ppm. Mass spectral determination was conducted on a Q-TOF mass spectrometer (Micromass, England). Melting points were determined using an X-6 micromelting point apparatus and are uncorrected.
The structural characterization of the OSPCMs is reported in the ESI.†
The methods of the sunlight irradiation experiments and the transduction and storage efficiency have been reported in our previous article.20
Differential scanning calorimetry (DSC) was performed in an N2 atmosphere using an American TA Instruments 910S DSC thermal analyzer from 0 °C to 80 °C at a heating rate of 5 °C min−1, an N2 flow rate of 20 ml min−1, and calorimeter precision and temperature measurement precision of ±2.0% and ±2.0 °C, respectively. The samples were measured in a sealed aluminum pan with a mass of approximately 5.0 mg. The latent heat was calculated as the total area under the transition peaks of the OSPCM using thermal analysis software.
The shape-stabilized properties of the OSPCMs were characterized using hot stage-digital camera technology. The samples were placed on a hot stage and heated from 30 °C to 100 °C at a rate of 5 °C min−1. Changes in the samples were observed via tracking photography using a digital camera.
The thermal stability properties were characterized via thermogravimetric analysis (TGA) using a Switzerland Mettler-Toledo TGA/SDTA851 thermal analyzer. Approximately 10 mg of the specimen was heated from 40 °C to 700 °C at a linear heating rate of 10 °C min−1 under an N2 atmosphere.
X-ray diffraction (XRD) experiments were performed directly on the samples at room temperature using a Japan Rigaku D/Max2400 in the 5° to 60° range.
Results and discussion
Sunlight irradiation experiments were performed on the OSPCMs and PEG 10![[thin space (1/6-em)]](https://www.rsc.org/images/entities/char_2009.gif) 000 (control sample). The samples were prepared in a weighing bottle. Foam insulation was used during the procedure, as described in detail in our previous communication.20 The incident photon-to-heat conversion and energy storage curves of the OSPCMs and pure PEG 10
000 (control sample). The samples were prepared in a weighing bottle. Foam insulation was used during the procedure, as described in detail in our previous communication.20 The incident photon-to-heat conversion and energy storage curves of the OSPCMs and pure PEG 10![[thin space (1/6-em)]](https://www.rsc.org/images/entities/char_2009.gif) 000 (control sample) are shown in Fig. 2. Upon irradiation with sunlight, the temperature of the OSPCMs rapidly increased (colored lines in Fig. 2b), whereas the phase change material without a dye had only a small temperature increase (black line in Fig. 2b). This phenomenon can be ascribed to the OSPCMs, which absorbed visible sunlight well (colored lines in Fig. 2a) and effectively converted light to thermal energy based on the dyes. By contrast, the PEG 10
000 (control sample) are shown in Fig. 2. Upon irradiation with sunlight, the temperature of the OSPCMs rapidly increased (colored lines in Fig. 2b), whereas the phase change material without a dye had only a small temperature increase (black line in Fig. 2b). This phenomenon can be ascribed to the OSPCMs, which absorbed visible sunlight well (colored lines in Fig. 2a) and effectively converted light to thermal energy based on the dyes. By contrast, the PEG 10![[thin space (1/6-em)]](https://www.rsc.org/images/entities/char_2009.gif) 000 without a dye showed no absorption in the visible region (black line in Fig. 2a). The OSPCM dye can be used as an effective “photon capturer and molecular heater” in the light-to-heat conversion of molecules, which occurs as a result of a nonradiative decay process (vibrational relaxation, internal conversion, and intersystem crossing) of the excited dyes under visible light irradiation. Under sunlight irradiation, the control sample (PEG 10
000 without a dye showed no absorption in the visible region (black line in Fig. 2a). The OSPCM dye can be used as an effective “photon capturer and molecular heater” in the light-to-heat conversion of molecules, which occurs as a result of a nonradiative decay process (vibrational relaxation, internal conversion, and intersystem crossing) of the excited dyes under visible light irradiation. Under sunlight irradiation, the control sample (PEG 10![[thin space (1/6-em)]](https://www.rsc.org/images/entities/char_2009.gif) 000) temperature also gradually increased because of the absorption of near-infrared light by PEG.23 As the irradiation time increased, the temperature growth platform appeared between 49.3 and 60.1 °C. This phenomenon explains the phase transition of the OSPCMs due to the absorption of large amounts of heat. Therefore, the dye acted as an effective “photon capturer and molecular heater” to convert light into heat energy and stored heat in the OSPCM throughout the phase transition.
000) temperature also gradually increased because of the absorption of near-infrared light by PEG.23 As the irradiation time increased, the temperature growth platform appeared between 49.3 and 60.1 °C. This phenomenon explains the phase transition of the OSPCMs due to the absorption of large amounts of heat. Therefore, the dye acted as an effective “photon capturer and molecular heater” to convert light into heat energy and stored heat in the OSPCM throughout the phase transition.
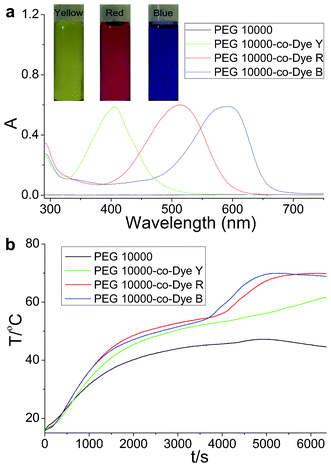 | ||
Fig. 2 (a) UV-Vis absorption spectra of PEG 10![[thin space (1/6-em)]](https://www.rsc.org/images/entities/char_2009.gif) 000 and organic shape-stabilized phase change materials (OSPCMs) in toluene and color images of the OSPCMs. (b) Light-driven efficiencies of PEG 10 000 and organic shape-stabilized phase change materials (OSPCMs) in toluene and color images of the OSPCMs. (b) Light-driven efficiencies of PEG 10![[thin space (1/6-em)]](https://www.rsc.org/images/entities/char_2009.gif) 000 (control sample) and the OSPCMs (P = 0.26 W to 0.30 W, ambient T = 16.7 °C, performed from 11:55 to 13:45, 18-04-2012, Dalian, China). 000 (control sample) and the OSPCMs (P = 0.26 W to 0.30 W, ambient T = 16.7 °C, performed from 11:55 to 13:45, 18-04-2012, Dalian, China). | ||
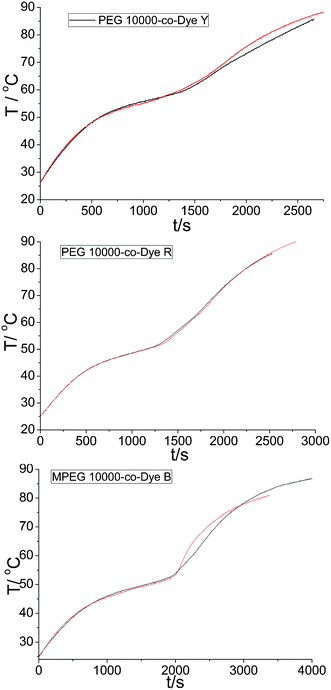
To improve the efficient utilization of solar irradiation further, color-matching materials with broadband visible light absorption were obtained (Table 2). Sunlight irradiation experiments were performed on the OSPCMs and their matching materials. The obtained Δt values for the OSPCMs correspond to the phase transition times (Fig. 3b). Upon sunlight irradiation (P = 0.30 W to 0.33 W), the Δt values were 2010, 2170, 2150, 2090, 2550, and 2695 s, which correspond to entries 1, 2, 3, PEG 10![[thin space (1/6-em)]](https://www.rsc.org/images/entities/char_2009.gif) 000-co-Dye B, PEG 10
000-co-Dye B, PEG 10![[thin space (1/6-em)]](https://www.rsc.org/images/entities/char_2009.gif) 000-co-Dye R, and PEG 10
000-co-Dye R, and PEG 10![[thin space (1/6-em)]](https://www.rsc.org/images/entities/char_2009.gif) 000-co-Dye Y, respectively. The temperature platform of entry 1 was clearly significantly shorter than that of the others. However, a slight change in the phase transition enthalpy was observed (Table 3). Evidently, a high light-harvesting-conversion-storage efficiency was achieved when the absorption bands of the color-matching materials were broadened (Fig. 3a).
000-co-Dye Y, respectively. The temperature platform of entry 1 was clearly significantly shorter than that of the others. However, a slight change in the phase transition enthalpy was observed (Table 3). Evidently, a high light-harvesting-conversion-storage efficiency was achieved when the absorption bands of the color-matching materials were broadened (Fig. 3a).
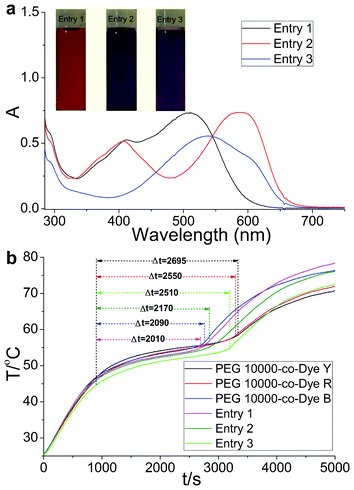 | ||
| Fig. 3 (a) UV-Vis absorption spectra and color images of the OSPCMs in toluene. (b) Light-driven efficiencies of the OSPCMs and their matching materials, (P = 0.30 W to 0.33 W, ambient T = 24.7 °C, performed from 11:40 to 13:20, 9-06-2012, Dalian, China). | ||
| Sample | Phase transition | ΔH (J g−1) | T r (°C) | ||
|---|---|---|---|---|---|
| Heating cycle | Cooling cycle | Heating cycle | Cooling cycle | ||
PEG 10![[thin space (1/6-em)]](https://www.rsc.org/images/entities/char_2009.gif) 000 000 |
Solid–liquid | 197.2 | 201.1 | 67.0 | 46.7 |
PEG 10![[thin space (1/6-em)]](https://www.rsc.org/images/entities/char_2009.gif) 000-co-Dye Y 000-co-Dye Y |
Form-stable | 138.5 | 125.1 | 60.8 | 33.7 |
PEG 10![[thin space (1/6-em)]](https://www.rsc.org/images/entities/char_2009.gif) 000-co-Dye R 000-co-Dye R |
Form-stable | 113.7 | 117.6 | 56.2 | 30.6 |
PEG 10![[thin space (1/6-em)]](https://www.rsc.org/images/entities/char_2009.gif) 000-co-Dye B 000-co-Dye B |
Form-stable | 107.1 | 106.8 | 53.5 | 33.1 |
| Entry 1 | Form-stable | 109.2 | 107.1 | 56.8 | 36.5 |
| Entry 2 | Form-stable | 108.7 | 107.8 | 59.1 | 34.1 |
| Entry 3 | Form-stable | 108.1 | 106.7 | 57.9 | 35.4 |
| Entry 4 | Form-stable | 107.9 | 109.8 | 56.6 | 34.4 |
| Entry 5 | Form-stable | 104.6 | 103.1 | 56.7 | 35.5 |
| Entry 6 | Form-stable | 112.6 | 111.4 | 56.7 | 34.7 |
Three light-matching primary colors were produced based on the energy density distribution of visible light irradiation to utilize the visible sunlight region efficiently. The UV-Vis spectra of the matching OSPCMs showed that the absorption curves (Fig. 4a) were identical to solar radiation.21 Upon sunlight irradiation (P = 0.35 W to 0.37 W), the Δt values of entries 1 to 6 were 1725, 1810, 2075, 1950, 2025, and 1610 s, respectively. The sunlight-driven platform of entry 6 was significantly shorter than that of the others upon sunlight irradiation because its UV-Vis spectrum was close to the solar radiation peak. A slight change was observed in the phase transition enthalpy (Table 3). In addition, the color-matching materials produced abundant colors of different varieties. Thus, the color matching of the OSPCMs successfully improved the efficiency of solar radiation utilization.
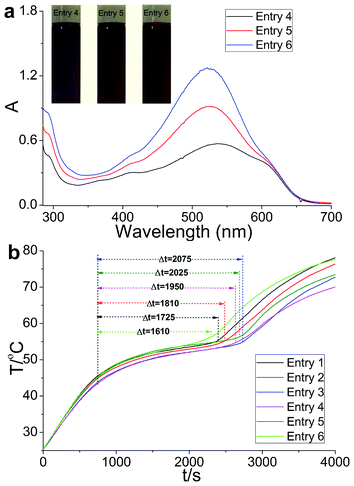 | ||
| Fig. 4 (a) UV-Vis absorption spectra and color images of the OSPCMs in toluene. (b) Light-driven efficiencies of the color-matching materials of the OSPCMs (P = 0.35 W to 0.37 W, ambient T = 23.4 °C, performed from 11:50 to 13:10, 11-06-2012, Dalian, China). | ||
The DSC curves of the OSPCMs, their color-matching materials, and pure PEG 10![[thin space (1/6-em)]](https://www.rsc.org/images/entities/char_2009.gif) 000 are presented in Fig. 5. The thermal energy storage data obtained from the DSC curves are also listed in Table 3. Compared with pure PEG (197.2 J g−1), the OSPCMs (138.5, 113.7, and 107.1 J g−1) exhibited a partial loss in latent heat (Fig. 5a and Table 3). This result is due to the restriction of soft-segment PEG crystallization in the OSPCMs by the hard segment of the dye. This crystallization is important in maintaining the shape stability during the entire heating process of the materials. The DSC curves in Fig. 5b are virtually identical to those listed in Table 3. In addition, the effect of the color-matching materials (entries 1–6) on the phase transition temperature and enthalpy was negligible. Moreover, the color-matching materials exhibited high energy storage densities, all exceeding 100 J kg−1. Although pure PEG and the OSPCMs underwent phase transitions with high transition enthalpies, their phase transition states significantly differed. The shape-stabilized properties of the OSPCMs and their color-matching materials were characterized using hot stage-digital camera technology. In brief, the samples were placed on the hot stage and heated from 30 °C to 100 °C at a rate of 5 °C min−1. Changes in the samples were observed via tracking photography using a digital camera. Compared with pure PEG, which exhibited a solid-to-liquid phase transition, the OSPCMs and their matching materials remained solid. In addition, no liquid was observed during the entire heating process, even when the temperature exceeded 80 °C (ESI Fig. S2†). Thus, the OSPCMs and their color-matching materials exhibit a large energy-storage effect and high matching ability, which broadens their application in other fields. A preliminary study showed that OSPCMs exhibit high strength and flexibility (ESI Fig. S3 and S4†). Therefore, OSPCMs may be used as smart clothing or leather through fabric blending or wire-drawing.
000 are presented in Fig. 5. The thermal energy storage data obtained from the DSC curves are also listed in Table 3. Compared with pure PEG (197.2 J g−1), the OSPCMs (138.5, 113.7, and 107.1 J g−1) exhibited a partial loss in latent heat (Fig. 5a and Table 3). This result is due to the restriction of soft-segment PEG crystallization in the OSPCMs by the hard segment of the dye. This crystallization is important in maintaining the shape stability during the entire heating process of the materials. The DSC curves in Fig. 5b are virtually identical to those listed in Table 3. In addition, the effect of the color-matching materials (entries 1–6) on the phase transition temperature and enthalpy was negligible. Moreover, the color-matching materials exhibited high energy storage densities, all exceeding 100 J kg−1. Although pure PEG and the OSPCMs underwent phase transitions with high transition enthalpies, their phase transition states significantly differed. The shape-stabilized properties of the OSPCMs and their color-matching materials were characterized using hot stage-digital camera technology. In brief, the samples were placed on the hot stage and heated from 30 °C to 100 °C at a rate of 5 °C min−1. Changes in the samples were observed via tracking photography using a digital camera. Compared with pure PEG, which exhibited a solid-to-liquid phase transition, the OSPCMs and their matching materials remained solid. In addition, no liquid was observed during the entire heating process, even when the temperature exceeded 80 °C (ESI Fig. S2†). Thus, the OSPCMs and their color-matching materials exhibit a large energy-storage effect and high matching ability, which broadens their application in other fields. A preliminary study showed that OSPCMs exhibit high strength and flexibility (ESI Fig. S3 and S4†). Therefore, OSPCMs may be used as smart clothing or leather through fabric blending or wire-drawing.
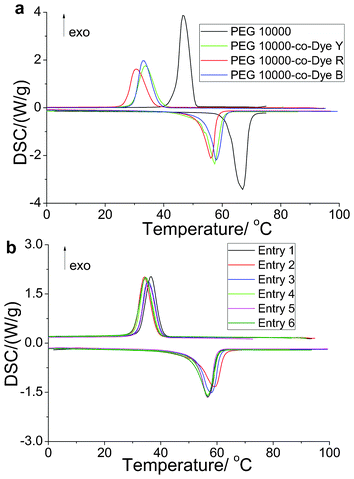 | ||
| Fig. 5 Differential scanning calorimetry (DSC) curves of the solar thermal conversion materials (yellow, red, and blue). | ||
To reveal the crystallization further, the XRD patterns of pure PEG, the OSPCMs, and their mixtures are shown in Fig. 6. The sharp and intense diffraction peaks at 19.12° and 23.24° were observed in the OSPCMs and their mixtures, which were the characteristic peaks of PEG.24,25 Obviously, the OSPCMs and their mixtures showed similar diffraction curves to pure PEG, and the diffraction angle and crystal plane distance were nearly the same. Those results illustrated that OSPCMs and their mixtures still have good crystalline properties, which is consistent with the DSC results discussed above.
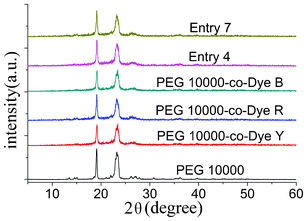 | ||
Fig. 6 X-ray diffraction (XRD) patterns of the PEG 10![[thin space (1/6-em)]](https://www.rsc.org/images/entities/char_2009.gif) 000-co-Dye polymers, their mixtures, and of PEG 10 000-co-Dye polymers, their mixtures, and of PEG 10![[thin space (1/6-em)]](https://www.rsc.org/images/entities/char_2009.gif) 000. 000. | ||
Of crucial importance is sunlight irradiation durability for pure organic compounds. Sunlight irradiation cycling tests were carried out, and the result of a 200 cycle test is shown in Fig. 7. The tests were conducted during sunlight for 20 min, followed by the irradiation being covered for 20 min in a temperature-controlled water bath (10 °C) to ensure the solid–solid cycles. The spectral features obtained before (black line in Fig. 7) and after (red line in Fig. 7) the irradiation are virtually identical. Amazingly, no notable deterioration of the OSPCMs was observed even after operating for 200 cycles.
 | ||
| Fig. 7 The light-driven spectrum of OSPCMs before (black line) and after (red line) 200 cycles of sunlight irradiation (P = 1.25 W, m = 5.0, sunlight irradiation). | ||
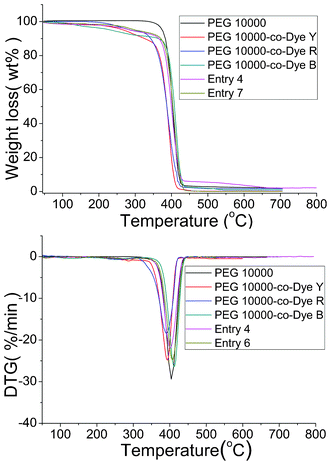
Thermal stability is of vital importance to pure organic compounds. In this study, TG and DTG analyses were conducted to determine the thermal stability of the OSPCMs. The corresponding results are presented in Fig. 8 and Table 4. OSPCMs and their mixtures undergo two-step degradation processes unlike pure PEG 10![[thin space (1/6-em)]](https://www.rsc.org/images/entities/char_2009.gif) 000. The first degradation step involved the degradation of the OSPCM (PEG 10
000. The first degradation step involved the degradation of the OSPCM (PEG 10![[thin space (1/6-em)]](https://www.rsc.org/images/entities/char_2009.gif) 000-co-Dye) polyurethane chain within the 258 °C to 287 °C temperature range.26,27 The second step occurred at approximately 390 °C to 420 °C and corresponds to the degradation of the pure PEG chain.28,29 The onset temperatures of degradation can be calculated from the TG curves by extrapolating from the curve at the peak of degradation back to the initial PEG and TDI weights. The weight losses of the OSPCMs and their mixtures are nearly equal to the theoretical amount during the first degradation step. Table 4 lists the charred OSPCM residue percentages, which are identical to the percentages of the PEG charred residues at 700 °C and are close to the theoretical results for organic compounds. Therefore, the TG analysis results are consistent with the expected degradation mechanism. The results also show that the OSPCMs and their mixtures exhibit high thermal stabilities, thus meeting the requirements for practical applications.
000-co-Dye) polyurethane chain within the 258 °C to 287 °C temperature range.26,27 The second step occurred at approximately 390 °C to 420 °C and corresponds to the degradation of the pure PEG chain.28,29 The onset temperatures of degradation can be calculated from the TG curves by extrapolating from the curve at the peak of degradation back to the initial PEG and TDI weights. The weight losses of the OSPCMs and their mixtures are nearly equal to the theoretical amount during the first degradation step. Table 4 lists the charred OSPCM residue percentages, which are identical to the percentages of the PEG charred residues at 700 °C and are close to the theoretical results for organic compounds. Therefore, the TG analysis results are consistent with the expected degradation mechanism. The results also show that the OSPCMs and their mixtures exhibit high thermal stabilities, thus meeting the requirements for practical applications.
![[thin space (1/6-em)]](https://www.rsc.org/images/entities/char_2009.gif) 000
000
| Sample | T max1 (°C) | T max2 (°C) | Char yield at 650 °C (wt%) |
|---|---|---|---|
PEG 10![[thin space (1/6-em)]](https://www.rsc.org/images/entities/char_2009.gif) 000 000 |
/ | 403.9 | 2.1 |
PEG 10![[thin space (1/6-em)]](https://www.rsc.org/images/entities/char_2009.gif) 000-co-Dye Y 000-co-Dye Y |
286.9 | 393.1 | 0.2 |
PEG 10![[thin space (1/6-em)]](https://www.rsc.org/images/entities/char_2009.gif) 000-co-Dye R 000-co-Dye R |
269.1 | 391.1 | 1.7 |
PEG 10![[thin space (1/6-em)]](https://www.rsc.org/images/entities/char_2009.gif) 000-co-Dye B 000-co-Dye B |
258.1 | 411.9 | 0.9 |
| Entry 4 | 279.8 | 401.1 | 2.2 |
| Entry 6 | 281.8 | 407.1 | 0.11 |
Conclusions
Based on the solar energy distribution, the effective utilization of the visible part of solar radiation was achieved by the color matching of OSPCMs (yellow, red, and blue), which were synthesized via condensation polymerization of the corresponding dye and PEG monomers. The simple and low-cost color-matching approach provides a new platform for improving the efficiency of solar radiation utilization. Given the unique characteristics of OSPCMs, such as wider absorption range for visible sunlight, high light-to-heat conversion and energy storage efficiencies, and good form-stable properties, this kind of polymeric phase change material will undoubtedly find applications in fields that meet the need for improved energy utilization efficiency. Additionally, a preliminary study showed that OSPCMs may be used as smart clothing or leather through fabric blending or wire-drawing.Acknowledgements
This work was supported by the National Natural Science Foundation for Young Scholar of China (20804007), the State Key Program of the National Natural Science Foundation of China (20836001), the Doctoral Fund of the Ministry of Education of China (200801411032), the National Science and Technology Pillar Program (2011BAE07B01).References
- S. Ito, S. M. Zakeeruddin, P. Comte, P. Liska, D. Kuang and M. Gratzel, Nat. Photonics, 2008, 2, 693–698 CrossRef CAS.
- Y. Zeng, J. Yao, B. A. Horri, K. Wang, Y. Wu, D. Li and H. Wang, Energy Environ. Sci., 2011, 4, 4074–4078 CAS.
- A. Sarı, C. Alkan, A. Biçer and A. Karaipekli, Sol. Energy Mater. Sol. Cells, 2011, 95, 3195–3201 CrossRef.
- T. J. Kucharski, Y. Tian, S. Akbulatov and R. Boulatov, Energy Environ. Sci., 2011, 4, 4449–4472 CAS.
- Y. P. Xie, G. Liu, L. Yin and H.-M. Cheng, J. Mater. Chem., 2012, 22, 6746–6751 RSC.
- Y. Tak, S. J. Hong, J. S. Lee and K. Yong, J. Mater. Chem., 2009, 19, 5945–5951 RSC.
- D. M. Guldi, I. Zilbermann, G. Anderson, N. A. Kotov, N. Tagmatarchis and M. Prato, J. Mater. Chem., 2005, 15, 114–118 RSC.
- Y. Lin, S. Zhou, S. W. Sheehan and D. Wang, J. Am. Chem. Soc., 2011, 133, 2398–2401 CrossRef CAS.
- J. Kim, C. A. Henao, T. A. Johnson, D. E. Dedrick, J. E. Miller, E. B. Stechel and C. T. Maravelias, Energy Environ. Sci., 2011, 4, 3122–3132 CAS.
- P. Furler, J. R. Scheffe and A. Steinfeld, Energy Environ. Sci., 2012, 5, 6098–6103 CAS.
- C. Liu, F. Li, L.-P. Ma and H.-M. Cheng, Adv. Mater., 2010, 22, E28–E62 CrossRef CAS.
- N. Armaroli and V. Balzani, Angew. Chem., Int. Ed., 2007, 46, 52–66 CrossRef CAS.
- A. Sarı, A. Biçer, A. Karaipekli, C. Alkan and A. Karadag, Sol. Energy Mater. Sol. Cells, 2010, 94, 1711–1715 CrossRef.
- A. Sarı and A. Biçer, Sol. Energy Mater. Sol. Cells, 2012, 101, 114–122 CrossRef.
- L. Feng, W. Zhao, J. Zheng, S. Frisco, P. Song and X. Li, Sol. Energy Mater. Sol. Cells, 2011, 95, 3550–3556 CrossRef CAS.
- M. M. Kenisarin and K. M. Kenisarina, Renewable Sustainable Energy Rev., 2012, 16, 1999–2040 CrossRef CAS.
- Y. Ma, X. Chu, W. Li and G. Tang, Sol. Energy, 2012, 86, 2056–2066 CrossRef CAS.
- P. Xi, L. Xia, P. Fei, D. Zhang and B. Cheng, Sol. Energy Mater. Sol. Cells, 2012, 102, 36–43 CrossRef CAS.
- X.-Z. Guo, Y.-D. Zhang, D. Qin, Y.-H. Luo, D.-M. Li, Y.-T. Pang and Q.-B. Meng, J. Power Sources, 2010, 195, 7684–7690 CrossRef CAS.
- Y. Wang, B. Tang and S. Zhang, RSC Adv., 2012, 2, 5964–5967 RSC.
- C. G. Granqvist, Adv. Mater., 2003, 15, 1789–1803 CrossRef CAS.
- H. Lu, H. Wang, A. Zheng and H. Xiao, Polym. Compos., 2007, 28, 42–46 CrossRef CAS.
- N. Sarier and E. Onder, Thermochim. Acta, 2007, 454, 90–98 CrossRef CAS.
- L. Zhang, J. Q. Zhu, W. B. Zhou, J. Wang and Y. Wang, Thermochim. Acta, 2011, 524, 128–134 CrossRef CAS.
- L. Feng, J. Zheng, H. Yang, Y. Guo, W. Li and X. Li, Sol. Energy Mater. Sol. Cells, 2011, 95, 644–650 CrossRef CAS.
- M. A. Izquierdo, F. J. Navarro, F. J. Martínez-Boza and C. Gallegos, Constr. Build. Mater., 2012, 30, 706–713 CrossRef.
- Q. Cao and P. S. Liu, Eur. Polym. J., 2006, 42, 2931–2939 CrossRef CAS.
- A. Sarı, C. Alkan and A. Biçer, Mater. Chem. Phys., 2012, 133, 87–94 CrossRef.
- Q. Meng and J. Hu, Sol. Energy Mater. Sol. Cells, 2008, 92, 1245–1252 CrossRef CAS.
Footnote |
| † Electronic supplementary information (ESI) available. See DOI: 10.1039/c2ra21832a |
| This journal is © The Royal Society of Chemistry 2012 |

