Microwave synthesis of graphene/magnetite composite electrode material for symmetric supercapacitor with superior rate performance†
Kaliyappan
Karthikeyan
a,
Dharmalingam
Kalpana
*b,
Samuthirapandian
Amaresh
a and
Yun Sung
Lee
*a
aFaculty of Applied Chemical Engineering, Chonnam National University, Gwang-ju 500-757, South Korea. E-mail: leeys@chonnam.ac.kr
bCentral Electrochemical Research Institute, Karaikudi 630006, India. E-mail: drkalpanaa@gmail.com Tel : +04565-241412
First published on 31st October 2012
Abstract
Pristine Fe3O4 and Fe3O4–graphene composites were synthesized by using a green and low cost urea-assisted microwave irradiation method and were utilized as electrode materials for symmetric supercapacitor applications. The Fe3O4–graphene symmetric cell exhibited a better electrochemical performance than that of the Fe3O4 cell with enhanced rate performances. The Fe3O4–graphene symmetric cell delivered a stable discharge capacitance, energy and power densities of about 72 F g−1, 9 Wh kg−1 and 3000 W kg−1, respectively at 3.75 A g−1 current density over 100![[thin space (1/6-em)]](https://www.rsc.org/images/entities/char_2009.gif) 000 cycles between 0–1 V. The impedance studies also suggested that the Fe3O4–graphene symmetric cell showed lower resistance and high conductivity due to the small particle size, large surface area and good interaction between Fe3O4 particles and graphene layers.
000 cycles between 0–1 V. The impedance studies also suggested that the Fe3O4–graphene symmetric cell showed lower resistance and high conductivity due to the small particle size, large surface area and good interaction between Fe3O4 particles and graphene layers.
Introduction
In recent years, research into alternative energy storage devices has drawn much attention due to the increasing environmental concerns and depletion of natural oil resources. Among the energy storage devices, electrochemical supercapacitors (ECs) have attracted much interest due to their high power density, long cycle life, and higher energy density than conventional capacitors.1 According to their charge storage mechanism, ECs can be classified as electrochemical double layer capacitors (EDLC) and pseudocapacitors. The former is based on the charge separation at the electrode–electrolyte interface, whereas the later is associated to the reversible Faradaic reaction of electro-active species such as surface functional group and transition metal oxides at the electrode. Various carbonaceous materials with high surface area have been adopted as the electrode materials for EDLCs.2–4 The capacitance and energy density of the pseudocapacitors are much larger when compared to the EDLCs. The hybridization of two types of electrodes to form a new capacitor called a hybrid supercapacitor (HSC) is a unique approach that is used to enhance the electrochemical properties of single cell5,6. In this case, one of the electrodes is an energy source electrode (battery-like electrodes) and the other terminal contains a power source electrode (either an EDLC or a pseudo capacitor electrode).The electrode materials for pseudocapacitors are either metal oxides7 or conducting polymers8. Among the metal oxides, the oxides of Ru have been considered as promising electrode materials for pseudo-capacitor applications because of their highest specific capacitance of 720 F g−1.9 However, their prohibitive cost and toxic nature have motivated the search for a cheaper material with an equivalent performance. Numerous transition metal oxides such as MnO2, NiO, SnO2 and Co3O4 have been investigated and demonstrated as electrode materials for EC applications.10–13 Of late, magnetite (Fe3O4) with different valance states has become recognised as a promising electrode material for energy storage applications due to its low cost, environmentally benign nature and natural abundance.14,15
Nano-structured Fe3O4 has already been used as a catalyst,16 an anode for lithium batteries17 and in magnetic devices.18 Wu et al. was the first to report the capacitance nature of Fe3O4 with ∼7 F g−1 in 1M Na2SO4 electrolyte.14 Chen et al. prepared an Fe3O4 thin film and demonstrated its electrochemical performance in 1 M Na2SO3 solution.15 Later, Wang et al. investigated the capacitance properties of magnetite in different aqueous electrolytes. 19 However, the capacitances reported in the above literatures are still very low, and hence, much effort is required to improve electrochemical behavior. The preparation of advanced nanocomposites has been extensively studied to improve the capacitance behavior of Fe3O4, which could be achieved from its high stability and the improved conductive nature of the composites that enhances the pseudo-capacitive behavior of Fe3O4.20–22 Among the nanocomposites, Fe3O4–graphene exhibited an excellent capacitive performance, attributed to the synergistic effects of the redox nature of metal oxides and the high electrical conductivity as well as the large surface area of graphene. There are few traces found relating to the utilization of Fe3O4–graphene composites as an electrode material for supercapacitor applications using various aqueous electrolytes.20,23–24 To the best of our knowledge, no reports have been found on the utilization of Fe3O4-based materials for symmetric supercapacitor applications. In this work, we present, for the first time, the fabrication of symmetric supercapacitors based on Fe3O4–graphene nanosheet (GNS) composite materials, which were simultaneously compared with a pristine Fe3O4 symmetric cell in 1M H2SO4 electrolyte. The pristine Fe3O4 and Fe3O4–GNS composite were prepared through a urea-assisted microwave irradiation method followed by low temperature calcination. The effect of graphene on the structural and electrochemical performance of Fe3O4 has been examined using various characterization techniques.
Result and discussion
Fig. 1 shows the XRD patterns of graphene, Fe3O4 and Fe3O4–GNS composite materials. The XRD patterns of both pristine and GNS composites exhibited peaks at the 2θ values of 30.5, 36, 43.6, 54, 57.8 and 63°, which corresponds to the face centered cubic structure of magnetite particles (JCPDS no. 19–0629).14–17 It can be seen from Fig. 1 that the composite material showed broader peaks with lower intensity than bare Fe3O4, demonstrating that the Fe3O4–GNS composite has a relatively low crystalline nature with small Fe3O4 particle size, owing to the high degree of functional groups on the GNS surface, which is used to hinder the crystalline growth of Fe3O4 grains.26 On the other hand, the peak associated with graphene oxide (GO) or GNS was also not observed in Fig. 1 due to the high degree of disorder created in graphite to form graphene by modified Hummers–Offeman method.25,27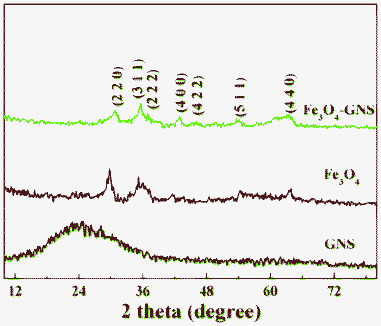 | ||
| Fig. 1 X-Ray diffraction patterns of GNS, Fe3O4 and Fe3O4–GNS composite powders. | ||
The presence of graphene in the composite material was confirmed by Raman analysis and the corresponding spectra are presented as Fig. S1 in the ESI†. The Raman spectra obtained for the composite material exhibited typical carbon characteristic peaks at ∼1350 and ∼1590 cm−1, which corresponds to the D and G band, respectively.23 However, the pristine material did not show such peaks within the recorded area. The G band related to the symmetric E2g vibrations mode of C sp2 atoms, while the D band corresponds to the breathing mode of k-point phonons of A1g symmetry.23,24 The broadening of the D and G bands along with a strong D line demonstrates localized in-plane sp2 domains and disordered graphitic crystal stacking of GNS. On the other hand, this considerable disorder is favorable for increasing ionic/electronic transfer and hence a remarkable improvement in electrochemical performance would be achieved from a Fe3O4–GNS composite electrode. Therefore, the Raman spectra, being consistent with the XRD results, further confirmed the formation of the composite.
The TEM images of GNS, Fe3O4 and Fe3O4–GNS were showed in Fig. 2. It can be clearly seen from Fig. 2a that the GNS displays a fluffy and corrugated morphology with wrinkles and protrusions. The crumbled nature formed during the synthesis of graphene nano sheets is responsible for preventing the aggregation of these sheets on further treatments. The TEM picture of Fe3O4 in Fig. 2b clearly demonstrates that the pristine sample consists of loosely packed irregular shaped particles of size ∼100 nm with serious agglomeration due to certain higher surface tension between the particles.28 As can be seen from the TEM image of the Fe3O4–GNS composite in Fig. 2c, the Fe3O4 particles with a size of around 20–40 nm are homogeneously distributed on the surface of the GNS. Moreover, the morphology of the GNS has slightly changed from the pristine GNS, which agreed well with Fig. 1a and the SEM images (see Fig. S2 in the ESI†). In addition, oxygen functional groups such as carboxylic, hydroxyl, and epoxy groups present on the GNS surface effectively hindered the diffusion, growth and agglomeration of Fe3O4 particles in the composite.26,27 It was also believed that the van der Waals interactions and chemisorptions between the nano-Fe3O4 particles and GNS exist at the pristine regions of GNS and oxygen-containing defect sites.26 Furthermore, the Fe3O4 nanoparticles anchored on the surface of the GNS acted as spacers, which prevent the restacking of graphene sheets, thereby increasing the active surface for electrochemical reactions.
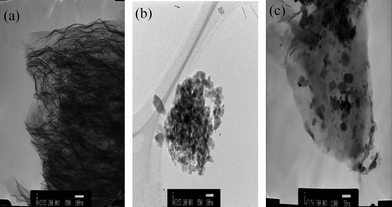 | ||
| Fig. 2 TEM images of (a) GNS; (b) Fe3O4; and (c) Fe3O4–GNS (50 nm scale) composite materials prepared by using microwave synthesis method. Scale for (a) and (b) is 100 nm. | ||
The N2 isothermal adsorptions were presented in Fig. S3 in the ESI†. As can be seen from the N2 adsorption/desorption isotherms in Fig. S3 in the ESI†, the Fe3O4–GNS composite exhibited a distinct hysteresis loop at the relative pressure P/P0 ranging from 0.4 to 1.0, which is ascribed to type IV with a type-H3 hysteresis loop, indicating the presence of a mesoporous structure.29 Such a unique feature results in numerous open channels for electrolyte access and facilitates the ultrafast diffusion of ions during the cycling processes at high current rates. The BET surface areas of Fe3O4 and Fe3O4–GNS were calculated to be about 8.3 and 72.3 m2 g−1, respectively. It is well known that small particle size and high surface area are important parameters for any material to deliver excellent electrochemical performances. While the small particle size shortens the ion diffusion resistance of the electrode–electrolyte interface, the large surface area leads to the complete participation of the active material during the charge discharge reaction. The carbon content in the Fe3O4–GNS composite was measured using TGA analysis (see Fig. S4 in the ESI†). The carbon content in the composite material was calculated by the weight difference between the Fe3O4 and Fe3O4–GNS materials at 450 °C when all carbon is burnt out from the composite, and the result was about 9 wt%.
In order to get detailed information about the surface composition, XPS analysis was performed, which is very sensitive to Fe2+ and Fe3+ cations and the corresponding spectra are given in Fig. 3. As seen in Fig. 3a, the peaks around 711 and 725 eV in higher resolution scan, Fe2p can be attributed to the levels of Fe2p3/2 and Fe2p1/2 which is in good agreement with those of Fe3O4.20,22 Moreover, the satellite peak of γ-Fe3O4 did not appear at 719 eV, which confirmed that the electrode material is void of impurities and does not decompose to γ-Fe3O4.30 It could clearly be seen from Fig. 3b that the high resolution C 1s spectra of both GO and the Fe3O4–GNS composite clearly exhibited two types of major carbon peaks corresponding to carbon atoms with different functional groups. The C 1s XPS spectra of the samples showed a main peak of sp2 graphitic carbon centered at 284.8 eV, demonstrating a successful reduction of GO to GNS after chemical treatment using hydrazine. In addition, the deconvoluted C 1s XPS spectrum of GO (see Fig. S5a in the ESI†) has showed the C 1s of C–OH at 285.9 eV, the C 1s of epoxy at 286.7 eV, the C 1s of C![[double bond, length as m-dash]](https://www.rsc.org/images/entities/char_e001.gif) O at 288.1 eV, and the C 1s of C(O)O at 289.2 eV, respectively.31 The graphene in the Fe3O4–GNS composite reduced by hydrazine vapor exhibits the same oxygen-containing functionalities (see Fig. S5b in the ESI†), but their intensities are much smaller than that of GO. This is in agreement with the previous literature which reported that the –COOH functional group could not be reduced completely through hydrazine reduction at low temperature.32
O at 288.1 eV, and the C 1s of C(O)O at 289.2 eV, respectively.31 The graphene in the Fe3O4–GNS composite reduced by hydrazine vapor exhibits the same oxygen-containing functionalities (see Fig. S5b in the ESI†), but their intensities are much smaller than that of GO. This is in agreement with the previous literature which reported that the –COOH functional group could not be reduced completely through hydrazine reduction at low temperature.32
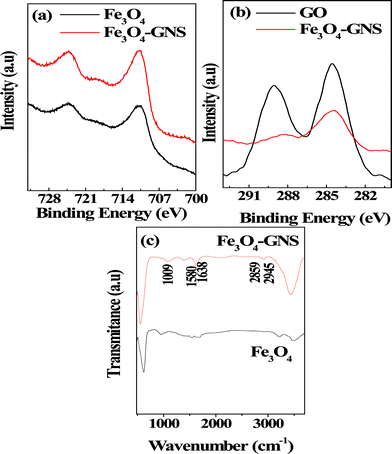 | ||
| Fig. 3 (a) High resolution XPS spectrum of (a) Fe 2p count of Fe3O4 and Fe3O4–GNS composite; (b) C 1 s count of graphene oxide (GO) and Fe3O4–GNS composite material; and (c) FT-IR spectrum of Fe3O4 and Fe3O4–GNS nanoparticles prepared through urea-assisted microwave irradiation method. | ||
The FT-IR spectra of Fe3O4 and Fe3O4–GNS composite materials were presented in Fig. 3c. In the case of the composite material, the broad peak around 3500–3300 cm−1 could be attributed to the O–H vibrations, arising from the hydroxyl groups/water adsorbed on the GNS. The peaks at ∼2945 and 2854 cm−1 can be assigned to the symmetric and asymmetric vibrations of C–H functional group, respectively. The strong adsorption band found at 588 cm−1 could be related to the Fe–O functional group. It is worth mentioning here that the stretching vibration of the carboxyl groups on the edges of the graphene plane was not observed which demonstrated that the reduction of GO to GNS was successfully completed.32 Additionally, the absorption bands at 1580 and 1010 cm−1 were observed for the Fe3O4–GNS composite, which also confirmed the presence of C![[double bond, length as m-dash]](https://www.rsc.org/images/entities/char_e001.gif) C and C–O vibration of graphene, respectively.33 This C–O bond was attributed to the defects including oxygen atoms in the GNS. Although these defects cannot be completely removed from the graphene structure during the chemical reduction of GO, they are useful for functionalizing the GNS composite. 34 The capacitance behaviors of the Fe3O4 and Fe3O4–GNS composite electrodes were evaluated through cyclic voltammetry using a three electrode cell configuration in 1 M H2SO4 electrolyte in which Pt wire was used as the counter electrode and SCE served as the reference electrode. The CV studies of Fe3O4 and Fe3O4–GNS electrodes were recorded between −1 to 0 V at a 5 mV s−1 scan rate and is presented in Fig. S6a in the ESI†. The shape of the CV curves clearly revealed that the storage mechanism of the pristine and composite materials was different from EDLC, which is normally an ideal rectangular shape, indicating that the capacitance of Fe3O4 mainly resulted from the redox reactions of the active material. A similar shape of CV curves for Fe3O4 was also observed in a previous report.35 A redox reaction hump was observed around −0.43 V for both pristine and composite electrodes. Although the CV curves did not show a typical rectangular shape, it is almost symmetrical between the cathodic and anodic processes, which demonstrated that both pristine and composite materials display capacitor behavior in 1 M H2SO4 electrolyte. Furthermore, the shape of the CV curves changed when the sweep rate is increased (see Fig. S6 in the ESI†). The possible reason for the shape changes could be described as follows: the distortion of current response is mainly dependent on the electrode and solution resistance, which become severe at the higher current rates and hence the shape of the curve was altered.36 It can also clearly be seen from the CV traces (see Fig. S6b and S6c in the ESI†) that the CV curve of the Fe3O4–GNS electrode showed a stronger current response and higher capacitance than that of the Fe3O4 electrode. The higher current response of the Fe3O4–GNS composite cell might be assigned to its small particles with largely exposed surface area and good interaction between the Fe3O4 particles and GNS.37
C and C–O vibration of graphene, respectively.33 This C–O bond was attributed to the defects including oxygen atoms in the GNS. Although these defects cannot be completely removed from the graphene structure during the chemical reduction of GO, they are useful for functionalizing the GNS composite. 34 The capacitance behaviors of the Fe3O4 and Fe3O4–GNS composite electrodes were evaluated through cyclic voltammetry using a three electrode cell configuration in 1 M H2SO4 electrolyte in which Pt wire was used as the counter electrode and SCE served as the reference electrode. The CV studies of Fe3O4 and Fe3O4–GNS electrodes were recorded between −1 to 0 V at a 5 mV s−1 scan rate and is presented in Fig. S6a in the ESI†. The shape of the CV curves clearly revealed that the storage mechanism of the pristine and composite materials was different from EDLC, which is normally an ideal rectangular shape, indicating that the capacitance of Fe3O4 mainly resulted from the redox reactions of the active material. A similar shape of CV curves for Fe3O4 was also observed in a previous report.35 A redox reaction hump was observed around −0.43 V for both pristine and composite electrodes. Although the CV curves did not show a typical rectangular shape, it is almost symmetrical between the cathodic and anodic processes, which demonstrated that both pristine and composite materials display capacitor behavior in 1 M H2SO4 electrolyte. Furthermore, the shape of the CV curves changed when the sweep rate is increased (see Fig. S6 in the ESI†). The possible reason for the shape changes could be described as follows: the distortion of current response is mainly dependent on the electrode and solution resistance, which become severe at the higher current rates and hence the shape of the curve was altered.36 It can also clearly be seen from the CV traces (see Fig. S6b and S6c in the ESI†) that the CV curve of the Fe3O4–GNS electrode showed a stronger current response and higher capacitance than that of the Fe3O4 electrode. The higher current response of the Fe3O4–GNS composite cell might be assigned to its small particles with largely exposed surface area and good interaction between the Fe3O4 particles and GNS.37
The discharge specific capacitance of the Fe3O4 and Fe3O4–GNS electrodes was calculated from the galvanostatic charge/discharge (C/DC) studies with three electrode configuration in 1 M H2SO4 electrolyte between −1–0 V at different current densities. Fig. 4a presented the C/DC curves of the pristine and Fe3O4–GNS composite electrodes recorded at 2 A g−1 current density. The slope variation of C/DC curves with respect to the time dependence of potential revealed that the pseudocapacitance behavior of the electrodes resulted from the electrochemical adsorption and de-adsorption of ions at the electrode–electrolyte interface.21,23,24 The inclined part in the charge curve around −0.2 to −0.4 V and discharge curve around −0.4 to 0 V also clearly demonstrated the superimposed redox reaction of the active materials, which correlated well with the CV results.23 Although the shape of the C/DC curve did not show a typical triangular shape, a similar trend was observed for the Fe3O4 particles in 1 M H2SO4 electrolyte.21 The Fe3O4–GNS composite electrode has delivered a maximum discharge capacitance of 415 F g−1 at 2 A g−1 current density (calculated based on the total weight of the electrode materials), whereas a much lower capacitance of 66 F g−1 was obtained for the Fe3O4 electrode. This capacitance is found to be one of the highest for Fe3O4-based nanocomposites with sulfate and sulfite-based aqueous electrolytes.21,23 The C/DC curves of the Fe3O4–GNS composite electrode at different current densities were shown in Fig. S7 in the ESI†. It is also noted that the discharge capacitance was monotonically decreased with an increase in current density, as illustrated in Fig. 4b. This may be due to the sluggish redox reaction kinetics and low penetration of sulfate ions in and out of the electrode at fast potential changes.13, 34
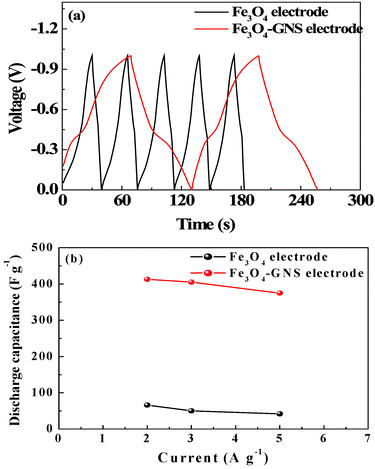 | ||
| Fig. 4 (a) Typical charge–discharge traces of Fe3O4 and Fe3O4–GNS electrodes in 1 M H2SO4 electrolyte between −1–0 V at constant current density of 2 A g−1 (b) Rate performance of Fe3O4 and Fe3O4–GNS electrodes at 2, 3 and 5 A g−1 current densities between −1–0 V | ||
In the case of the Fe3O4–GNS composite electrode, the discharge capacitance decreased to 375 F g−1 when the current density was increased to 5 A g−1, while the pristine Fe3O4 electrode delivered only 46 F g−1 at the same current density. The improved pseudocapacitive property of the Fe3O4–GNS composite could result from the interaction between the Fe3O4 particles and the edges of GNS. Thus, when Fe3O4 is deposited on the edges and planes of the GNS, it enters into the graphene plane as spacers that efficiently prevent the restacking of graphene sheets and hence, the loss of active sites available for the electrochemical reaction.20,23 Furthermore, the interactions of the graphene layer due to its high van der Waals force formed a open system (SEM as fig S2c in ESI†), through which electrolyte active spices easily access the surface of the GNS, which facilitates the formation of electric double layers and improve the utilization of Fe3O4 during the electrochemical process.26,27
The impact of GNS addition on the electrical conductivity was investigated using EIS studies. Fig. 5 presented the Nyquist plot of Fe3O4 and Fe3O4–GNS electrodes, which was recorded at open circuit voltage between a 100 kHz and 100 mHz frequency range in 1 M H2SO4 electrolyte. Generally, the resistance in an electrochemical cell has an electronic and ionic contribution. The ionic part is attributed to the separator resistance due to the diffusion of ions through the pores of the electrodes.
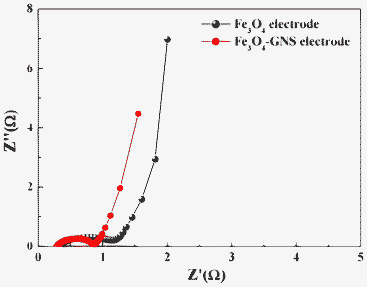 | ||
| Fig. 5 Nyquist plots of Fe3O4 and Fe3O4–GNS electrodes in 1 M H2SO4 recorded at open circuit voltage. | ||
The electronic resistance includes the bulk resistivity of the electrode material such as contact between current collector and the electrode materials.38
As seen from the Fig. 5, both Nyquist plots exhibit a distorted semi-circular part and an inclined line. The semi-circle at the high frequency region could be attributed to the charge transfer resistance (Rct) and the straight line at the low frequency region corresponds to the diffusion of ions in the electrodes. Among the electrodes, the Fe3O4–GNS composite electrode showed a low Rct value of 0.5 Ω and a more linear vertical curve, suggesting a better capacitive behavior of the composite electrode than that of the Fe3O4 electrode (1.2 Ω). This may be attributed to the highly reversible redox reactions associated with Fe3O4 nanomaterials along with the better electrical conductivity of GNSs.
Comparison of symmetrical systems
The symmetrical capacitors were fabricated using a Fe3O4/Fe3O4 or Fe3O4–GNS/Fe3O4–GNS two electrode configuration in 1 M H2SO4 electrolyte and their electrochemical performances were also evaluated. Fig. 6 showed the Nyquist plots of the Fe3O4/Fe3O4 and Fe3O4–GNS/Fe3O4–GNS symmetric cells recorded at open circuit voltage.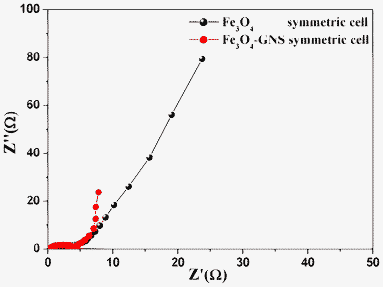 | ||
| Fig. 6 Nyquist plots for Fe3O4 and Fe3O4–GNS symmetric cells at open circuit voltage | ||
As can be seen from the Nyquist plots, the symmetric cell containing Fe3O4 electrodes exhibited a slightly larger Rct value, resulting in poor electrochemical performance, which could be attributed to the formation of an insulating layer during the redox process.21, 28 Whereas the Fe3O4–GNS cell exhibited a smaller semi-circle and a straight line close to 90° to the real axis at the low frequency region, thus demonstrating that enhanced capacitor performance could be expected from the Fe3O4–GNS symmetric cell.
In order to evaluate the electrochemical performance at higher voltages, the cells were charged and discharged between 0–1 V at various current densities. The C/DC curve of the symmetric cells measured at 0. 25 A g−1 between 0–1 V was illustrated in Fig. 7a. A linear and symmetrical feature of the C/DC curves was observed for both cells between 0–1 V. This implies that the cells have excellent electrochemical reversibility and capacitive characteristics. Although an almost linear potential response is observed, the C/DC curves are not in an exact triangle shape, which may be due to the pseudocapacitance arising out from the redox reaction within this voltage range. It can also be noted from Fig. 7a that the charge and discharge time of cells were almost same, suggesting 100% columbic efficiency. In the case of the Fe3O4–GNS symmetric cell, the discharge capacitance of 88 F g−1 was obtained at a constant current density of 0.25 A g−1, whereas the Fe3O4 symmetric cell delivered only about 15 F g−1. The cycling behavior of the symmetric cells is presented in Fig. 7b. The cycling test was conducted between 0–1 V at 0.25 mA g−1 current density for 12![[thin space (1/6-em)]](https://www.rsc.org/images/entities/char_2009.gif) 000 cycles.
000 cycles.
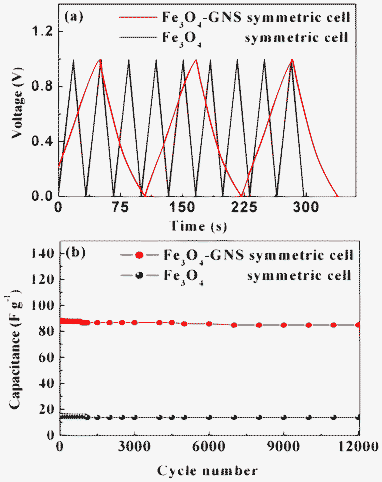 | ||
Fig. 7 (a) Charge–discharge curves of Fe3O4 and Fe3O4–GNS symmetric cells recorded between 0–1 V at 0.25 A g−1 current density in 1 M H2SO4 electrolyte and (b) cyclic behavior of Fe3O4 and Fe3O4–GNS symmetric cells recorded between 0–1 V at 0.25 A g−1 current density for 12![[thin space (1/6-em)]](https://www.rsc.org/images/entities/char_2009.gif) 000 cycles. 000 cycles. | ||
It could be resolved from the C/DC studies that the symmetric capacitor containing composite electrodes exhibited better cyclic behavior with less than 5% capacitance loss after 12![[thin space (1/6-em)]](https://www.rsc.org/images/entities/char_2009.gif) 000 cycles. It is clear that the capacitance fading was observed upon cycling due to the dissolution of the active materials in the electrolyte. The discharge capacitance of both cells decreased during the initial few cycles, and then remained constant with prolonged cycling. The Fe3O4–GNS symmetric cell maintained about 97% of its initial capacitance value after 12
000 cycles. It is clear that the capacitance fading was observed upon cycling due to the dissolution of the active materials in the electrolyte. The discharge capacitance of both cells decreased during the initial few cycles, and then remained constant with prolonged cycling. The Fe3O4–GNS symmetric cell maintained about 97% of its initial capacitance value after 12![[thin space (1/6-em)]](https://www.rsc.org/images/entities/char_2009.gif) 000 deep C/DC cycles with more than 99.8% columbic efficiency, suggesting that no gas evolution occurred during the cycling process in an acidic electrolyte solution.
000 deep C/DC cycles with more than 99.8% columbic efficiency, suggesting that no gas evolution occurred during the cycling process in an acidic electrolyte solution.
The rate performance is a key factor for any electrochemical cell to adopt in practical applications. The C/DC curves of the Fe3O4–GNS symmetric cell at various current densities are given in Fig. 8a. The specific capacitances obtained from the C/DC curves were 88, 82, 81.6, 80, 80 and 72 F g−1 at current densities of 0.25, 0.5, 0.75, 1.25, 2 and 3.75 A g−1, respectively. The cyclic behavior of the Fe3O4–GNS symmetric cell was examined at different current densities between 0–1 V for 500 cycles each (see Fig. S8 in the ESI†). As expected, the capacitance of the cell decreases linearly with increasing current densities, which is the typical behavior of ECs.2–13
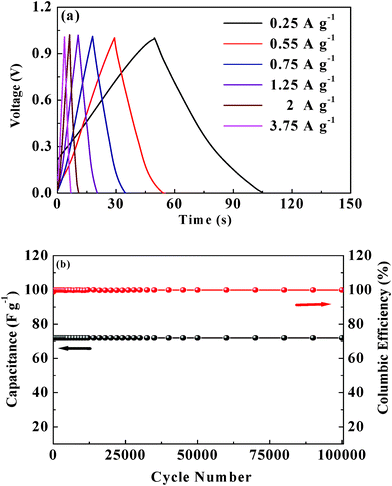 | ||
Fig. 8 (a) C/DC curves of the Fe3O4–GNS symmetric cell at different current densities between 0–1 V and (b) cycle performance of Fe3O4–GNS symmetric cell at 3.75 A g−1 for 100![[thin space (1/6-em)]](https://www.rsc.org/images/entities/char_2009.gif) 000 cycles. 000 cycles. | ||
This may be due to the fast reaction kinetics at high current in which the ions approach only the outer surface of the electrode material and hence reduce the complete utilization of active species.13,24 However, in the case of the Fe3O4–GNS symmetric cell, a small decrease in capacitance was observed with excellent cyclic performance because of its high electrical conductivity resulting from the incorporation of Fe3O4 nanoparticles within the graphene layers.
In order to find out the C/DC behavior of the cell under harsh conditions, the Fe3O4–GNS symmetric cell was charged and discharged at 3.75 A g−1 current density for 100![[thin space (1/6-em)]](https://www.rsc.org/images/entities/char_2009.gif) 000 cycles and the corresponding cycling behavior was illustrated in Fig. 8b. As seen from Fig. 8b, the symmetric cell delivered a capacitance of 72 F g−1 and exhibited an excellent cycle life with over 99.5% columbic efficiency until 100
000 cycles and the corresponding cycling behavior was illustrated in Fig. 8b. As seen from Fig. 8b, the symmetric cell delivered a capacitance of 72 F g−1 and exhibited an excellent cycle life with over 99.5% columbic efficiency until 100![[thin space (1/6-em)]](https://www.rsc.org/images/entities/char_2009.gif) 000 cycles without any capacitance fading. Moreover, the Rct value decreased after 100
000 cycles without any capacitance fading. Moreover, the Rct value decreased after 100![[thin space (1/6-em)]](https://www.rsc.org/images/entities/char_2009.gif) 000 cycles from 4.7 to 0.6 Ω (see Fig S9, ESI†), which is in good agreement with the C/DC results. This tremendous enhancement in cycling behavior even at high current density could result from the dispersion of magnetite nanoparticles over the surface of the GNS, not only improving the electrical conductivity, but also facilitating electrolyte adsorption through the open system (SEM in Fig. S2, ESI†), which stabilizes the electrode–electrolyte interface and hence exceptionally improves the rate capabilities.
000 cycles from 4.7 to 0.6 Ω (see Fig S9, ESI†), which is in good agreement with the C/DC results. This tremendous enhancement in cycling behavior even at high current density could result from the dispersion of magnetite nanoparticles over the surface of the GNS, not only improving the electrical conductivity, but also facilitating electrolyte adsorption through the open system (SEM in Fig. S2, ESI†), which stabilizes the electrode–electrolyte interface and hence exceptionally improves the rate capabilities.
On the other hand, the space beteen the graphene sheets allows volume expansion/contraction and also ensures the trapping of more electrolytes within the composite structure, which provides a flexible structure against inherent mechanical stresses which develop during cycling at a high rate C-DC process.
The average internal resistance (IR), energy (ED) and power (PD) densities of the Fe3O4–GNS symmetric cell were calculated using the formula reported elsewhere.34 The current dependence, PD and ED of the Fe3O4–GNS symmetric cell are summarized in Table 1. It is very clear that the Fe3O4–GNS symmetric cell has improved electrochemical properties compared to the Fe3O4 symmetric cell. For instance, Fe3O4–GNS delivered maximum energy and power densities of 11 Wh kg−1 and 200 W kg−1, respectively, when compared to the Fe3O4 symmetric cell, which exhibited energy and power densities of 0.5 Wh kg−1 and 100 W kg−1, respectively.
| Current density (A g−1) | Capacitance (F g−1) | Power density (W kg−1) | Energy density (Wh kg−1) |
|---|---|---|---|
| 0.25 | 88 | 200 | 11 |
| 0.50 | 82 | 400 | 10 |
| 0.75 | 81 | 600 | 10 |
| 1.25 | 80 | 1000 | 10 |
| 2 | 80 | 2000 | 10 |
| 3.75 | 72 | 3000 | 9 |
Moreover, the Fe3O4–GNS symmetric cell still maintained an energy density of 9 Wh kg−1 even at a power density of 3000 W kg−1. The better energy storing performance of the Fe3O4–GNS symmetric cell could be the result of the strong adsorption of Fe3O4 nanoparticles on the surface of the graphene sheets, and the sheets overlapping each other to form a conductive network via sheet plane contact.
This structure enhanced the overall electrical conductivity of the composite material and hence improved the electrochemical performances.39 Also, the larger surface area and small particle sizes of the Fe3O4–GNS composite quicken the electron/ion transport during the C/DC process even at high current rates. It was reported that the particle size and morphology of the electrode materials have a definite effect on the electrochemical properties.40 In addition, the open space formed between the GNSs during the synthesis of the Fe3O4–GNS composite was used for storing more electrolytes, avoiding electrolyte depletion and hence promoting the energy storage properties.
Conclusions
Highly dispersed and nano-sized Fe3O4 and an Fe3O4–GNS composite were successfully synthesized using a microwave-assisted low temperature method. The surface morphology and the structural characterization of the synthesized materials were investigated. The electrochemical capacitive behavior of Fe3O4 and Fe3O4–GNS based symmetric capacitor cells have been demonstrated in 1 M H2SO4 electrolyte between 0–1 V. The results revealed that the symmetric cell, consisting of composite electrodes, showed excellent electrochemical performance in terms of high capacitance, energy and power densities as well as an excellent rate performance compared to the Fe3O4 cell. The Fe3O4–GNS symmetric cell was tested under high current densities ranging from 1.25 to 3.75 A g−1 and was found to be capable of delivering high capacitance with almost 100% columbic efficiency for prolonged cycles. Meanwhile, the composite cell also exhibited low charge transfer resistance which was attributed to the uniform particle size, distribution on the GNS surface and the relatively large surface area of the electrode material. The possible explanation for the improved electrochemical performance could thus be concluded as follows: the strong absorption of Fe3O4 on the graphene surface prevented the agglomeration of graphene sheets and hence increased the ion diffusion rate as well as the conductivity, which resulted in the excellent electrochemical performance of the composite electrode even at high current densities.References
- B.E. Conway, J. Electrochem. Soc., 1991, 138, 1539–1548 CrossRef CAS.
- W. Kim, J.B. Joo, N. Kim, S. Oh, P. Kim and J. Yi, Carbon, 2009, 47, 1407–1411 CrossRef CAS.
- Y.J. Lee, J.C. Jung, J. Yi, S.H. Baeck, J.R. Yoon and I.K. Song, Curr. Appl. Phys., 2010, 10, 682–686 CrossRef.
- J.R. Miller, R.A. Outlaw and B.C. Holloway, Science, 2010, 329, 1637–1639 CrossRef CAS.
- K. Karthikeyan, V. Aravindan, S.B. Lee, I.C. Jang, H.H. Lim, G.J. Park, M. Yoshio and Y.S. Lee, J. Power Sources, 2010, 195, 3761–3764 CrossRef CAS.
- K. Karthikeyan, V. Aravindan, S.B. Lee, I.C. Jang, H.H. Lim, G.J. Park, M. Yoshio and Y.S. Lee, J. Alloys Compd., 2009, 504, 224–227 CrossRef.
- V.D. Patake, S.M. Pawar, V.R. Shinde, T.P. Gujar and C.D. Lokhande, Curr. Appl. Phys., 2010, 10, 99–103 CrossRef.
- D.S. Dhawale, R.R. Salunkhe, V.S. Jamadade, D.P. Dubal, S.M. Pawar and C.D. Lokhande, Curr. Appl. Phys., 2010, 10, 904–909 CrossRef.
- C.C. Hu, K.H. Chang, M.C. Lin and Y.T. Wu, Nano Lett., 2006, 6, 2690–2695 CrossRef CAS.
- J.W. Lang, L.B. Kong, W.J. Wu, Y.C. Luo and L. Kang, Chem. Commun., 2008, 4213–4218 RSC.
- G.X. Wang, X.P. Shen, J. Horvat, B. Wang, H. Liu, D. Wexler and J. Yao, J. Phys. Chem. C, 113(2009), 4357–4361 CAS.
- R.N. Reddy and R.G. Reddy, J. Power Sources, 2003, 124, 330–337 CrossRef CAS.
- K. Karthikeyan, S. Amaresh, D. Kalpana, R. KalaiSelvan and Y.S. Lee, J. Phys. Chem. Solids, 2012, 73, 363–367 CrossRef CAS.
- N.L. Wu, S.Y. Wang, C.Y. Han and L.R. Shiue, J. Power Sources, 2003, 113, 173–178 CrossRef CAS.
- J. Chen, K. Huang and S. Liu, Electrochim. Acta, 2009, 55, 1–5 CrossRef CAS.
- W. Weiss and W. Ranke, Prog. Surf. Sci., 2002, 70, 1–151 CrossRef CAS.
- X. Li, X. Huang, D. Liu, X. Wang, S. Song, L. Zhou and H. Zhang, J. Phys. Chem. C, 2011, 115, 21567–21573 CAS.
- M.K. Krause, M. Ziese, R. Hohne and A. Pan, J. Magn. Magn. Mater., 2002, 242, 662–664 CrossRef.
- S.Y. Wand and N.L. Wu, J. Appl. Electrochem., 2003, 33, 345–348 CrossRef.
- Q. Qu, S. Yang and X. Feng, Adv. Mater., 2011, 23, 5574–5580 CrossRef CAS.
- X. Zhao, C. Johnston, A. Crossley and P.S. Grant, J. Mater. Chem., 2010, 20, 7637–7637 RSC.
- Y.H. Kim and S.J. Park, Curr. Appl. Phys., 2011, 11, 462–466 CrossRef.
- A.K. Mishra and S. Ramaprabhu, J. Phys. Chem. C, 2011, 115, 14006–14013 CAS.
- W. Shi, J. Zhu, D.H. Sim, Y.Y. Tay, Z. Lu, X. Zhang, Y. Sharma, M. Srinivasan, H. Zhang, H.H. Hng and Q. Yan, J. Mater. Chem., 2011, 21, 3422–3427 RSC.
- M.L. Chen, C.Y. Park, J.G. Choi and W.C. Oh, J. Korean Ceram. Soc., 2011, 48, 147–151 CrossRef CAS.
- Y.J. Mai, X.L. Wang, J.Y. Xiang, Y.Q. Qiao, D. Zhang, C.D. Gu and J.P. Tu, Electrochim. Acta, 2011, 56, 2306–2311 CrossRef CAS.
- H.L. Wang, J.T. Robinson, G. Diankov and H.J. Dai, J. Am. Chem. Soc., 2010, 132, 3270–3271 CrossRef CAS.
- D. Maity1 and D.C. Agrawa, J. Magn. Magn. Mater., 2007, 308, 46–55 CrossRef.
- C.E. Salmas and G.P. Androutsopoulos, Langmuir, 2005, 21, 11146–11160 CrossRef CAS.
- Y. Tian, B.B. Yu, X. Li and K. Li, J. Mater. Chem., 2011, 21, 2476–2481 RSC.
- S.F. Waseem, S.D. Gardner, G. He, W. Jiang and U. Pittmann, J. Mater. Sci., 1998, 33, 3151–3162 CrossRef CAS.
- D. Li, M.B. Muller, S. Gilie, R.B. Kaner and G.G. Wallace, Nat. Nanotechnol., 2008, 3, 101–105 CrossRef CAS.
- X.L. Li, G.Y. Zhang, X.D. Bai, X.M. Sun, X.R. Wang, E.G. Wang and H.J. Dai, Nat. Nanotechnol., 2008, 3, 538–542 CrossRef CAS.
- Y. Zhu, S. Murali, M.D. Stoller, K.J. Ganesh, W. Cai, P.J. Ferreira, A. Pirkle, R. M. Wallace, K.A. Cychosz, M. Thommes, D. Su, E.A. Stach and R.S. Ruoff, Science, 2011, 332, 1537–1541 CrossRef CAS.
- J.H. Jiang and A. Kucernak, Electrochim. Acta, 2002, 47, 2381–2386 CrossRef CAS.
- D.X. Wang, C. Yang, C.M. Ming and J. Yang, J. Inorg. Mater., 2008, 23, 1193–1198 CrossRef.
- S. Alvarez, L.M.C. Blanco, O.A.J. Miranda, A.B. Fuertes and T.A. Centeno, Carbon, 2005, 43, 864–866 CrossRef.
- V. Khomenko, E. Raymundo-Pi˜nero and F. Béguin, J. Power Sources, 2006, 153, 183–190 CrossRef CAS.
- J. Wang, Z. Gao, Zhanshuang Li, Bin Wang, Yanxia Yan, Qi Liu, Tom Mann, Milin Zhang and Zhaohua Jiang, J. Solid State Chem., 2011, 184, 1421–1427 CrossRef CAS.
- G.T. Fey, Y.D. Cho and T.P. Kumar, Mater. Chem. Phys., 2004, 87, 275–284 CrossRef CAS.
Footnote |
| † Electronic supplementary information (ESI) available: Experimental procedure, Raman spectra, SEM images, N2 isotherms of adsorption/desorption, XPS spectra, TGA and electrochemical measurements for single electrodes and symmetric cells. |
| This journal is © The Royal Society of Chemistry 2012 |
