Synthesis and properties of aggregation-induced emission enhancement compounds derived from triarylcyclopentadiene†
Lijian
Yang
,
Junwei
Ye
*,
Lifeng
Xu
,
Xinyu
Yang
,
Weitao
Gong
,
Yuan
Lin
and
Guiling
Ning
*
State Key Laboratory of Fine Chemicals and School of Chemical Engineering, Dalian University of Technology, 2 Linggong Road, Dalian 116012, P. R. China. E-mail: junweiye@dlut.edu.cn; ninggl@dlut.edu.cn; Fax: +86-411-84986067
First published on 1st October 2012
Abstract
A series of triarylcyclopentadiene derivatives were synthesized and their crystal structures and photoluminescence properties in solution and aggregation state were studied. Their maximum fluorescence emission wavelengths were 452–483 nm. Four of them have weak emission in solution but intense emission when aggregated in water/acetonitrile mixture or in crystals showing a typical aggregation-induced emission enhancement (AIEE). The crystal structure analysis reveals that the aromatic C–H⋯π interactions are the origin of the AIEE. Additionally, DFT calculations, and the thermal and electrochemical properties of these compounds were investigated.
Introduction
Luminescent organic molecules have attracted great interest for their potential applications in fluorescence sensors,1 flat panel displays and illumination,2etc. Unfortunately, most of them are usually weak or even non-emitting in their solid state in contrast to the strong fluorescence in their dilute solutions, which is an obstacle for applications because organic emissive materials in the devices are normally used as thin solid films.3 This has driven researchers to search for anti-aggregation-caused quenching materials that have higher luminescent efficiency in the aggregated state than that in the dissolved state. Successful exploration was pioneered by Tang et al., who synthesized a series of aromatic siloles that show unique enhanced emission rather than fluorescence quenching in aggregates, named aggregation induced emission (AIE).4 Up to now, most reported AIE or AIEE (aggregation induced emission enhancement) systems are limited to aromatic silole derivatives, 1,1,2,2-tetraphenylethene (TPE) derivatives and 1-cyano-trans-1,2-bis-(4-methylbiphenyl)-ethylene (CN-MBE).5 It is desirable to develop more types of materials with AIEE property.On the other hand, cyclopentadiene derivatives have drawn much concern for over two decades as a kind of typical functional luminescent organic molecule.6 Two cyclopentadiene derivatives with phenyl groups named 1,2,3,4-tetraphenyl-1,3-cyclopentadiene (TPCP) and 1,2,3,4,5-pentaphenyl-1,3-cyclopentadiene (PPCP) have been studied in solution and solid state.6a Their good electrical and optical properties make them widely used in electroluminescent devices.6b–g Recently, TPCP was tested to have AIE properties by Tang et al.6h and PPCP was proved to have multicolor emission in nano-aggregation by Yao et al.6i Our research focuses on design and synthesis of proper luminescent model compounds and discovery of the relations between chemical structures and luminescent properties.
In this Article, we present the synthesis, crystal structures and properties of a new class of triarylcyclopentadiene derivatives with strong blue light emission in solid state. Their structures are characterized by proton and carbon-13 nuclear magnetic resonance (1H NMR and 13C NMR), high resolution mass spectroscopy (HRMS) and X-ray single crystal diffraction. The relationship between AIEE properties and molecular interactions and stacking modes is also investigated. The optoelectronic and thermal properties are tuned by changing the substituent groups. The good thermal stability and high crystalline state photoluminescence (PL) efficiency make them promising candidates as luminescent materials for electroluminescence applications.
Result and discussion
Synthesis
Scheme 1 illustrates the synthetic routes to the target compounds 1–7. The appropriate aryl aldehydes coupled with acetyl benzene via aldol condensation reaction7 to form intermediates 1,3,5-triaryl-1,5-pentanediones. The crude intermediates then cyclised in Zn/CH3COOH system, and dehydrated in the presence of concentrated hydrochloric acid to afford cyclopentadiene derivates 1–5. The compounds 6 and 7 were synthesized by the palladium-catalyzed Suzuki coupling reactions of 1,2-diphenyl-4-(4-bromophenyl)-1,3-cyclopentadiene with phenylboronic acid and 1-naphthylboronic acids with high yield of 80% and 85%, respectively. The Suzuki reaction was catalyzed by Pd(PPh3)4 in toluene/ethanol (3/1) mixture in presence of K2CO3 (2 M) as base source. The products were purified by column chromatography on silica gel using dichloromethane/n-hexane as eluent. The compounds were characterized by 1H NMR, 13C NMR, HRMS, MS and single-crystal X-ray diffraction (Fig. S1–21 in the ESI†).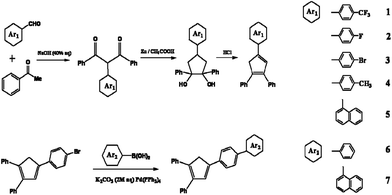 | ||
| Scheme 1 Synthesis routes to the compounds 1–7. | ||
Optical properties and AIEE properties
The luminescent properties of the compounds 1–7 in acetonitrile solution and in solid state were investigated by UV-Vis absorption spectroscopy (UV) and photoluminescence (PL) spectroscopy. The spectra are provided in the ESI† (Fig. S22–24). The maximum absorption wavelengths (λabs) were in the range of 347–365 nm (Table 1) which was caused by a π–π transition of the molecular plane. Clearly, the electron withdrawing and donating of substituting groups hardly affected the maximum absorption wavelength. The λabs values of 6 and 7 slightly red-shifted to 365 nm and 364 nm, respectively, which indicated that the fused ring units had influence on the maximum absorption wavelength. The PL spectra of these compounds in acetonitrile solution (50 μM) exhibited weak blue light emission with maximum emission at 447–466 nm. Compared with the weak emission in acetonitrile, these compounds show strong fluorescence in crystal state (Fig. S24, ESI†). The PL data are summarized in Table 1. As shown in Fig. 1, 1, 4, 5 and 6 emit strong blue light in the crystal. The maximum emission wavelengths of these compounds were red-shifted (10–30 nm) in the case of crystals.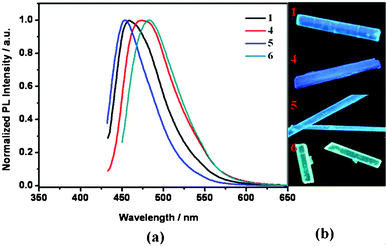 | ||
| Fig. 1 (a) Photoluminescence spectra and (b) photographs of crystals 1, 4, 5 and 6 under the irradiation of a UV lamp (λmax = 365 nm). | ||
To study the AIE or AIEE properties of these compounds, the fluorescent behaviors were studied through addition of a poor solvent into a good one. In this experiment, water and acetonitrile were chosen as the solvent pair. Because these compounds are insoluble in water, their existing states can be changed by the increase of the water fraction in the mixed solvents, from the well dispersed state in pure acetonitrile to aggregated particles. As a result, compounds 1, 2, 4 and 5 have AIEE characteristics.
The PL and UV spectra in water/acetonitrile mixtures with different water fractions are shown in Fig. 2 and S25, ESI†. Taking 1 as an example (Fig. 2a), it is clear that if 1 was in pure CH3CN or in the mixtures with water fraction <50%, very weak PL intensity and photoluminescence signals can be detected. When the water fraction reaches 60% and 70%, a slight enhancement of emission is observed. After that, the fluorescent intensity is significantly enhanced when the water fraction exceeds 80% and achieves maximum intensity when the water fraction is up to 90%. This increase in PL intensity can be attributed to an AIEE effect caused by the formation of molecular aggregates, in which the restriction of intramolecular rotations leads to increased fluorescent emission. The absorption spectra of 1 in water/acetonitrile mixtures was shown in Fig. S25, ESI†. The spectral profile is virtually unchanged when up to 50% water was added to the acetonitrile solution. As the water fraction reached to 60%, the whole spectrum started to drop, which was due to decrease of concentration caused by aggregation. When the water fraction was further increased, the whole spectrum started to rise and broaden. The increase in the absorbance was due to light scattering of the nano-aggregates, which effectively decreased the light transmission through the mixtures. The broad change in the shape of the absorbance from 80% water fraction agreed well with the sudden jump in the PL intensity. These results confirm that the molecules started to markedly aggregate when >70% of the poor solvent (water) was added to the acetonitrile solution. As seen in the PL spectra of 2 and 4 (Fig. 2b and 2c), slight decreases in PL intensity in the later stage are observed with increasing water fraction. The possible reason is as follows: with the increase of aggregates size caused by adding water to the mixtures, the number of emissive molecules located at the surface of the aggregates decreased.8 In other words, after aggregation, the particle size further increased after the addition of more water.
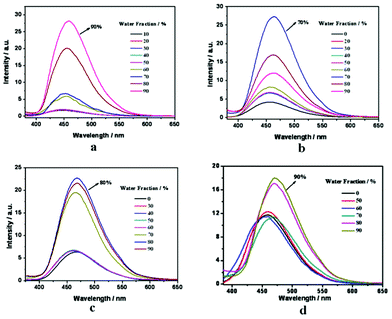 | ||
| Fig. 2 PL spectra of compounds 1 (a), 2 (b), 4 (c) and 5 (d) in water/CH3CN mixtures with different water fractions. | ||
In previous work, several mechanisms have been proposed to explain the AIE processes, mainly including restriction of intramolecular rotation such as TPCP molecule and a series silole molecules4e and formation of J-aggregates such as CN-MBE.5g However, the effects of molecular structure/conformation and packing arrangement on the AIE(E) processes have rarely been investigated.9
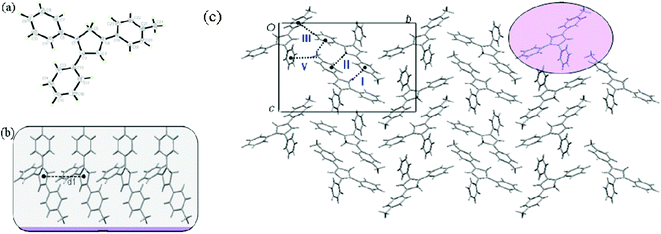
To further explain the relation between AIEE progress and molecular structures, the crystals of compounds 1, 4, 5 and 6 were successfully obtained from dichloromethane/methanol mixtures. Single crystal X-ray analysis reveals the molecule structures and packing networks of 1, 4, 5 and 6, respectively (Fig. 3–6). Table 2 gives the selected dihedral angles between the phenyl moieties and central Cp ring of the four compounds in crystal structures. There are large distortions along the 2-phenyl and 3-phenyl detections in all these molecules, which means the backbone of the compounds largely deviates from a plane and cofacial π–π stacking becomes impossible. Besides, the ‘slipped-parallel’ structure of these four compounds avoids the maximum face-to-face stacking. Taking 1 as an example, as shown in Fig. 3b, there are two aromatic C–H⋯π interactions between two single molecules with an interaction distance of 3.16 Å (I) and 3.30 Å (II), respectively to form a dimer. This structural feature further increases the rigidity of the molecules by restricting vibration and rotation, and thus could improve the fluorescence intensity. As shown in Fig. 3c and 3d, the dimers are packed into molecular columns that are perpendicular to the plane of the central Cp rings, which is derived by C–H⋯π hydrogen bonds (III: 3.15 Å; IV: 3.34 Å) between two dimers. The distance between two molecules within one column is 4.09 Å (d1), and thus might influence the fluorescence intensity. Similar crystal packing structures are also observed for the other derivatives 4 (Fig. 4) and 5 (Fig. 5), which indicate the generality of this packing structure for triarylcyclopentadiene derivatives with AIEE properties. As for the crystal of 6 (Fig. 6), the introduction of terminal phenyl ring on the 4-phenyl segment increases the resistance between molecules. The relatively large C–H⋯π interaction distance (>4 Å) has less effect on the rotation of phenyl groups and a slight photoluminescence intensity change is observed in the AIEE experiment. However, compound 7 is AIEE-inactive. The possible reason for this phenomenon was attributed to a geometrically asymmetric and large substituent group in the 4-position of 7. Thus many molecular voids and large free volumes are allowed in this structural geometry of the aggregates that may enable its aryl rings to rotate even in the solid state, which makes it show little difference of emission in the solution and solid state.
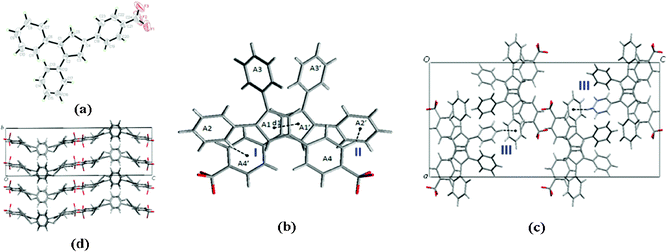 | ||
| Fig. 3 (a) ORTEP drawing of 1 with 30% probability thermal ellipsoids; (b) the schematic C–H⋯π interactions in 1. The distance between two molecules within one column (d1) is 4.09 Å. The interaction distance and the angle of C–H⋯π center for interaction I are 3.16 Å and 143°, and for interaction II they are 3.30 Å and 107°, respectively; (c) the schematic C–H⋯π interactions between dimers in 1. The interaction distance and the angle of C–H⋯π center for interaction III are 3.25 Å and 133°; (d) packing arrangement of 1, viewed down the a axis. | ||
 | ||
| Fig. 4 (a) ORTEP drawing of 4 with 30% probability thermal ellipsoids; (b) stacking images of 4. The distance between two molecules within one column (d1) is 5.86 Å; (c) the schematic C–H⋯π interactions in 4. The interaction distance and the angle of the C–H⋯π center for interaction I are 2.70 Å and 166°, for interaction II they are 2.78 Å and 145°, for interaction III are 2.80 Å and 151°, and for interaction IV they are 3.30 Å and 131°, respectively. | ||
 | ||
| Fig. 5 (a) ORTEP drawing of 5 with 30% probability thermal ellipsoids; (b) the schematic C–H⋯π hydrogen bonds interactions in 5. The distance between two molecules within one column (d1) is 4.25 Å. The interaction distance and the angle of C–H⋯π center for interaction I are 2.97 Å and 164°, and for interaction II they are 3.09 Å and 138°, respectively; (c) the schematic C–H⋯π hydrogen bonds interactions between dimers in crystal. The interaction distance and the angle of C–H⋯π center for interaction III are 3.15 Å and 133°, and for interaction IV they are 3.34 Å and 135°, respectively; (d) packing arrangement of 5, viewed down the a axis. | ||
 | ||
| Fig. 6 (a) ORTEP drawing of 6 with 30% probability thermal ellipsoids; (b) the distance between two molecules within one column (d1) is 8.35 Å; (c) packing arrangement of 6, viewed down the a axis. | ||

|
Dihedral angle/° | |||
| A1–A2 | A1–A3 | A1–A4 | A1–A5 | |
| 1 | 27.8 | 43.7 | 14.9 | — |
| 4 | 23.3 | 50.9 | 20.1 | — |
| 5 | 37.6 | 38.5 | 39.4 | — |
| 6 | 35.6 | 32.0 | 24.0 | 49.7 |
Thermal properties
The thermal properties of these compounds were investigated by differential scanning calorimetry (DSC) and thermogravimetric analysis (TGA) (Table 3). The DSC curves (Fig. S26, ESI†) for the samples recorded during the second heating runs at a scan rate of 10 °C min−1. It can be seen that 5, 6, and 7 exhibited a glass transition peak and the glass transition temperatures (Tg) are 37, 50 and 61 °C, respectively. The Tg of 7 is the highest due to the bulky 4-(naphthyl)phenyl group. The DSC curves of 1, 2, 4 and 6 show strong melting peaks at 170, 131, 163 and 175 °C, respectively. However, the fused ring substituted derivatives 5 and 7 have no crystallization and melting peaks but only glass transition peaks. This indicates that the presence of the fused ring units effectively suppressed the crystallinity and resulted in crystallization peaks at 73 and 70 °C, respectively, which indicates that the crystallization of 2 and 4 occurred at a very fast speed and there existed no amorphous glassy phase after cooling from its melt. This is why there is no glass transition peak in their heating DSC curves.| Compounds | T g/°C | T m/°C | T d/°C |
|---|---|---|---|
| 1 | N/A | 170 | 207 |
| 2 | N/A | 131 | 233 |
| 3 | N/A | N/A | 222 |
| 4 | N/A | 163 | 208 |
| 5 | 37 | N/A | 281 |
| 6 | 50 | N/A | 285 |
| 7 | 61 | N/A | 289 |
The decomposition temperature (Td) is defined as the temperature at which 5% weight loss occurs during heating in N2 atmosphere. As shown in Table 3 and Fig. S27, ESI†, the compounds were stable after they started to decompose at 207–289 °C. When comparing the Td of the compounds, introduction of halogen atom (F, Br) slightly improves the thermal stability due to p–π electron conjugation effect. Furthermore, the Td values of 5, 6 and 7 are 281, 285 and 289 °C, respectively, indicating that the aromatic ring groups make compounds much more thermally stable. The thermal stability of organic luminescent molecules plays an important role in the stability and lifetime of OLEDs.
Electrochemical properties and theoretical calculations
It is well-known that the highest occupied molecular orbital (HOMO), the lowest unoccupied molecular orbital (LUMO) and energy band gaps (ΔEg) are three important parameters for electroluminescent materials. Based on cyclic voltammetry (CV) and UV absorption spectra, the HOMO levels and ΔEg were obtained using the onset oxidation potential in the CV curves (Fig. S28, ESI†) and the onset wavelength of their UV absorption (Fig. S22, ESI†), respectively.10 The HOMO, LUMO and ΔEg values are listed in Table S1, ESI†. The ΔEg values of the compounds were found to be in the range of 3.00–3.12 eV and the HOMO values ranged from 5.34 to 5.53 eV.To further understand the correlation between structure and the physical, quantum chemistry computations were conducted. The geometries of the molecules have been optimized using DFT calculations with the Gaussian 09 program.11 In particular, we used the B3LYP exchange–correlation functional and a 6–31 g* basis set. Fig. S29, ESI† shows the optimized geometries and the orbital distributions of HOMO and LUMO energy levels of these compounds. The LUMOs and the electron clouds of the HOMOs of these molecules are dominated by the whole molecules, showing the weak intramolecular charge transfer of these compounds.
Conclusions
In summary, a new class of AIEE compounds based on cyclopentadiene derivatives combined with different aryl groups was synthesized. The AIEE properties mechanism were illustrated by UV and PL spectrum as well as crystal structures. The C–H⋯π hydrogen bonds increase the rigidity of the molecules by restricting vibration and rotation, leading to the enhancement of the fluorescence intensity. These compounds emit strong blue light in the crystal state with the emission wavelengths from 447–466 nm and show high thermal stability with the decomposition temperatures (Td) of 207–289 °C. The ΔEg values of the compounds are found to be in the range of 3.00–3.12 eV and the HOMO values range from 5.34 to 5.53 eV. These compounds have potential applications in light emitters and display.Materials and measurements
All reagents are off-the-shelf commercial products. The solvents were purified with standard methods and dried as needed. Proton and carbon-13 nuclear magnetic resonance (1H NMR and 13C NMR) spectra were measured on a Bruker AVANCE-400 spectrometer. Mass spectra were measured on an Agilent 6310 MS spectrometer and an HPLC/MS HP 1100 spectrometer. HRMS were measured on Micromass-GTC spectrometer. Photoluminescence spectra (PL) were conducted with a JASCO FP-6300 spectrofluorometer. Absorption spectra were determined on HITACHI U-4100 UV-vis Spectrophotometer. The relative fluorescence quantum yields were estimated relative to solutions of 10−4 M quinine sulfate with ΦF = 0.55 in 0.1 M sulfuric acid solution as a standard sample,12 and the relative solid fluorescence quantum yields were measured on a Edinburgh Instruments FS920 integral sphere system. All spectra were measured at room temperature. Differential scanning calorimetry (DSC) curves were obtained with a TA Instruments thermal analyzer (910S) at a heating rate of 10 °C min−1 under an N2 atmosphere. Thermogravimetric analyses (TGA) were performed with a METTLER TOLEDO (TGA/SDTA 851e) under a N2 atmosphere with a heating rate of 10 °C min−1. Cyclic voltammetry (CV) measurement was carried out on a Shanghai Chenhua electrochemical workstation CHI610D in a three-electrode cell with a Pt disk working electrode, a Ag/AgNO3 reference electrode, and a glassy carbon counter electrode. All CV measurements were performed under an inert N2 atmosphere with supporting electrolyte of 0.01 M tetra-n-butylammonium hexafluorophosphate in acetonitrile at a scan rate of 100 mV s−1 using ferrocene (Fc) as standard.X-ray crystal structure determinations were performed on a Bruker SMART APEX CCD diffractometer with graphite monochromated Mo-Kα radiation (λ = 0.71073 Å) using the SMART and SAINT programs. The structures were solved by direct methods and refined on F2 by full-matrix least-squares methods with SHELXTL version 5.1. All non-hydrogen atoms were refined anisotropically. Crystallographic data for 1, 4, 5 and 6 have been deposited in the Cambridge Crystallographic Data Centre with reference numbers 894149–894152. A summary of the crystallographic data and structure refinements of 1, 4, 5 and 6 are tabulated in Table 4. The selected bond lengths and angles for 1, 4, 5 and 6 are listed in Table S2–S5 (In ESI†).
| Identification | 1 | 4 | 5 | 6 |
|---|---|---|---|---|
| a R 1 = Σ||Fo| − |Fc||/Σ|Fo|; wR2 = {Σ[w(Fo2 − Fc2)2]/Σ[w(Fo2)]2}1/2. | ||||
| Empirical formula | C24H17F3 | C24H20 | C27H20 | C29H22 |
| Formula weight | 362.38 | 308.40 | 344.43 | 370.47 |
| Crystal system | Orthorhombic | Monoclinic | Orthorhombic | Triclinic |
| Space group | Pbca | P21/n | Pca21 | P1 |
| a/Å | 14.213(8) | 5.9678(3) | 14.060(5) | 8.3555(5) |
| b/Å | 7.615(4) | 18.3299(7) | 17.548(6) | 11.4727(6) |
| c/Å | 34.237(18) | 15.8727(7) | 7.824(3) | 21.3695(12) |
| Volume/Å3 | 3705(3) | 1713.79(13) | 1930.4(12) | 2027.4(2) |
| Z | 8 | 4 | 4 | 4 |
| D Calc (mg m−3) | 1.299 | 1.195 | 1.185 | 1.214 |
| μ/mm−1 | 0.095 | 0.067 | 0.067 | 0.069 |
| F(000) | 1504 | 656 | 728 | 784 |
| R int | 0.0644 | 0.0222 | 0.0504 | 0.0354 |
| GOF on F2 | 1.029 | 1.057 | 0.989 | 1.001 |
| R 1 a [I > 2σ(I)]* | 0.0725 | 0.0459 | 0.0528 | 0.0534 |
| wR2 [I > 2σ(I)]* | 0.2080 | 0.1209 | 0.0875 | 0.1026 |
| R 1 (all data) * | 0.1488 | 0.0591 | 0.1531 | 0.1130 |
| wR2 (all data)* | 0.2621 | 0.1309 | 0.1156 | 0.1267 |
General procedure for the synthesis of compounds 1–5
The target compounds were synthesized according to literature in essentially similar procedures. An illustrative example is provided for compound 5.![[thin space (1/6-em)]](https://www.rsc.org/images/entities/char_2009.gif) :
:![[thin space (1/6-em)]](https://www.rsc.org/images/entities/char_2009.gif) 5, v/v) to yield 5 as a light-green powder.
5, v/v) to yield 5 as a light-green powder.
General procedure for the synthesis of compounds 6 and 7
Aqueous K2CO3 solution (2 M, 3 mL) was added to a solution of compound 3 (0.76 g, 2 mmol) and corresponding boric acid (2 mmol) in toluene/ethanol (20 mL/7 mL), and the mixture was stirred for 30 min under an argon atmosphere. Then, the Pd(PPh3)4 catalyst (0.11 g, 5 mol%) was added to the mixture, which was then stirred at 82 °C for 24 h. After cooling to room temperature, the product was concentrated and purified by silica gel column chromatography using DCM/n-hexane (v/v) as the eluent to obtain pure products.Acknowledgements
This work was supported by the National Natural Science Foundation of China (51003009 and 20772014), Specialized Research Fund for the Doctoral Program of Higher Education (200801411121) and the Fundamental Research Funds for the Central Universities of China (DUT11LK16).References
- (a) L. Zeng, E. W. Miller, A. Pralle, E. Y. Isacoff and C. J. Chang, J. Am. Chem. Soc., 2006, 128, 10 CrossRef CAS; (b) X. Y. Liu, D. R. Bai and S. Wang, Angew. Chem., 2006, 118, 5601 CrossRef; (c) F. F. Wang, J. Y. Wen, L. Y. Huang, J. J. Huang and J. Ouyang, Chem. Commun., 2012, 48, 7395 RSC; (d) T. Y. Han, X. Feng, B. Tong, J. B. Shi, L. Chen, J. G. Zhi and Y. P. Dong, Chem. Commun., 2012, 48, 416 RSC.
- (a) C. W. Tang and S. A. VanSlyke, Appl. Phys. Lett., 1987, 51, 913 CrossRef CAS; (b) C. Adachi, T. Tsutsui and S. Saito, Appl. Phys. Lett., 1990, 57, 531 CrossRef CAS; (c) B. W. D'Andrade and S. R. Forrest, Adv. Mater., 2004, 16, 1585 CrossRef; (d) M. A. Baldo, M. E. Thomson and S. R. Forrest, Nature, 2000, 403, 750 CrossRef CAS.
- (a) H. Klauk, Chem. Soc. Rev., 2010, 39, 2643 RSC; (b) H. E. Katz, J. Mater. Chem., 1997, 7, 369 RSC; (c) A. Dreuw, J. Plöner, L. Lorenz, J. Wachtveitl, J. E. Djanhan, J. Brüning, T. Metz, M. Bolte and M. U. Schmidt, Angew. Chem., Int. Ed., 2005, 44, 7783 CrossRef CAS; (d) Y. Ooyama and K. Yoshida, New J. Chem., 2005, 29, 1204 RSC; (e) S. Mizukami, H. Houjou, K. Sugaya, E. Koyama, H. Tokuhisa, T. Sasaki and M. Kanesato, Chem. Mater., 2005, 17, 50 CrossRef CAS; (f) Y. Liu, X. T. Tao, F. Z. Wang, J. H. Shi, J. L. Sun, W. T. Yu, Y. Ren, D. C. Zou and M. H. Jiang, J. Phys. Chem. C, 2007, 111, 6544 CrossRef CAS.
- (a) J. D. Luo, Z. L. Xie, J. W. Y. Lam, L. Cheng, H. Y. Chen, C. F. Qiu, H. S. Kwok, X. W. Zhan, Y. Q. Liu, D. B. Zhu and B. Z. Tang, Chem. Commun., 2001, 1740 RSC; (b) J. W. Chen, C. C. W. Law, J. W. Y. Lam, Y. P. Dong, S. M. F. Lo, I. D. Williams, D. B. Zhu and B. Z. Tang, Chem. Mater., 2003, 15, 1535 CrossRef CAS; (c) J. W. Chen, H. Peng, C. C. W. Law, Y. P. Dong, J. W. Y. Lam, I. D. Williams and B. Z. Tang, Macromolecules, 2003, 36, 4319 CrossRef CAS; (d) J. W. Chen, B. Xu, X. Y. Ouyang, B. Z. Tang and Y. Cao, J. Phys. Chem. A, 2004, 108, 7522 CrossRef CAS; (e) Y. N. Hong, J. W. Y. Lama and B. Z. Tang, Chem. Commun., 2009, 4332 RSC; (f) G. Yu, S. W Yin, Y. Q. Liu, J. S. Chen, X. J. Xu, X. B. Sun, D. G. Ma, X. W. Zhan, Q. Peng, Z. G. Shuai, B. Z. Tang, D. B. Zhu, W. H. Fang and Y. Luo, J. Am. Chem. Soc., 2005, 127, 6335 CrossRef CAS; (g) Y. Ren, J. W. Y. Lam, Y. Q. Dong, B. Z. Tang and K. S. Wong, J. Phys. Chem. B, 2005, 109, 1135 CrossRef CAS.
- (a) Y. N. Hong, J. W. Y. Lam and B. Z. Tang, Chem. Commun., 2009, 4332 RSC; (b) Y. S. Zhao, H. B. Fu, A. D. Peng, Y. Ma, D. B. Xiao and J. N. Yao, Adv. Mater., 2008, 20, 2859 CrossRef CAS; (c) J. W. Chen, C. C. W. Law, J. W. Y. Lam, Y. P. Dong, S. M. F. Lo, I. D. Williams, D. B. Zhu and B. Z. Tang, Chem. Mater., 2003, 15, 1535 CrossRef CAS; (d) Y. Ren, J. W. Y. Lam, Y. Dong, B. Z. Tang and K. S. Wong, J. Phys. Chem. B, 2005, 109, 1135 CrossRef CAS; (e) H. Tong, Y. Q. Dong, M. Haubler, J. W. Y. Lam, H. H. Y. Sung, I. D. Williams, J. Z. Sun and B. Z. Tang, Chem. Commun., 2006, 1133 RSC; (f) F. Wang, M. Y. Han, K. Y. Mya, Y. Wang and Y. H. Lai, J. Am. Chem. Soc., 2005, 127, 10350 CrossRef CAS; (g) B. K. An, D. S. Lee, J. S. Lee, Y. S. Park, H. S. Song and S. Y. Park, J. Am. Chem. Soc., 2004, 126, 10232 CrossRef CAS; (h) J. W. Chen, B. Xu, X. Y. Ouyang, B. Z. Tang and Y. Cao, J. Phys. Chem. A, 2004, 108, 7522 CrossRef CAS; (i) X. Q. Zhang, Z. G. Chi, H. Y. Li, B. J. Xu, X. F. Li, S. W. Liu, Y. Zhang and J. R. Xu, J. Mater. Chem., 2011, 21, 1788 RSC.
- (a) X. C. Gao, H. Cao, L. Huang, Y. Y. Huang, B. W. Zhang and C. H. Huang, Appl. Surf. Sci., 2003, 210, 183 Search PubMed; (b) K. Sugiyama, D. Yoshimura, T. Miyamae, T. Miyazaki and H. Ishii, et al., J. Appl. Phys., 1998, 83, 4928 CrossRef CAS; (c) Y. Ohmori, Y. Hironaka, M. Yoshida, N. Tada, A. Fujii and K. Yoshino, Synth. Met., 1997, 85, 1241 CrossRef CAS; (d) K. Yoshino, K. Tada, M. Hirobata, H. Kajii, Y. Hironaka, N. Tada, Y. Kaneuchi, M. Yoshida, A. Fujii, M. Hamaguchi, H. Araki, T. Kawai, M. Ozaki, Y. Ohmori, M. Onoda and A. A. Zakhidov, Synth. Met., 1997, 84, 477 Search PubMed; (e) C. Adachi, T. Tsutsui and S. Saito, Appl. Phys. Lett., 1990, 56, 799 CrossRef CAS; (f) N. Tada, A. Fujii, Y. Ohmori and K. Yoshino, IEEE Trans. Electron Devices, 1997, 44, 1234 CrossRef CAS; (g) Y. Ohmori, N. Tada, A. Fujii, H. Ueta, T. Sawatani and K. Yoshino, Thin Solid Films, 1998, 331, 89 CrossRef; (h) Q. Zeng, Z. Li, Y. Q. Dong, C. A. Di, A. J. Qin, Y. N. Hong, L. Ji, Z. C. Zhu, C. K. W. Jim, G. Yu, Q. Q. Li, Z. A. Li, Y. Q. Liu, J. G. Qin and B. Z. Tang, Chem. Commun., 2007, 70 RSC; (i) Y. S. Zhao, H. B. Fu, F. Q. Hu, A. D. Peng and J. N. Yao, Adv. Mater., 2007, 19, 3554 CrossRef CAS.
- S. S. Hirsch and W. J. Bailey, J. Org. Chem., 1978, 43, 4090 Search PubMed.
- Q. Q. Li, S. S. Yu, Z. Li and J. G. Qin, J. Phys. Org. Chem., 2009, 22, 241 CrossRef CAS.
- (a) H. Tong, Y. Dong, Y. Hong, M. Haeussler, J. W. Y. Lam, H. H. Y. Sung, X. Yu, J. Sun, I. D. Williams, H. S. Kwok and B. Z. Tang, J. Phys. Chem. C, 2007, 111, 2287 CrossRef CAS; (b) Y. X. Li, J. Jia and X. T. Tao, CrystEngComm, 2012, 14, 2843 RSC.
- Y. Liu, M. S. Liu and A.K.-Y. Jen, Acta Polym., 1999, 50, 105 CrossRef CAS.
- M. J. Frisch, G. W. Trucks and H. B. Schlegel, et al., Gaussian 03. Revision D.01.Wallingford CT: Gaussian, Inc., 2004 Search PubMed.
- (a) R. D. William and W. W. Maurice, J. Phys. Chem., 1968, 72, 3251 CrossRef CAS; (b) A. C. Glenn and N. D. James, J. Phys. Chem., 1971, 75, 991 CrossRef.
Footnote |
| † Electronic supplementary information (ESI) available: structure informations, extensive figures, thermogravimetric curves, and CCDC reference numbers 894149–894152 for compounds 1, 4, 5 and 6. For ESI and crystallographic data in CIF or other electronic format see DOI: 10.1039/c2ra21622a |
| This journal is © The Royal Society of Chemistry 2012 |
