Development and evaluation of carbon and binder loading in low-cost activated carbon cathodes for air-cathode microbial fuel cells†
Bin
Wei
a,
Justin C.
Tokash
a,
Guang
Chen
ab,
Michael A.
Hickner
b and
Bruce E.
Logan
*a
aDepartment of Civil and Environmental Engineering, Penn State University, University Park, PA 16802, USA. E-mail: blogan@psu.edu; Fax: +1-814-863-7304
bDepartment of Materials Science and Engineering, Penn State University, University Park, PA 16802, USA
First published on 4th October 2012
Abstract
Activated carbon (AC) air cathodes were constructed using variable amounts of carbon (43–171 mg cm−2) and an inexpensive binder (10 wt% polytetrafluoroethylene, PTFE), and with or without a porous cloth wipe-based diffusion layer (DL) that was sealed with PDMS. The cathodes with the highest AC loading of 171 mg cm−2, and no diffusion layer, produced 1255 ± 75 mW m−2 and did not appreciably vary in performance after 1.5 months of operation. Slightly higher power densities were initially obtained using 100 mg cm−2 of AC (1310 ± 70 mW m−2) and a PDMS/wipe diffusion layer, although the performance of this cathode decreased to 1050 ± 70 mW m−2 after 1.5 months, and 1010 ± 190 mW m−2 after 5 months. AC loadings of 43 mg cm−2 and 100 mg cm−2 did not appreciably affect performance (with diffusion layers). MFCs with the Pt catalyst and Nafion binder initially produced 1295 ± 13 mW m−2, but the performance decreased to 930 ± 50 mW m−2 after 1.5 months, and then to 890 ± 20 mW m−2 after 5 months. Cathode performance was optimized for all cathodes by using the least amount of PTFE binder (10%, in tests using up to 40%). These results provide a method to construct cathodes for MFCs that use only inexpensive AC and a PTFE, while producing power densities similar to those of Pt/C cathodes. The methods used here to make these cathodes will enable further tests on carbon materials in order to optimize and extend the lifetime of AC cathodes in MFCs.
1. Introduction
A microbial fuel cell (MFC) can be used to generate electricity from many different organic and inorganic substrates using exoelectrogenic bacteria that oxidize these substrates and release electrons to the anode.1–3 At the cathode, oxygen is typically reduced to form water.4 Air-cathode MFCs offer the best promise for large scale applications since energy is not needed for aerating the water. The voltage produced by an MFC is less than the theoretical voltage due to ohmic losses and anodic and cathodic overpotentials, with the cathode typically limiting power production.5,6Catalysts can be used to reduce the activation energy needed for oxygen reduction at the cathode. Noble metals such as platinum are most commonly used, but these catalysts are very expensive (e.g. $140/g for Pt). Other metal-based catalysts (cobalt-tetramethylphenylporphyrin, pyrolyzed-Fe(II) phthalocyanine, and manganese oxides) have been used in MFC cathodes to achieve performance similar to that of platinum.7–10 Cheng et al.7 determined that platinum loadings of 0.1–0.5 mg cm−2 did not increase MFC performance with the addition of more platinum. The loading of non-noble metal based catalysts, however, are much higher than those needed for Pt, which can significantly increase the costs for making these cathodes with other metal catalysts.
Activated carbon (AC) is a promising alternative to Pt for MFC applications. AC is very inexpensive ($2.6/kg) and cathodes made with AC have achieved nearly the same performance as those made using Pt at current densities relevant for MFC applications.11 For example, at an applied potential of −200 mV (versus Ag/AgCl), Pant et al.12 obtained −0.6 mA cm−2 for a non-platinized AC electrode, compared to −0.75 mA cm−2 for Pt on graphite, and −0.43 mA cm−2 for a non-platinized graphite control. AC cathodes have been made using a polytetrafluoroethylene (PTFE) binder and a 70% porous PTFE diffusion layer on nickel mesh current collector by a proprietary process.13 MFCs using these cathodes produced a maximum power density of 1220 mW m−2 in MFC tests, compared to 1060 mW m−2 using Pt on carbon cloth.11 More recently a rolling method with sintering at 340 °C was used to make AC cathodes, with PTFE used as both the binder and the diffusion layer.14 Power densities were lower than those previously reported11,15 for AC cathodes, ranging from 802 to 584 mW m−2, depending on the AC/PTFE ratio. AC loading was not examined.
A major limitation of both Pt and AC cathodes is that their performance decrease over time. Zhang et al.15 found that maximum power densities of AC cathodes decreased from 1214 ± 123 mW m−2 to 750 mW m−2 after one year of MFC operation. Similar decreases in performance have been shown for AC cathodes with a less porous PTFE diffusion layer (30%), and for Pt-catalyzed cathodes using various types of binders.16 One approach to improve longevity of the AC cathodes could be to increase the AC loading, as AC is inexpensive and this would not appreciably affect overall costs. However, previously examined AC cathodes were made using a proprietary pressing process, and therefore the methods to construct them with various AC loadings are not known.12,13,15 Other AC cathodes using a rolling and sintering process had lower performance, and were not compared against more traditional Pt catalyst cathodes.17
The objectives of this study were to develop a method to make AC cathodes to enable their routine analysis in the laboratory, and to examine the effects of AC loading and binder content on cathode performance over time. An increase in AC loading was expected to increase surface area and active sites for oxygen reduction, which could lead to lower cathodic overpotentials, improved power densities, and extended performance. Although Nafion is often used as a cathode binder, PTFE is less expensive than Nafion, and cathodes made with PTFE have produced similar performance to those made with Nafion and a Pt catalyst.18,19 The performance of the AC cathodes made here were benchmarked against cathodes made using more typical but much more expensive materials of carbon cloth, Pt, Nafion, and PTFE diffusion (four applications) layers.
2. Experimental
2.1 Microbial fuel cell reactors, electrodes, and operation
Microbial fuel cells were a single-chamber design, with an air-cathode placed in a 4 cm long cylindrical chamber with projected cathode area of 7 cm2 (liquid volume of 28 mL). The anodes were graphite fiber brushes that were heat treated at 450 °C in air for 30 min. MFCs were operated at room temperature at a fixed external resistance of 1000 Ω unless otherwise noted. The medium contained 1 g L−1 sodium acetate, 12.5 mL L−1 minerals and 5 mL L−1 vitamin solutions in a 50 mM phosphate buffer solution (Na2HPO4, 4.58 g L−1, NaH2PO4·H2O, 2.45 g L−1, NH4Cl, 0.31 g L−1, KCl, 0.13 g L−1).20 The inoculum was effluent from other MFCs that were operated in a 30 °C room at 1000 Ω.AC cathodes were prepared with AC powder (Norit SX plus, Norit Americas Inc., TX) and a PTFE binder (in 60% emulsion), at a weight ratio of AC to PTFE of 9![[thin space (1/6-em)]](https://www.rsc.org/images/entities/char_2009.gif) :
:![[thin space (1/6-em)]](https://www.rsc.org/images/entities/char_2009.gif) 1 except as noted. After the AC and PTFE solution mixture formed a paste, it was spread onto one side of a stainless steel mesh current collector (50 × 50, type 304, McMaster-Carr, OH) using a spatula, and then pressed at 10,000 pounds-force for 20 min (Carver press, Model 4386, Carver Inc., IN, USA), all at room temperature. AC cathodes were examined for power production with and without diffusion layers. A poly(dimethylsiloxane) (PDMS) solution was prepared as described.21 Diffusion layers were prepared by applying 2 layers of PDMS solution onto a cloth wipe material (DuPont Sontara, Style 8864), as opposed to application directly onto the cathode as previously tested,21 in order to minimize clogging of the cathode catalyst with the PDMS. AC cathodes were dried at 70–90 °C overnight in an oven before use. AC cathodes with diffusion layers were made with the following loadings (projected area of 7 cm2): 7, 11, 14, 28, 43, 100, 171 mg cm−2 with 10% PTFE binder. Higher AC loadings of 43, 71, 100, 143, 171 mg cm−2 were used in tests with cathodes lacking a diffusion layer. Cathodes without diffusion layers were also tested that had different PTFE binder contents of 10, 15, 20, 25, 30, 35 and 40 wt%, with 43 mg cm−2 of AC.
1 except as noted. After the AC and PTFE solution mixture formed a paste, it was spread onto one side of a stainless steel mesh current collector (50 × 50, type 304, McMaster-Carr, OH) using a spatula, and then pressed at 10,000 pounds-force for 20 min (Carver press, Model 4386, Carver Inc., IN, USA), all at room temperature. AC cathodes were examined for power production with and without diffusion layers. A poly(dimethylsiloxane) (PDMS) solution was prepared as described.21 Diffusion layers were prepared by applying 2 layers of PDMS solution onto a cloth wipe material (DuPont Sontara, Style 8864), as opposed to application directly onto the cathode as previously tested,21 in order to minimize clogging of the cathode catalyst with the PDMS. AC cathodes were dried at 70–90 °C overnight in an oven before use. AC cathodes with diffusion layers were made with the following loadings (projected area of 7 cm2): 7, 11, 14, 28, 43, 100, 171 mg cm−2 with 10% PTFE binder. Higher AC loadings of 43, 71, 100, 143, 171 mg cm−2 were used in tests with cathodes lacking a diffusion layer. Cathodes without diffusion layers were also tested that had different PTFE binder contents of 10, 15, 20, 25, 30, 35 and 40 wt%, with 43 mg cm−2 of AC.
The AC cathodes were compared to carbon cloth cathodes (CC, 30% wet proofing, Fuel Cell Earth LLC) containing a platinum catalyst (0.5 mg cm−2) held with carbon black (Vulcan XC-72) and a Nafion binder on the solution side as a control.22 This cathode had PTFE diffusion layers that were applied on the air side, to be consistent with previous studies.23
2.2 Analyses
Electrochemical tests were carried out with a potentiostat (VMP3 Multichannel Workstation, Biologic Science Instruments, USA) in a 30 °C room using an electrochemical reactor (two 2 cm cylindrical chambers bolted together) containing 50 mM phosphate buffer solution (PBS), with a liquid volume of 30 mL. A platinum plate (7 cm2) was used as the counter electrode and the Ag/AgCl reference electrode (0.21 V versus a Standard Hydrogen Electrode, SHE) was placed close to the working electrode (cathode).Cathode current–voltage (polarization) curves were examined by applying cathode potentials in a stepwise manner after operating under open circuit conditions for 3 h. Each potential (0.41 V, 0.31 V, 0.21 V, 0.11 V and 0.01 V, versus SHE) was applied for 2 h, in order to ensure a steady state current.
Polarization curves were obtained using different resistors, with one external resistor used for a complete fed batch cycle (multi-cycle method). Polarization data were obtained after the MFCs had been operated at 1000 Ω for 1.5 and 5 months, by varying the external resistances from 1000 Ω to 50 Ω. Current densities were normalized to the cathode projected area (7 cm2) and calculated using i = E/RextA where E was the voltage measured when MFCs reached a steady-state condition. Data was recorded using a data acquisition system (2700, Keithley instruments, OH). Power densities were calculated with P = iE/A. Coulombic efficiencies were measured at each external resistance as previously described.1 All MFC tests were carried out in duplicate.
Electrochemical impedance spectroscopy (EIS) was conducted at a set potential of either 0.3 V or 0.1 V, over a frequency range of 0.5 MHz to 1 mHz, with a sinusoidal perturbation of 10 mV. EIS results were analyzed by fitting the spectra to an equivalent circuit model (†. S1, ESI†). Since there was a high frequency semicircle in the Nyquist plots for AC cathodes which was not observed in those for Pt/C cathodes (†. S2, ESI†), two equivalent circuits in series were fit to Nyquist plots obtained with AC cathodes and Pt/C cathodes using the potentiostat software (EC-lab). The circuits contained resistors for the solution resistance (Rs), contact resistance (Rc), charge transfer resistance (Rct), in addition to an Warburg impedance (Zw) as the diffusive element when the diffusion layer thickness on the solution-electrode interface became semi-infinite24 and constant phase elements (Q1 and Q2) which describe non-ideal capacitive properties since the a factor was not equal to 1 (for ideal capacitance a factor is 1). The definition of Warburg impedance is:25
| Zw = σw(ω)−1/2(1 − j) | (1) |
The Warburg coefficient σw is:26
 | (2) |
In the above equations, ω is the radial frequency, DO and DR the diffusion coefficients of the oxidant and reductant, A the surface area of the electrode, n the numbers of electrons evolved in the redox reaction, σw the Warburg coefficient, CO and CR the bulk concentrations of oxidant and reductant, F Faraday's constant, R the gas constant, and T the absolute temperature. The total cathode polarization resistance was obtained from the first derivative of the voltage-current (polarization) curves using a second order polynomial function regression.27 The diffusion resistance was calculated as the difference between this total resistance and the solution, contact and charge transfer resistances.
Galvanostatic charge-discharge tests were carried out with clean cathodes at a current density of 0.35 mA cm−2 by discharging the cathode for 2 h, followed by charging for 2 h, and then discharging for 3 h. Cathode specific capacitance with activated carbon cathode was normalized to the weight of catalyst and calculated from Cm = IΔt/ΔVm, with the slope (ΔV/Δt) of the linear region below OCV (open circuit voltage, ca. 0.46 V for AC cathodes).
3. Results and discussion
3.1 Electrochemical tests with new cathodes
When the AC cathodes were constructed with diffusion layers, a carbon loading of 100 mg cm−2 produced current densities most similar to that of the Pt/C cathode over a potential range of 0.01 V to 0.41 V (Fig. 1). The open circuit potentials (ca. 0.46 V) of the AC cathodes were lower than those of the Pt/C cathodes (0.54 V). AC loadings of ≤43 mg cm−2 produced slightly lower current densities than those with ≥100 mg cm−2. When AC cathodes were made without diffusion layers, current densities were generally slightly higher although there was a small amount of water loss through the cathode (water leakage) when changing the medium for the MFCs, and slight water leakage was observed when the reactors were sealed with stoppers. The best results at cathode potentials of 0.01 V to 0.31 V were obtained using AC loadings of 43 to 171 mg cm−2.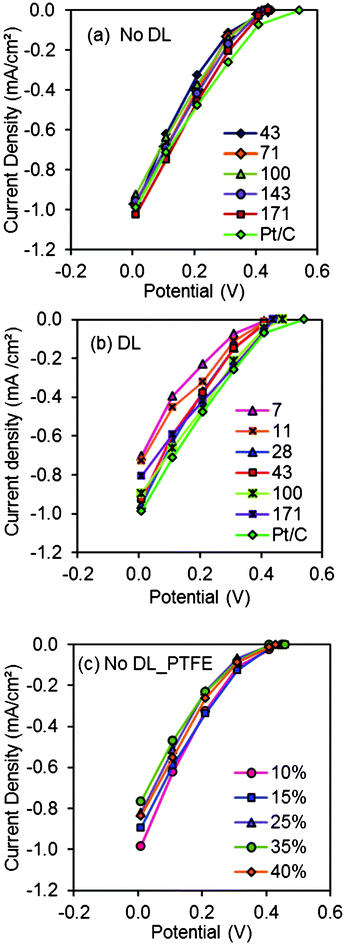 | ||
| Fig. 1 Current–voltage (polarization) curves using (a) AC cathodes without diffusion layers (43, 71, 100, 142, 171 mg cm−2 AC, 10% PTFE) compared to Pt/C cathodes; (b) activated carbon cathodes with diffusion layers (7, 11, 14, 28, 43, 100, 171 mg cm−2 AC, 10% PTFE), compared to Pt/C cathodes; (c) activated carbon cathodes with different PTFE contents (10, 15, 25, 35, 40 wt %, with 43 mg cm−2 AC). | ||
AC cathodes made with different amounts of binder (10–40% PTFE) did not show any consistent trend between binder content and current at cathode potentials ranging from 0 V to the OCV (ca. 0.46 V) (Fig. 1). This result suggested PTFE binder content was not an important factor in AC cathode construction, and that the use of binder could be minimized to reduce overall cathode costs.
3.2 MFC performance with new cathodes
Maximum power densities produced by MFCs with new cathodes generally followed the same trends between mass of carbon and performance as those observed in abiotic electrochemical tests. The maximum power density in MFC tests with the AC cathodes made with a diffusion layer was 1310 ± 70 mW m−2 for cathodes with 100 mg cm−2 of AC. This result was not significantly different from that obtained with Pt/C cathodes (1300 ± 15 mW m−2) (Fig. 2). In general, maximum power densities increased with carbon loading (780 ± 30 mW m−2, 7 mg cm−2; 910 ± 85 mW m−2, 11 mg cm−2; 970 ± 120 mW m−2, 14 mg cm−2; 1200 ± 75 mW m−2, 28 mg cm−2; 1140 ± 40 mW m−2, 43 mg cm−2). However, the highest AC loading of 171 mg cm−2 produced a slightly lower maximum power density (1000 ± 155 mW m−2) than cathodes with ≥28 mg cm−2 of AC. There were some differences in anode potentials (Fig. 3), but in general the performance of the MFCs was linked to the type of cathode and the AC loading.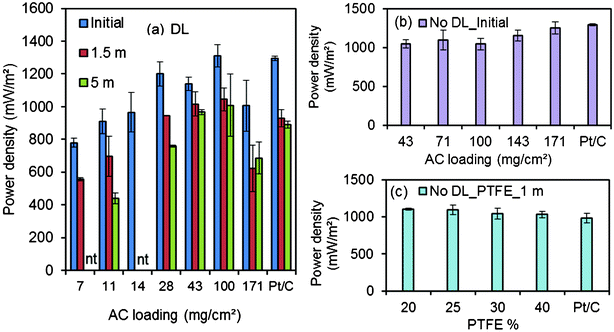 | ||
| Fig. 2 Maximum power densities obtained using (a) AC cathodes (7, 11, 14, 28, 42, 100, 171 mg cm−2 AC, 10% PTFE) with diffusion layer, and Pt/C cathodes in the initial cycles, and after 1.5 and 5 months operation (nt: not tested); (b) AC cathodes (43, 71, 100, 143, 171 mg cm−2 AC, 10% PTFE) with diffusion layer, and Pt/C cathodes in the initial cycles; (c) AC cathodes (20, 25, 30, 40% PTFE, 43 mg cm−2 AC) without diffusion layer, and Pt/C cathodes after 1 month. | ||
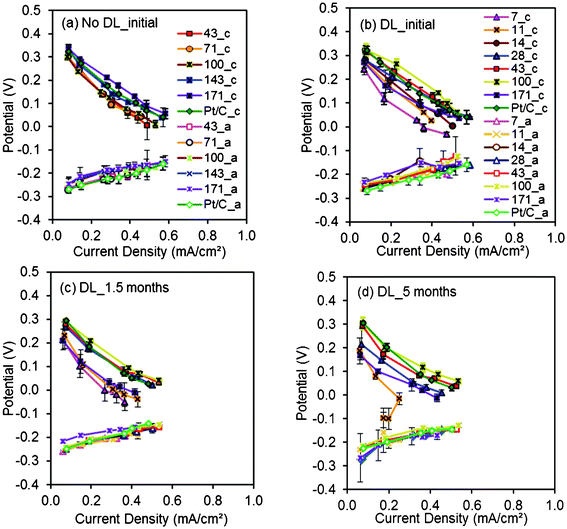 | ||
| Fig. 3 Cathode and anode polarization curves obtained using (a) AC cathodes (43, 71, 100, 143, 171 mg cm−2 AC, 10% PTFE) without DL, Pt/C cathodes in the initial cycles; (b) AC cathodes (7, 11, 14, 28, 43, 100, 171 mg cm−2 AC, 10% PTFE) with DL, Pt/C cathodes in the initial cycles; (c) AC cathodes (7, 11, 28, 43, 100, 171 mg cm−2 AC, 10% PTFE) with DL, Pt/C cathodes after 1.5 months; (d) AC cathodes (11, 28, 43, 100, 171 mg cm−2 AC, 10% PTFE) after 5 months. | ||
When AC cathodes were made without diffusion layers, the cathodes with the highest AC carbon loading of 171 mg cm−2 produced the highest power density of 1255 ± 75 mW m−2, which was similar to that obtained with the Pt/C cathode (1300 ± 15 mW m−2) (Fig. 2). The other AC cathodes produced slightly lower power densities. Anodic polarization curves were similar, indicating different power densities were due to cathode performance.
AC cathodes with different PTFE binder contents (20–40%) had similar maximum power densities to each other (ca. 1100 mW m−2) and to the Pt/C cathodes (985 ± 70 mW m−2) after 1 month (Fig. 2). The anodes performed quite comparably and there was no significant difference in cathode performance with the variable amount of PTFE binder (Fig. 4), consistent with abiotic electrochemical test results (Fig. 1).
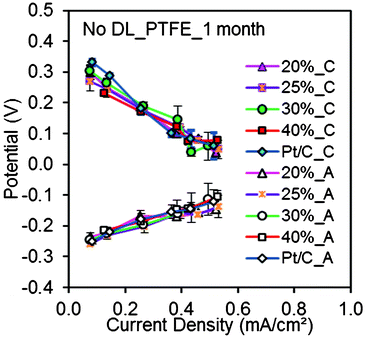 | ||
| Fig. 4 Cathode and anode polarization curves obtained using AC cathodes (20, 25, 30, 35, 40% PTFE, 43 mg cm−2 AC) without DL, Pt/C cathodes after 1 month. | ||
3.3 MFC performance after 1.5 and 5 months
After 1.5 and 5 months of operation, the maximum power densities of the AC cathodes decreased by an average of 24% and 31% compared to those originally produced with new cathodes (Fig. 2). The Pt/C cathode maximum power also decreased by 28% to 930 ± 50 mW m−2 (1.5 months) and 31% to 890 ± 20 mW m−2 (5 months). Overall, the cathode performance deteriorated over time in MFCs with either AC or Pt/C cathodes. AC cathodes with 28, 43, 100 mg cm−2 of carbon generated more current at certain cathode potentials than the others after 1.5 months. These three types of cathodes behaved similarly to each other and to the Pt/C cathodes. Slightly better performance was obtained with 100 mg cm−2 compared to 43 mg cm−2 of carbon or the Pt/C cathodes in the MFCs four months later. AC cathodes with only 11 mg cm−2 failed to perform at the higher current densities. In general, AC loadings of 43 and 100 mg cm−2 had the best performance over time.An increase in the AC catalyst loading from 7 to 100 mg cm−2 generally led to improved current generation at cathode potentials relevant for MFC operation. In one case, however, the cathode containing the highest amount of AC (171 mg cm−2), when it had a diffusion layer, had a lower current than cathodes with 100 mg cm−2 in abiotic electrochemical tests (Fig. 1). New cathodes with 100 mg cm−2 AC initially produced the highest maximum power density of 1310 ± 70 mW m−2, similar to that obtained with the Pt/C cathode (1300 ± 15 mW m−2) (Fig. 2). In general, the maximum power density increased with AC loading. However, an increase in the loading from 100 to 171 mg cm−2 did not improve performance, perhaps as a result of larger distance over which proton and oxygen gradients can form across the cathode as the catalyst layer became thicker.
3.4 Coulombic efficiencies
Coulombic efficiencies of MFCs with the AC cathodes varied over a wide range of 20–70%, due to the different current densities (0.1–0.6 mA cm−2) produced using different resistances (Fig. 5). The presence or absence of a diffusion layer had less of an effect on the CEs, demonstrating that the AC layer and not the diffusion layer was the main factor affecting the CE. The CEs of the AC cathodes with 28–171 mg cm−2 were all higher than Pt/C cathodes at current densities > 0.2 mA cm−2. After 1.5 and 5 months of operation, the CEs of the AC and Pt/C cathodes increased slightly over time, likely due to the formation of biofilm on the cathode which would have reduced oxygen diffusion into the anode chamber.18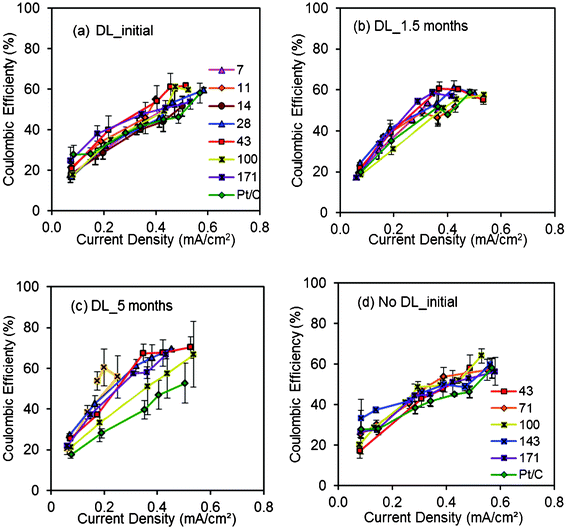 | ||
| Fig. 5 Coulombic efficiencies (CEs) obtained using (a) AC cathodes (7, 11, 14, 28, 43, 100, 171 mg cm−2 AC, 10% PTFE) with DL, Pt/C cathodes in the initial cycles; (b) AC cathodes (7, 11, 28, 43, 100, 171 mg cm−2 AC, 10% PTFE) with DL, Pt/C cathodes after 1.5 months; (c) AC cathodes (11, 28, 43, 100, 171 mg cm−2 AC, 10% PTFE) with DL, Pt/C cathodes after 5 months; (d) AC cathodes (43, 71, 100, 143, 171 mg cm−2 AC, 10% PTFE) without DL, Pt/C cathodes in the initial cycles. | ||
3.5 Electrochemical impedance spectroscopy (EIS)
Based on EIS data, the total internal resistances were higher at a set potential of 0.3 V than at 0.1 V (Fig. 6). The resistances obtained by fitting the first semicircle of the EIS spectra were the same at 0.1 and 0.3 V (Table S1, ESI†). The similar values at these two potentials indicated that this resistance did not involve kinetic processes, consistent with the assumption that this component of the resistance described the conductivity between AC particles and the current collector (Rc). As the AC loading was increased from 11 to 171 mg cm−2, the magnitude of Rc decreased, suggesting improved contact between the AC particles and the current collector with higher carbon loadings. There was also little variation in the solution resistance, which is expected as the same solution was used in all tests.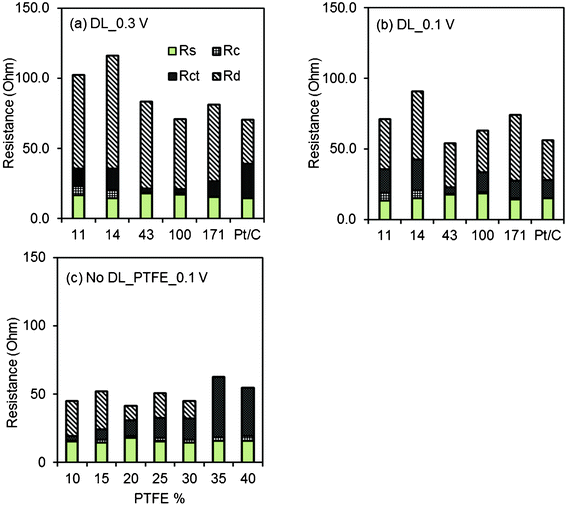 | ||
| Fig. 6 Resistance components obtained at cathode potential of (a) 0.3 V; (b) 0.1 V using AC cathodes (11, 14, 43, 100, 171 mg cm−2 AC, 10% PTFE) with DL, and Pt/C cathodes; (c) 0.1 V using AC cathodes (10, 15, 20, 25, 30, 35, 40% PTFE, 43 mg cm−2 AC) without DL. | ||
The largest part of the resistance was the diffusion resistance (Fig. 6). This component contributed between 45 and 75% of the total internal resistance at 0.3 V, and 47 to 63% at 0.1 V. At 0.3 V, the charge transfer resistances were similar for cathodes with 11–28 mg cm−2 AC (12.7, 14.9 and 13.1 Ω), and 77% lower for higher AC amounts (43 mg cm−2, 3.0 Ω and 100 mg cm−2, 3.0 Ω). However, the Rct increased to 10.5 Ω with the highest AC loading (171 mg cm−2). These results showed carbon loadings of 43 and 100 mg cm−2 had the higher reaction rates.
The Warburg impedance decreased inversely with AC loading from 11 to 100 mg cm−2 (Zw of 2.6–0.2 Ω s−1/2), indicating faster mass transport processes (larger diffusivities of redox species) to the catalyst. At 0.1 V, Rct slightly increased and Zw decreased with AC cathodes compared to measurements at 0.3 V. When the cathode potential was 0.1 V, cathodes with lower AC loadings (11–28 mg cm−2 AC) had higher charge transfer and diffusion resistances than cathodes with more AC (43–171 mg cm−2), consistent with the results obtained at 0.3 V. Moreover, when the cathode potential was reduced from 0.3 V to 0.1 V, charge transfer decreased as a result of higher driving force for the cathode reactions, but diffusion resistance increased. Compared to AC cathodes, Pt/C cathodes had lower Rct and Zw values at 0.1 V compared to 0.3 V. The change in Rct at the two different cathode potentials was consistent with a previous study28 that employed a 1 M H2SO4 electrolyte and carbon electrodes prepared with porous carbon powders and PVDF binder. The increase in charge transfer resistance could lead to the reduction in the Warburg impedance (Zw) with a slower reaction rate, as this situation requires less reactant for the oxygen reduction reaction.
Analysis of the cathodes with different percentages of PTFE binder (at 0.1 V) using EIS showed that the overall resistances were generally similar (Fig. 6). The cathodes with the two highest binder contents (35 and 40%) had slightly higher total resistances, and much larger charge transfer resistances than the cathodes with less PTFE. These data suggest that a higher binder content reduced contact between the current collector and the AC particles. However, the analysis was inconclusive because the diffusion resistance decreased appreciably for these two samples (Table S2, ESI†), and therefore the contributions of the diffusion and charge transfer resistances were not well separated in this circuit analysis.
Polymeric binders are used to hold a catalyst to the conductive material, while at the same time the ionic nature a binder, such as Nafion, is designed to enable ion transport from the bulk solution to catalytic reaction sites. Hydrophobic binders have been demonstrated in MFCs with good results,7 however, too much hydrophobic binder can reduce the porosity of the cathode and inhibit ion transport to the electrochemically active surface area.29 In cathodes with different PTFE binder contents tested here, Rct increased with binder content, likely as a result of an excess of PTFE reducing the available surface area for oxygen reduction. The specific capacitance of the AC, however, showed only slight changes with AC loading with a constant amount of binder. This result suggests that the capacitance of the AC was not an important factor for cathode design. Instead, it is more critical to minimize the amount of binder in order to reduce charge transfer resistance.
3.6 Capacitance
The specific capacitance (capacitance normalized to AC mass) of 75 ± 3 F/g was obtained for cathodes with 71–171 mg cm−2 AC, although slightly higher values were obtained with 43 mg cm−2 AC (102 F/g) (Fig. 7). As expected, the Pt/C cathode had the lowest capacitance (25 F/g) due to a lack of a high surface area material like AC. Since the same materials were used in all tests, any change in capacitance likely reflects changes in how the AC interacted with the binder, relative to its ability to store charge. When the effect of variable PTFE binder content on capacitance was examined, it was found that increasing the binder content (from 10% to 40%) resulted in slight decrease in specific capacitance (from 102 to 81 F/g). These results show that more PTFE reduced the overall capacitance of the AC, but this did not result in different power densities in MFC tests.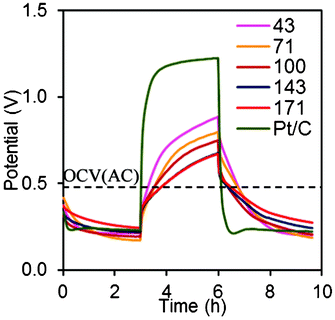 | ||
| Fig. 7 Charge-discharge diagram using AC cathodes (43, 71, 100, 143, 171 mg cm−2 AC, 10% PTFE) and Pt/C cathodes. | ||
4. Conclusions
AC cathodes were constructed by mixing AC powder with PTFE binder into the form of a paste, then pressing the materials together at high pressures. The power densities produced by the AC cathodes generally increased with AC loading over the range of 7–100 mg cm−2 due to a reduction in contact resistance, charge transfer resistance, and Warburg impedance. While the performance of AC cathodes degraded over 1.5 to 5 months, power densities over this period of time were still comparable to those obtained using more expensive Pt/C-based cathodes. These results provide a method for making AC cathodes, and therefore for improving their performance through manipulation of the type and chemistry of the AC materials.Acknowledgements
The authors thank Dr Yiying Hong for helping with the activated carbon cathode preparation. This research was supported by Award KUS-I1-003-13 from the King Abdullah University of Science and Technology (KAUST).References
- B. E. Logan, B. Hamelers, R. A. Rozendal, U. Schrorder, J. Keller, S. Freguia, P. Aelterman, W. Verstraete and K. Rabaey, Environ. Sci. Technol., 2006, 40, 5181–5192 CrossRef CAS.
- B. E. Logan, Nat. Rev. Microbiol., 2009, 7, 375–381 CrossRef CAS.
- K. Rabaey and W. Verstraete, Trends Biotechnol., 2005, 23, 291–298 CrossRef CAS.
- S. Oh, B. Min and B. E. Logan, Environ. Sci. Technol., 2004, 38, 4900–4904 CrossRef CAS.
- H. Rismani-Yazdi, S. M. Carver, A. D. Christy and I. H. Tuovinen, J. Power Sources, 2008, 180, 683–694 CrossRef CAS.
- B. E. Logan, B. Hamelers, R. Rozendal, U. Schröder, J. R. Keller, S. Freguia, P. Aelterman, W. Verstraete and K. Rabaey, Environ. Sci. Technol., 2006, 40, 5181–5192 CrossRef CAS.
- S. Cheng, H. Liu and B. E. Logan, Environ. Sci. Technol., 2006, 40, 364–369 CrossRef CAS.
- F. Zhao, F. Harnisch, U. Schroder, F. Scholz, P. Bogdanoff and I. Herrmann, Electrochem. Commun., 2005, 7, 1405–1410 CrossRef CAS.
- L. X. Zhang, C. S. Liu, L. Zhuang, W. S. Li, S. G. Zhou and J. T. Zhang, Biosens. Bioelectron., 2009, 24, 2825–2829 CrossRef CAS.
- X. W. Liu, X. F. Sun, Y. X. Huang, G. P. Sheng, K. Zhou, R. J. Zeng, F. Dong, S. G. Wang, A. W. Xu, Z. H. Tong and H. Q. Yu, Water Res., 2010, 44, 5298–5305 CrossRef CAS.
- F. Zhang, S. A. Cheng, D. Pant, G. Van Bogaert and B. E. Logan, Electrochem. Commun., 2009, 11, 2177–2179 CrossRef CAS.
- D. Pant, G. Van Bogaert, M. De Smet, L. Diels and K. Vanbroekhoven, Electrochim. Acta, 2010, 55, 7710–7716 CrossRef CAS.
- F. Zhang, S. Cheng, D. Pant, G. V. Bogaert and B. E. Logan, Electrochem. Commun., 2009, 11, 2177–2179 CrossRef CAS.
- H. Dong, H. Yu, X. Wang, Q. Zhou and J. Feng, Water Research, 2012 Search PubMed.
- F. Zhang, D. Pant and B. E. Logan, Biosens. Bioelectron., 2011, 30, 49–55 CAS.
- T. Saito, T. H. Roberts, T. E. Long, B. E. Logan and M. A. Hickner, Energy Environ. Sci., 2011, 4, 928–934 CAS.
- H. Dong, H. Yu, X. Wang, Q. Zhou and J. Feng, Water Research, 2012 Search PubMed.
- S. Cheng, H. Liu and B. E. Logan, Environ. Sci. Technol., 2006, 40, 364–369 CrossRef CAS.
- X. Wang, Y. J. Feng, J. Liu, X. X. Shi, H. Lee, N. Li and N. Q. Ren, Biosens. Bioelectron., 2010, 26, 946–948 CrossRef CAS.
- S. A. Cheng, D. F. Xing, D. F. Call and B. E. Logan, Environ. Sci. Technol., 2009, 43, 3953–3958 CrossRef CAS.
- F. Zhang, T. Saito, S. Cheng, M. A. Hickner and B. E. Logan, Environ. Sci. Technol., 2010, 44, 1490–1495 CrossRef CAS.
- S. Cheng, H. Liu and B. E. Logan, Environ. Sci. Technol., 2005, 40, 364–369 CrossRef.
- S. Cheng, H. Liu and B. E. Logan, Electrochem. Commun., 2006, 8, 489–494 CrossRef CAS.
- S. Pruneanu, F. Pogacean, A. R. Biris, S. Ardelean, V. Canpean, G. Blanita, E. Dervishi and A. S. Biris, J. Phys. Chem. C, 2011, 115, 23387–23394 CAS.
- R. Vedalakshmi, V. Saraswathy, H. W. Song and N. Palaniswamy, Corros. Sci., 2009, 51, 1299–1307 CrossRef CAS.
- A. J. Bard, Faulkner, Larry R., 2nd edn, John Wiley & Sons, Inc., 2000 Search PubMed.
- N. Wagner, J. Appl. Electrochem., 2002, 32, 859–863 CrossRef CAS.
- W. C. Chen, T. C. Wen and H. S. Teng, Electrochim. Acta, 2003, 48, 641–649 CrossRef CAS.
- T. Saito, M. D. Merrill, V. J. Watson, B. E. Logan and M. A. Hickner, Electrochim. Acta, 2010, 55, 3398–3403 CrossRef CAS.
Footnote |
| † Electronic Supplementary Information (ESI) available. See DOI: 10.1039/c2ra21572a |
| This journal is © The Royal Society of Chemistry 2012 |
