Reducing sugars facilitated carbonyl condensation in detoxification of carbonyl aldehyde model compounds for bioethanol fermentation†
Rui
Xie
a,
Maobing
Tu
*a,
Yonnie
Wu
b and
Steven
Taylor
c
aForest Products Lab and Center for Bioenergy and Bioproducts, Auburn University, 520 Devall Drive, Auburn, AL 36849, U.S.. E-mail: mtu@auburn.edu; Fax: +1 334 844 1084; Tel: +1 334 844 8829
bDepartment of Chemistry and Biochemistry, Auburn University, 172 Chemistry building, Auburn, AL 36849, U.S.
cDepartment of Biosystems Engineering, Auburn University, Auburn, AL 36849, U.S.
First published on 13th June 2012
Abstract
We investigated the inhibitory effects of ortho-phthalaldehyde (OPA) as a carbonyl aldehyde model compound on the fermentation and growth of Saccharomyces cerevisiae and its alkaline detoxification. OPA was a potent inhibitor on the fermentation and growth of S. cerevisiae compared to vanillin, furfural and hydroxymethyl furfural (HMF) at the same concentration level. The inhibition of OPA on the fermentation and growth of S. cerevisiae was dose dependent. Ethanol production and growth of S. cerevisiae were both completely inhibited in the presence of 1.0 mM OPA. The inhibition of the fermentation and growth of the yeast decreased with the decrease in the OPA concentration between 0.02 mM–1.0 mM. OPA at 0.02 mM showed no inhibition on both the fermentation and growth of yeast, the ethanol final yield was even increased by 4.6% compared to the control. The inhibition of OPA at a low concentration could be overcome by increasing the inoculation size of the yeast. Most interestingly, we found OPA inhibition could be detoxified under alkaline conditions (pH∼10) at 60 °C for 2 h in the presence of a reducing sugar (ketone or aldose), but not a non-reducing sugar. Mass spectral analysis of the OPA reaction products in negative ion mode revealed a high intensity mass at 313.09 m/z ([M − H]−). This molecule (314) was predicted to be the aldol reaction product of the reducing sugar and OPA under alkaline conditions. One of the CHO groups on OPA was converted into a hydroxyl group by nucleophilic addition of the enolate ion of the reducing sugar. Loss of one CHO group of OPA could be the key factor for the removal of OPA inhibition.
Introduction
Remarkably little is known about the mechanism of overliming or alkaline detoxification for biomass acid hydrolysate, despite it being widely used in detoxifying the acid hydrolysate for biofuel and chemical production.1–6 Research has been concentrated largely on the chemical identification of potential inhibitors using high performance liquid chromatography (HPLC), gas and liquid chromatography mass spectrometry (GC-MS and LC/MS) and nuclear magnetic resonance (NMR).1,7–12 However, due to the large amount of degradation compounds from biomass and their extreme low concentrations in the hydrolysate, identification of unknown microbial inhibitory compounds has been facing a mounting challenge in the past half century.1,7,13,14 Consequently, the elucidation of overliming detoxification has not been achieved successfully although several model compounds that have been evaluated.During the biomass pretreatment process, considerable amounts of inhibitors will be generated from the degradation of cellulose, hemicellulose, lignin and extractives.13,15–18 Fermentation inhibitors can typically be divided into three groups based on their original sources.19 Firstly, 5-hydroxymethyl furfural (HMF), formic acid and levulinic acid are produced from the degradation of cellulose and glucose.15 Secondly, acetic acid and furfural are formed from hemicellulose degradation. Thirdly, aromatic carbonyl compounds are generated from lignin and extractive degradation.13,19 As a result, more than 100 toxic compounds from the pretreatment of prehydrolysate are introduced for subsequent microbial fermentation.8,19 Many of these inhibitors will significantly reduce the microbial growth and ethanol productivity during the subsequent fermentation step.20,21 This inhibitory effect has become one of the major barriers to developing an economically viable process for cellulosic biofuel production.8,15,22 Previously, identification of the fermentation inhibitors has been explored on acid prehydrolysate from biomass pretreatment with advanced analytical tools.1,8,11 However, there is still a lack of knowledge of which inhibitors have the most pronounced effects on yeast fermentation.7,15,20 More importantly, the mechanisms of overliming or alkaline detoxification have not been fully understood. Identification of these fermentation inhibitors and their detoxification mechanism is widely recognized as one of the roadblocks for developing any effective detoxification approach and improving stress-tolerance yeast and bacterial ethanologens. One objective of this research is to elucidate the alkaline detoxification mechanism by using carbonyl model compounds.
Most previous studies have reported several potential inhibitors such as furfural, HMF, acetic acid, syringaldehyde and other phenolic compounds.7,18,23 However, these identified inhibitors did not show the same level of inhibition on yeast or bacterial fermentation as compared to biomass hydrolysate, they even increased the ethanol or butanol yields in several cases on Saccharomyces and Clostridium fermentation.24–26 Combination of fundamental chemical reactions mining and experimental determination with unique carbonyl model compounds could be an effective approach to narrow down the specific target compounds and their detoxification reactions, rather than to screen the toxic compounds randomly.
Alkaline catalyzed aldol condensation has been suggested as one of major reactions in detoxifying hydrolysate.27,28 A review of literature on alkaline catalyzed reactions leads us to the carbonyl condensation reactions.29 Aromatic compounds have been proposed as major fermentation inhibitors in prehydrolysate.9,30 Most of these unknown aromatic compounds were degradation compounds from lignin (guaiacyl and syringyl lignin) or extractives (terpenoids). So, the compounds having aromatic and carbonyl groups should be the right targets. As a result, we think ortho-phthaldehyde (OPA) and vanillin should be appropriate carbonyl model compounds to study the alkaline detoxification mechanism. In pulp and paper science, lignin model compounds (guaiacylglycerol-β-guaiacyl ether and 2-methoxy-4-methylphenol) have been successfully used to elucidate the reaction mechanism of delignification without knowing the exact lignin structure.31–34
We have chosen OPA and vanillin as model compounds for two main reasons; the functional carbonyl groups (aldehydes and benzene ring) of OPA and vanillin have been found in the biomass hydrolysate, OPA and vanillin can be detoxified by alkaline treatment. OPA and vanillin have been well characterized and one of them has been used for disinfecting purposes. Here we report a new approach employing model carbonyl compounds to investigate the alkaline detoxification mechanism. The described work serves as an element in an overall scheme of unraveling the fermentation inhibitors and their detoxification mechanism. We first evaluated the effects of OPA, vanillin, furfural and HMF on the growth and fermentation of S. cerevisiae. Secondly, we assessed the influence of OPA concentration and inoculation size on yeast fermentation. Thirdly, we distinguished the distinct roles of reducing sugars and non-reducing sugars in detoxification of OPA. With the assistance of LC/MS, we finally identified the reaction products during the detoxification and proposed the new mechanism for alkaline detoxification.
Materials and methods
Chemical reagents and stock preparation
OPA, vanillin, furfural and HMF were obtained from Pickering Laboratories, Acros and Sigma-Aldrich. Glucose, fructose and sucrose were obtained from VWR. All chemical reagents are of chromatographic grade. Stock solutions (1.0 M) of OPA, vanillin, furfural and HMF were prepared in ethanol (HPLC grade, Sigma-Aldrich) separately. All stocks were protected from light and kept at 4 °C. The stocks were used within one month.Microbial strain and medium
Baker's yeast (Fleischmann's), S. cerevisiae, was used in this study. The yeast was activated in a YDP liquid medium containing 20 g L−1 glucose (J.T. Baker), 20 g L−1 peptone (BD) and 10 g L−1 yeast extract (Amresco) at 30 °C with 150 rpm for 12–15 h and maintained at 4 °C on a YDP agar plate containing 20 g L−1 glucose, 20 g L−1 peptone, 10 g L−1 yeast extract and 15 g L−1 agar (BD). Isolated colonies was transferred and cultured in YDP liquid medium overnight and washed with sterile water for fermentation and growth inoculation. The yeast concentrations were determined by an UV-vis spectrophotometer at 600 nm based on a previous standard. Inoculum of 2.0 g L−1 was used for fermentation experiments.Fermentation and growth curve
All fermentation broths were prepared in 125 mL serum bottles with 50 mL of 2% (w/w) sugar source (glucose, fructose or sucrose) using nanopure water (Barnstead). OPA, vanillin, furfural and HMF were added after the sugar solutions were prepared. Sugar solutions with no inhibitors were used as controls. All fermentation broths were sterilized using a 0.2 μm sterile filter before inoculation. Fermentation was conducted at 30 °C with 150 rpm for 48 h or 72 h. Samples were taken periodically for analysis. For testing the inhibitory potential of OPA, a series of concentrations of OPA were added in the fermentation broths.The growth curve was examined by measuring OD at 600 nm of 120 mL cultures grown at 30 °C with 150 rpm in 250 mL flasks. M9 minimal medium containing 0.6% Na2HPO4, 0.3% KH2PO4, 0.05% NaCl, 0.1% NH4Cl, 0.02% MgSO4, 0.001% CaCl2 and 2% glucose was used as the growth media. OPA and vanillin were added before inoculation. A M9 medium (pH 6.0) was used as control. YDP solid medium was used for measurement of colony forming units (CFU). Colony forming units (CFU) were determined by eqn (1):
| CFUs (number/mL) = number of colonies × dilution/volume of culture on plate (mL) | (1) |
Alkaline detoxification of OPA
Fermentation broths containing OPA and sugar sources were used to conduct alkaline detoxification. The alkaline detoxification was held at 60 °C in a temperature-controlled water bath for 2 h. pH was controlled at 10 by adding NaOH with vigorous vortex mixing. Reducing sugars, including glucose and fructose and non-reducing sugar sucrose (2%), were used as sugar sources respectively to test their effects on alkaline treatment of OPA. The same amount of NaOH was added into each sugar source fermentation broth to avoid the effect of salt on yeast.35,36 pH value of each broth was adjusted above 10. After 2 h of alkaline treatments, the solution was cooled to ambient temperature in an ice water bath and then adjusted pH to 6.0 with H2SO4. The treated broths were used immediately for analysis and fermentation without further storage. All the alkaline-treated broths were sterilized through 0.2 μm filters before fermentation.HPLC and LC/MS analysis
The fermentation products including sugars and ethanol were analyzed by HPLC. The HPLC system (Shimadzu) was equipped with a strong cation-exchange column (Aminex HPX-87H, 300 × 7.8 mm) and a refractive index detector (RID-10A). The conditions are 45 °C, 0.6 mL min−1, and 5.0 mM H2SO4 as mobile phase. A 35 min isocratic run was used for all fermentation samples. OPA was analyzed with a C30 column (Waters Carotenoid 5μm, 4.6 × 250 mm) and Photo Diode Array (PDA) detector (SPD-M20A). The conditions are 30 °C, 0.6 mL min−1 and 45 min elution time. Solvent was 100% CH3CN. The alkaline detoxification products were analyzed by an Ultra Performance LC system (ACQUITY, Waters Corp.) coupled with a quadrupole time-of-flight (Q-TOF) mass spectrometer with electrospray ionization (ESI) in negative ESI-MS operated by the Masslynx software (V4.1).Results and discussions
Effects of OPA, vanillin, furfural and HMF on fermentation and growth of S. cerevisiae
The effect of OPA on the fermentation of S. cerevisiae was firstly investigated and compared to vanillin, furfural and HMF in batch fermentation. We examined ethanol production of S. cerevisiae in the presence of 5.0 mM of OPA, vanillin, furfural or HMF respectively. Without adding any inhibitors, pure glucose (2%) fermentation to ethanol was used as a control. The results showed that OPA inhibited ethanol production completely during the 48 h fermentation period at the concentration tested, while vanillin, furfural and HMF showed no inhibition on ethanol production compared to the control (Fig. 1). This indicated that OPA had a much higher toxicity to ethanol production than vanillin, furfural or HMF. During the biochemical conversion of lignocellulosic materials to ethanol, vanillin was identified as a lignin degradation compound which decreased ethanol productivity of microorganisms such as S. cerevisiae.37,38 Furfural and HMF were degradation compounds of lignocellulosic sugars that are also known for their inhibition on ethanol production and microorganism growth.38,39 Vanillin has also been recommended in the food industry as an antimicrobial agent.40,41 A wide range of research has been conducted to test their inhibition on ethanol production and growth of S. cerevisiae. Lee et al. reported that vanillin, furfural and HMF had complete inhibition on ethanol fermentation of baker's yeast in the range of 23–110 mM at the 0.57 g L−1 inoculation size.37 Delgenes et al. reported that ethanol production was 49% and 66% of the control at a culture time of 32 h when 39.6 mM of HMF and 13.1 mM of vanillin were added respectively.38 In real hydrolysates, however, the concentrations of these degradation products, especially vanillin, produced in lignocellulosic hydrolysate were much lower than the amounts used in the tested fermentations.42,43 This indicated that the inhibition of the lignocellulosic hydrolysate on fermentation microorganisms could not be fully represented by those model inhibitors. The fact that OPA, as a dialdehyde, could completely inhibit the ethanol production of S. cerevisiae at low concentrations (5 mM or 0.67 g L−1) gives us a new perspective of the real type of inhibitors that exist in the lignocellulosic hydrolysate.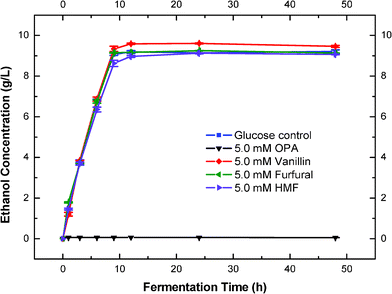 | ||
| Fig. 1 Effects of OPA, vanillin, furfural and HMF on fermentation of S. cerevisiae (5.0 mM of OPA, vanillin, furfural or HMF with 2% glucose at 30 °C with 150 rpm). | ||
The effects of OPA and vanillin on cell growth of S. cerevisiae were also investigated. Compared to the growth of the control, an addition of 5.0 mM OPA executed complete inhibition of cell growth, while vanillin reduced the cell concentration by 10% of the control and did not affect the lag phase (Fig. 2). This indicated that the toxicity of OPA on yeast growth was also much higher than vanillin. Fitzgerald et al. reported that an addition of 5.0 mM of vanillin increased the lag time by 53% and reduced the final cell density by 46% of the control.41 The difference in our results might be attributed to the different yeast strain we used.
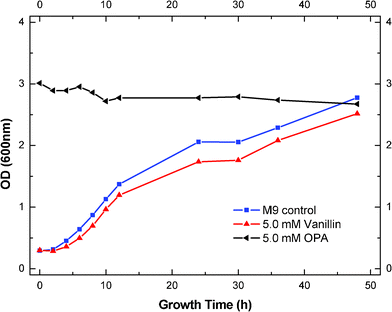 | ||
| Fig. 2 Effects of OPA and vanillin on growth of S. cerevisiae (5.0 mM of OPA and vanillin with 2% glucose, inoculation size 0.14 g L−1). | ||
Interestingly, we also found that the addition of 5.0 mM of vanillin increased the final ethanol yield by 3.8% of the control (Fig. 1). However, the same level of vanillin inhibited the cell growth by 10% of the control (Fig. 2). In our fermentation process, we had detected that the production of glycerol was reduced by 25% in the presence of 5.0 mM vanillin (data not shown). These results indicated that the increase in ethanol production in the presence of 5.0 mM vanillin might result from the compromise of the yeast biomass yield. More sugars have been converted to ethanol, rather than yeast biomass. Similar results have been reported previously when the tested inhibitors increased the ethanol or butanol yields.24–26 The addition of acetic acid (3.3 g L−1) was reported to increase the ethanol yield by 20% with S. cerevisiae, and decrease the yeast biomass and glycerol yields by 45% and 33%.26 Glycerol formation has been suggested to be essential for maintaining the cytosolic redox balance and providing important intermediates (glycerophospholipids) for yeast biosynthesis.44,45 So, the decrease of glycerol production probably resulted in low yeast biomass yield. Other inhibitors (such as furfural and HMF) in a certain range of concentrations have also been reported to increase the alcohol yields.24,46,47 In our case, we did not see the increase of ethanol yields with the addition of furfural and HMF. This is probably due to the very low concentration of furfural and HMF (5.0 mM) that we added, which could not interfere in the biosynthesis of yeast.
Effects of OPA concentration on fermentation inhibition and growth of S. cerevisiae
Effects of different concentrations of OPA (between 0–1.0 mM) on the fermentation inhibition of S. cerevisiae were further determined (Fig. 3). Higher concentrations of OPA (1.0 mM) resulted in complete inhibition of ethanol production within 48 h of fermentation. Low concentrations of OPA (0.02 mM) did not show any inhibition on ethanol production of S. cerevisiae, and even slightly increased the final ethanol yield (Fig. 3). The addition of OPA between 0.1–0.5 mM decreased the fermentation rate significantly, but the final ethanol yields were dependent on the fermentation time (Fig. 3). The volumetric ethanol productivity decreased dramatically from 1.16 to 0.28 and 0.07 g L−1 h−1, respectively as the OPA concentration increased from 0.02 to 0.1 and 0.5 mM (Table 1). This indicated that the yeast cells could detoxify low concentrations of OPA by natural adsorption or depletion. This is probably due to the potential reaction between OPA and biological nucleophiles (amines or glutathione).48 This could be further demonstrated by the ethanol production curve (Fig. 3). Both 0.02 mM OPA and the control had their ethanol production level off within 10 h (Fig. 3). The slight increase in ethanol final yield in the presence of 0.02 mM OPA might have the same explanation as the presence of 5.0 mM vanillin. During the fermentation, we also detected that glycerol production was decreased in the presence of 0.02 mM OPA (data not shown). Increasing the concentration of OPA to 0.1 mM considerably decreased the ethanol productivity, but not the final yield. The ethanol production did not level off until 36 h, suggesting a lower ethanol productivity at higher OPA concentrations. The final ethanol yield was 0.45 g g−1, similar to the yield in the control. The addition of 0.5 mM OPA severely inhibited both ethanol productivity and the final yield (Fig. 3). Ethanol production was significantly inhibited within the first 24 h. The final yield was 0.29 g g−1, 60% of the control. Interestingly, the ethanol production was not completely inhibited in the first hour of fermentation. This suggested that a short time was required for OPA to be adsorbed by the yeast and enables the subsequent inhibition, which is probably due to the reaction between OPA and biological nucleophlies.49 Increasing OPA concentration to 1.0 mM has lead to the complete inhibition of ethanol production. This result indicated that OPA, as a model carbonyl compound, is a very potent inhibitor of ethanol production in S. cerevisiae, that it totally stopped ethanol production at concentrations as low as 1.0 mM (∼0.13 g L−1).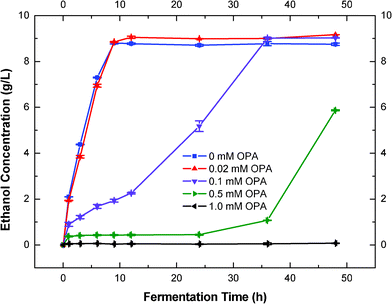 | ||
| Fig. 3 Effects of OPA concentration on fermentation inhibition and growth of S. cerevisiae. | ||
| OPA (mM) | C EtOH a (g L−1) | Y EtOH b (g g−1) | Q EtOH c (g L−1 h−1) |
|---|---|---|---|
| a C EtOH, ethanol concentration at 48 h. b Y EtOH, ethanol yield from total glucose at 48 h. c Q EtOH, volumetric ethanol productivity after 6 h. | |||
| 0 | 8.75 ± 0.05 | 0.44 ± 0.00 | 1.22 ± 0.00 |
| 0.02 | 9.17 ± 0.00 | 0.46 ± 0.00 | 1.16 ± 0.01 |
| 0.10 | 9.03 ± 0.01 | 0.45 ± 0.00 | 0.28 ± 0.01 |
| 0.50 | 5.87 ± 0.02 | 0.29 ± 0.00 | 0.07 ± 0.00 |
| 1.00 | 0 | 0 | 0 |
Effects of different concentration of OPA (between 0–1.0 mM) on the growth curve of S. cerevisiae were also investigated (Fig. 4). Higher concentrations of OPA resulted in lower growth yields of the yeast biomass (Fig. 4). Addition of 0.02 mM OPA showed a negligible effect on the yeast growth, only a 4% reduction of OD. As mentioned above, 0.02 mM of OPA increased the ethanol production by 4.5%. The fact that the same amount of OPA slightly decreased the growth rate gave us more evidence that the increase of ethanol with 0.02 mM of OPA was compromised by the decrease in biomass yield. Increasing the OPA concentration to 0.1 mM significantly decreased the yeast growth rate and the lag phase of S. cerevisiae. The growth of the yeast was reduced to 25% as compared to the control and the lag phase was observed to increase to 34 h (Fig. 4). Further increasing the OPA concentration to 0.5 and 1.0 mM completely stopped the yeast growth. No cell growth was observed during the 48 h growth period. These results indicated that the inhibition of OPA on yeast growth was much higher than that on ethanol production.
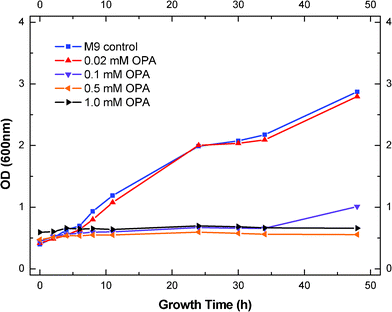 | ||
| Fig. 4 Effect of OPA concentration on growth of S. cerevisiae. | ||
Effects of different concentration of OPA (between 0–1.0 mM) on yeast growth were also investigated by counting the colony forming units (CFU) on the YPD solid media after incubating the yeast cells with OPA at different times. A similar trend as growth curve was observed (ESI†, Table S1). Addition of 0.02 mM OPA showed slightly lower CFU compared to the control. Increasing the OPA concentration to 0.1 mM considerably decreased the CFU. An addition of 0.5 mM OPA stopped the cell growth till 48 h, at which 0.17 × 10⁵ CFU was observed. This result indicated that OPA might suppress the growth of yeast cells but did not kill all of them. The yeast cells need a long lag phase to adapt to the high toxicity of OPA. With an OPA concentration of 1.0 mM, no colony was observed on the YDP plates after 48 h of incubation.
Effect of inoculation size of S. cerevisiae on OPA fermentation inhibition
It was reported that the inoculation size of S. cerevisiae affected the ethanol production in the presence of inhibitors.14,50 In order to test if the inoculation size of S. cerevisiae affected OPA inhibition of yhe fermentation, two different levels of inoculation size (0.5 g L−1 and 2.0 g l−1) of S. cerevisiae were used in the presence of 0.02 mM OPA.Starting with 2.0 g L−1 of yeast (inoculation size), the volumetric ethanol productivity (∼1.4 g L−1 h−1) and final ethanol yields (∼9.2 g L−1) were similar in S. cerevisiae fermentation with and without the addition of 0.02 mM OPA (Fig. 5). When the inoculation size was decreased to 0.5 g L−1, the volumetric ethanol productivity dropped significantly to 0.07 and 0.12 g L−1 h−1 with and without 0.02 mM of OPA; and the final ethanol yields was 3.4 g L−1 and 8.9 g L−1 with/without 0.02 mM of OPA (Fig. 5). This indicated that the higher inoculation size could overcome the fermentation inhibition when the inhibitor concentration was low. It also suggested the ethanologenic yeasts could tolerate the low concentration of carbonyl aldehyde inhibitors.51,52
 | ||
| Fig. 5 Effect of inoculation size of S.cerevisiae on OPA fermentation inhibition (with and without addition of 0.02 mM OPA). | ||
The results showed that, compared to the control, 0.02 mM OPA had no inhibition on ethanol fermentation when the inoculation size was 2.0 g L−1, while the same amount of OPA showed strong inhibition on ethanol productivity when the inoculation size was dropped to 0.5 g L−1 (Fig. 5). When the inoculation size was 2.0 g L−1, the volumetric ethanol productivity and final ethanol yields were similar between the fermentation with and without addition of OPA (0.02 mM). Overall, the ethanol production curves showed little difference between the addition of 0.02 mM OPA and the control (Fig. 5). When the inoculation size was decreased to 0.5 g L−1, an addition of 0.02 mM OPA decreased ethanol productivity to 58.3% and final yield to 39.3% as compared to the control (Fig. 5). The explanation might be that at a high inoculation size, the toxicity of OPA to each yeast cell was relatively low, because the toxicity is dose dependent. Therefore, ethanol production was compromised at low inoculation loading.
Effects of reducing sugars on alkaline detoxification of OPA
It has been shown that alkaline treatment could be used to remove the inhibition of aldehydes and ketones on microorganisms during fermentation.28,53 Alkaline treatment was reported to decrease furaldehyde concentration in the spruce hydrolysate by up to 40%.54 Alkaline treatment could also effectively remove aromatic carbonyl compounds with Ca(OH)2, NaOH and NH4OH under the pH range of 9–11.28Based on our preliminary research, it was the first time that we found that the OPA inhibitor would not be detoxified if glucose was not added before the alkaline treatment of OPA. Therefore, we hypothesized that reducing sugars played a very important role in the alkaline detoxification of OPA. In order to test this hypothesis, we investigated that the alkaline detoxification (pH 10 at 60 °C for 2 h) of OPA (1.0 mM) with the addition of reducing and non-reducing sugars (Fig. 6). Glucose and fructose were chosen to represent aldose and ketose reducing sugars respectively; sucrose was chosen as a non-reducing sugar. Fermentations were conducted to examine the removal of OPA inhibition in the presence of reducing and non-reducing sugars (Fig. 6). Fermentations with only the addition of sugar sources were conducted as controls.
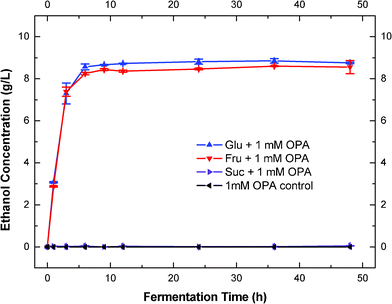 | ||
| Fig. 6 Effects of reducing sugars on alkaline detoxification OPA. | ||
After alkaline treatments, OPA inhibition was removed almost completely in fermentations when glucose and fructose were present in the detoxification process. Ethanol production achieved the plateau within 9 h (Fig. 6). On the other hand, OPA inhibition was evident and did not change when the sucrose was presented in the detoxification process (Fig. 6 and Table 2). This indicated that the detoxification of OPA could not be conducted effectively unless reducing sugars (either aldose or ketose) were present. This is probably the first time that is has been suggested that reducing sugars play a significant role in the alkaline detoxification of carbonyl compounds. When compared to their corresponding controls, the treated reducing sugar broths had faster fermentation rates (Table 2). The improved fermentation rates might be attributed to the addition of salts. The alkaline treatments and the following neutralization brought a considerable amount of sodium ions and sulfate ions into the fermentation broth, these salts could be helpful to the yeast. The final concentration of ethanol, on the other hand, was similar in the treated broths compared to the corresponding controls (Table 2).
| Samples | R s a (g L−1 h−1) | C EtOH b (g L−1) | Y EtOH c (g g−1) | Q EtOH d (g L−1 h−1) |
|---|---|---|---|---|
| a R s, sugar consumption rate after 3 h. b C EtOH, ethanol concentration at 48 h. c Y EtOH, ethanol yield from total glucose at 48 h. d Q EtOH, volumetric ethanol productivity after 6 h. | ||||
| Glu/OPA | 5.67 ± 0.13 | 8.75 ± 0.04 | 0.45 ± 0.02 | 2.43 ± 0.50 |
| Glucose | 4.19 ± 0.01 | 8.95 ± 0.04 | 0.44 ± 0.01 | 1.77 ± 0.09 |
| Fru/OPA | 5.93 ± 0.01 | 8.55 ± 0.31 | 0.44 ± 0.01 | 2.46 ± 0.22 |
| Fructose | 4.08 ± 0.10 | 8.88 ± 0.03 | 0.44 ± 0.00 | 1.71 ± 0.09 |
| Suc/OPA | 0 | 0 | 0 | 0 |
| Sucrose | 3.53 ± 0.12 | 9.35 ± 0.02 | 0.46 ± 0.00 | 1.65 ± 0.09 |
As mentioned above, the treated sucrose fermentation showed no ethanol production after 48 h of fermentation (Fig. 6). In the corresponding control, however, the sucrose was fermented successfully (Fig. 6 and Table 2). This implied that OPA was not detoxified during the alkaline treatment with sucrose as the sugar source. Interestingly, we also observed that in the alkaline treated broth, sucrose was hydrolyzed to glucose and fructose quickly after inoculation of the yeast (Fig. 7), which indicated the yeast released enzymes (invertase) for sucrose hydrolysis.55 It suggested that OPA was not detoxified in the presence of sucrose, but the toxic OPA appeared to have no affect on the invertase for sucrose hydrolysis.
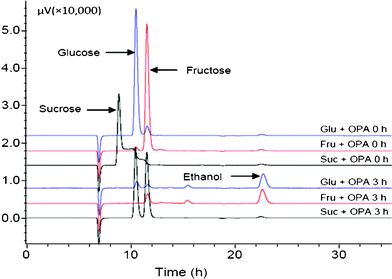 | ||
| Fig. 7 HPLC chromatogram of the fermentation samples after alkaline detoxification of OPA in the presence of glucose, fructose and sucrose at 0 and 3 h. | ||
We evaluated the role of pH in this reducing-sugar facilitated OPA detoxification. In the control without pH adjustment (to 10), the reducing sugar (glucose) and OPA was heated for two hours before the inoculation of yeast, glucose could not be fermented (Fig. 6) This indicated that alkaline condition (pH∼10) is required for this detoxification. Actually, we found that pH was changed differently during alkaline treatments with reducing and non-reducing sugars (ESI†, Table S2). We adjusted the pH of solution (sugars and OPA) to 10 with NaOH initially, then heated and mixed at 60 °C. The pH in solution with glucose and fructose dropped from 10 to around 9 and 8 respectively every 30 min (ESI†, Table S2, additional NaOH was added into solution to keep the pH at 10). However, pH didn't change in the sucrose treatment (ESI†, Table S2). With addition of the same amount of NaOH into sucrose, the pH was actually increased to 11 at the end of treatment. Before the fermentation, we readjusted the pH of the solution back to 6 with H2SO4. It suggested that the reducing sugars were reacted with OPA and brought the pH down, while the non-reducing sugars did not react with OPA and did not decrease the pH of the solution. Subsequently, it will be very interesting to identify the potential reaction mechanism between OPA and the reducing sugars. This will probably shed great insight on the detoxification reaction mechanism for biomass prehydrolysate.
Identification of the potential mechanism for the alkaline detoxification of OPA
The potential mechanism of reducing sugar facilitated alkaline detoxification of OPA was explored further based on the analysis of reaction products of OPA and glucose by Q-TOF LC/MS. As mentioned above, the alkaline detoxification could not be achieved unless a reducing sugar is present. This implied that the OPA might be converted into a non-toxic compound by a reducing sugar. LC/MS was used to analyze of the potential products in the alkaline treated OPA solution in the presence of 2% (w/w) glucose, fructose and sucrose respectively. The results showed that a new compound with a peak of 313.09 m/z ([M − H]−) was produced in the alkaline treated OPA solution of reducing sugars (Fig. 8). This compound existed at a very high intensity in the OPA solution treated with glucose or fructose (Fig. 8A and B), while it existed at a negligible intensity in the OPA solution treated with sucrose (Fig. 8C).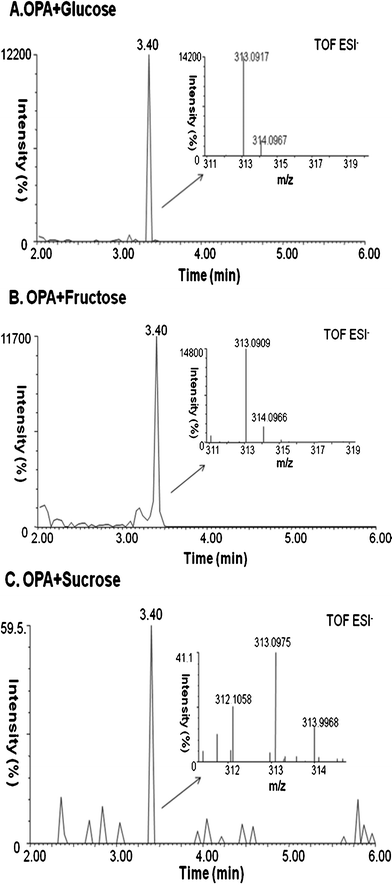 | ||
| Fig. 8 Mass spectra of the alkaline treatment of OPA in the presence of glucose (A), fructose (B) and sucrose (C). | ||
A composition analysis of this compound in the Masslynx software gave a formula of C14H18O8 (ppm-1.9), which was, exactly, the addition of the chemical formula of OPA C8H6O2 and a reducing sugar C6H12O6. A search of the literature led us to the prediction of this compound as the aldol reaction product (glucosyl (β-hydroxyl) benzene-carboxaldehyde).27,53 Generally, the aldol reaction takes place under base conditions when two carbonyl partners are present.29 Specifically, one of the carbonyl partners with an α-hydrogen atom is converted into its corresponding enolate ion under basic conditions. Then the enolate ion, acting as nucleophile, adds to the carbonyl group of the second partner. The resultant intermediate is then protonated to give an alcohol product. Therefore, the presence of a carbonyl compound with an α-hydrogen atom is a necessity for the reaction to start. This carbonyl condensation reaction occurs frequently in biosynthetic pathways as it is one of the most important methods for forming C–C bonds.56,57 Normally, the aldolization product contains the molecular weight of the addition of the two carbonyl reactants.29 In our case, glucose and fructose as reducing sugars both have carbonyl groups and α-hydrogen atoms, which could be converted by the hydroxide ion into their corresponding enolate ion. Then the enolate ion attacks one of the CHO groups of OPA to form the aldolization product (Fig. 9). Addition of another enolate ion to the second CHO group on OPA become less favored since the newly formed alcohol product on the first CHO group has much lower electron-withdrawing effect on the second CHO group on OPA, which makes the nucleophilic reaction less favorable.58 The steric effect could also be another factor. Therefore, the aldolization product between the reducing sugar and OPA could be the reaction of one reducing sugar with one CHO group on OPA. The prediction of the aldol reaction between the reducing sugar and OPA could explain our experimental result. LC/MS results showed that sucrose had no aldol reaction product with OPA under alkaline conditions (Fig. 8C). In addition, the chemical formula of C20H28O13, as aldol reaction product of OPA and sucrose, was not found. Sucrose as a non-reducing sugar has glucose and fructose bonded through α-D-glucopyranosyl-(1→2)-β-D-fructofuranoside. In such a case, the reducing end of both glucose and fructose is linked together and could not be open. Therefore, sucrose does not contain a carbonyl group. The aldol reaction could not take place with a chemical compound with no carbonyl group. Similarly, OPA contains zero α-hydrogens, which makes the aldol reaction impossible between the OPA molecules. Consequently, OPA inhibition was not able to be removed after alkaline treatment with OPA and sucrose (Fig. 6).
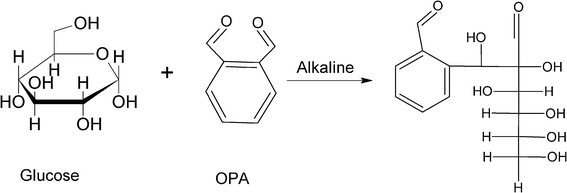 | ||
| Fig. 9 Potential carbonyl condensation mechanism for reducing sugar and OPA under alkaline conditions. | ||
Aldol reactions between reducing sugars and carbonyl aldehyde compounds have also been reported by other researchers. De Bruijn and coworkers reported that formaldehyde and fructose could react through aldolization in an aqueous alkaline solution.57 The authors also reported that formaldehydes oligomerized to form monosaccharides through aldolization in alkaline condition with the requirement of addition of >C2 aldehydes.57 This indirectly emphasized the importance of α-hydrogens on the carbonyl compounds for the aldol reaction to take place. Moreover, condensation reactions between OPA and aliphatic ketones have been utilized to produce benztropones.59 This also indicated that OPA could possibly undergo aldol condensation if appropriate carbonyl compounds with an α-hydrogen are present.
The detoxification product (aldol reaction product) of OPA in the presence of reducing sugars also suggests that the potent inhibition of OPA does indeed come from the two aldehyde groups. As our fermentation results have shown (Fig. 1), OPA was a considerably strong inhibitor of both the fermentation and growth of S. cerevisiae compared to the monoaldehyde compounds such as vanillin, furfural and HMF. On the other hand, OPA lost one of its CHO groups and thus its inhibition after reacting with the reducing sugars under basic conditions.
In fact, the alkaline treatment of OPA in the presence of reducing sugars or non-reducing sugar is a very complicated process. It was also reported that OPA could be oxidized to o-(hydroxymethyl)benzoic acid under alkaline conditions.58,60 During LC/MS analysis, the oxidization product of OPA was detected after alkaline treatment in the presence of glucose, fructose and sucrose. It was found that the oxidization products of OPA, including o-(hydroxymethyl)benzoic acid and phthalic acid, had considerably higher intensities in the alkaline treatment with glucose and fructose than with sucrose. The different oxidization rates of OPA under basic conditions with different sugars are still unknown and need further investigation. Moreover, compared to the aldol reaction products, the oxidization products of OPA under alkaline conditions had relatively low intensities (data not shown). This further indicated that the reducing sugars are the key factors for removal of OPA. In addition, saccharides such as fructose and glucose were reported to undergo retro-aldol reactions under base conditions.57 Some of the degradation products of saccharides are also aldehyde or ketone compounds with α-hydrogen. These retro-aldol reaction products from sugars could also react with OPA through aldol reactions to convert OPA into other compounds. Further research is necessary for full understanding of the chemical conversion of OPA under alkaline conditions with reducing and non-reducing sugars.
Conclusions
ortho-Phthalaldehyde as a model carbonyl aldehyde compound showed strong inhibitory effects on the fermentation and growth of S. cerevisiae. We found that its alkaline detoxification was potentially a reducing sugar facilitated aldol condensation reaction. It was the first time that we have proposed that the detoxification mechanism was a carbonyl aldol condensation reaction between sugars and aldehydes for aromatic inhibitors. We suggested that the reducing sugars played a significant role in the alkaline detoxification of aromatic carbonyl compounds. OPA could completely inhibit the fermentation and growth of S. cerevisiae compared to vanillin, furfural and HMF at 5.0 mM. The inhibition effect of OPA on the fermentation and growth of S. cerevisiae was found to be dose dependent. The OPA inhibition effect on the fermentation and growth of the yeast decreased with decreased concentrations of OPA. OPA showed no inhibition effect on both the fermentation and growth of yeast at low concentrations (0.02 mM). The inhibition effect of OPA could be overcome by increasing the inoculation size of the yeast. OPA inhibition could be removed under alkaline conditions (pH∼10) at 60 °C for 2 h in the presence of a reducing sugar (ketone or aldose). Non-reducing sugars could not result in the removal of OPA inhibition. LC/MS analysis of reaction products after detoxification in negative ion mode revealed a potential product, glucosyl (β-hydroxyl) benzene-carboxaldehyde with a molecular weigh of 313.09. This compound was predicted to be the aldol reaction product of the reducing sugar and OPA under base conditions. One of the CHO groups on OPA was converted into a hydroxyl group by nucleophilic addition of the enolate ion of the reducing sugar. Loss of one CHO group of OPA might be the key factor for detoxification. Future work will focus on the identification of real biomass hydrolysate inhibitors and their detoxificaton reactions.Acknowledgements
This study was supported in part by grants from the U.S. Department of Energy (DE-EE0003115), Alabama Agricultural Experimental Station (Auburn University).References
- F. A. Agblevor, J. Fu, B. Hames and J. D. McMillan, Appl. Biochem. Biotechnol., 2004, 119, 97–120 Search PubMed.
- B. C. Saha, L. B. Iten, M. A. Cotta and Y. V. Wu, Process Biochem., 2005, 40, 3693–3700 Search PubMed.
- A. Mohagheghi, M. Ruth and D. J. Schell, Process Biochem., 2006, 41, 1806–1811 Search PubMed.
- L. Olsson, B. Hahn-Hagerdal and G. Zacchi, Biotechnol. Bioeng., 1995, 45, 356–365 CrossRef CAS.
- S. Amartey and T. Jeffries, World J. Microbiol. Biotechnol., 1996, 12, 281–283 Search PubMed.
- T. D. Ranatunga, J. Jervis, R. F. Helm, J. D. McMillan and R. J. Wooley, Enzyme Microb. Technol., 2000, 27, 240–247 Search PubMed.
- R. F. Helm, J. Jervis, W. K. Ray, N. Willoughby, B. Irvin, J. Hastie, D. J. Schell and N. Nagle, J. Agric. Food Chem., 2010, 58, 12642–12649 Search PubMed.
- C. D. Luo, D. L. Brink and H. W. Blanch, Biomass Bioenergy, 2002, 22, 125–138 Search PubMed.
- J. J. Fenske, D. A. Griffin and M. H. Penner, J. Ind. Microbiol. Biotechnol., 1998, 20, 364–368 Search PubMed.
- J. M. Oliva, F. Saez, I. Ballesteros, A. Gonzalez, M. J. Negro, P. Manzanares and M. Ballesteros, Appl. Biochem. Biotechnol., 2003, 105, 141–153 Search PubMed.
- N. N. Nichols, L. N. Sharma, R. A. Mowery, C. K. Chambliss, G. P. van Walsum, B. S. Dien and L. B. Iten, Enzyme Microb. Technol., 2008, 42, 624–630 CrossRef CAS.
- S. F. Chen, R. A. Mowery, V. A. Castleberry, G. P. van Walsum and C. K. Chambliss, J. Chromatogr., A, 2006, 1104, 54–61 CrossRef CAS.
- T. D. Ranatunga, J. Jervis, R. F. Helm, J. D. McMillan and C. Hatzis, Biotechnol. Lett., 1997, 19, 1125–1127 Search PubMed.
- R. H. Leonard and G. J. Hajny, Ind. Eng. Chem., 1945, 37, 390–395 Search PubMed.
- H. B. Klinke, A. B. Thomsen and B. K. Ahring, Appl. Microbiol. Biotechnol., 2004, 66, 10–26 CrossRef CAS.
- S. Sakai, Y. Tsuchida, S. Okino, O. Ichihashi, H. Kawaguchi, T. Watanabe, M. Inui and H. Yukawa, Appl. Environ. Microbiol., 2007, 73, 2349–2353 Search PubMed.
- C. Martin, H. B. Klinke, M. Marcet, L. Garcia, E. Hernandez and A. B. Thomsen, Holzforschung, 2007, 61, 483–487 Search PubMed.
- M. H. Thomsen, A. Thygesen and A. B. Thomsen, Appl. Microbiol. Biotechnol., 2009, 83, 447–455 Search PubMed.
- L. Olsson and B. HahnHagerdal, Enzyme Microb. Technol., 1996, 18, 312–331 CrossRef CAS.
- Z. L. Liu, Appl. Microbiol. Biotechnol., 2006, 73, 27–36 Search PubMed.
- E. Palmqvist and B. Hahn-Hagerdal, Bioresour. Technol., 2000, 74, 25–33 CrossRef CAS.
- S. Helle, D. Cameron, J. Lam, B. White and S. Duff, Enzyme Microb. Technol., 2003, 33, 786–792 Search PubMed.
- T. A. Clark and K. L. Mackie, J. Chem. Tech. Biotechnol., Biotechnol., 1984, 34, 101–110 Search PubMed.
- T. Ezeji, N. Qureshi and H. P. Blaschek, Biotechnol. Bioeng., 2007, 97, 1460–1469 Search PubMed.
- Q. He, P. M. Lokken, S. Chen and J. Z. Zhou, Bioresour. Technol., 2009, 100, 5955–5965 Search PubMed.
- M. J. Taherzadeh, C. Niklasson and G. Liden, Chem. Eng. Sci., 1997, 52, 2653–2659 CrossRef CAS.
- I. S. Horvath, A. Sjode, B. Alriksson, L. J. Jonsson and N. O. Nilvebrant, Appl. Biochem. Biotechnol., 2005, 124, 1031–1044 Search PubMed.
- B. Alriksson, A. Sjode, N. O. Nilvebrant and L. J. Jonsson, Appl. Biochem. Biotechnol., 2006, 130, 599–611 Search PubMed.
- J. M. Murry, Organic Chemistry, Thomson-Brooks/Cole, Belmont, CA, 2008 Search PubMed.
- M. Jurado, A. Prieto, A. Martinez-Alcala, A. T. Martinez and M. J. Martinez, Bioresour. Technol., 2009, 100, 6378–6384 Search PubMed.
- T. Kishimoto and Y. Sano, J. Wood Chem. Technol., 2003, 23, 233–248 Search PubMed.
- G. J. Kang, Y. H. Ni and A. VanHeiningen, Appita J., 1997, 50, 313–318 Search PubMed.
- Y. S. Kim, H. M. Chang and J. F. Kadla, J. Wood Chem. Technol., 2008, 28, 1–25 Search PubMed.
- T. Kishimoto, J. F. Kadla, H. M. Chang and H. Jameel, Holzforschung, 2003, 57, 52–58 Search PubMed.
- F. Carvalheiro, J. C. Roseiro and F. M. Girio, Food Microbiol., 1999, 16, 543–550 Search PubMed.
- T. G. Watson, J. Gen. Microbiol., 1970, 64, 91–99 Search PubMed.
- W. Lee, J. Lee, C. Shin, S. Park, H. Chang and Y. Chang, Appl. Biochem. Biotechnol., 1999, 78, 547–559 Search PubMed.
- J. P. Delgenes, R. Moletta and J. M. Navarro, Enzyme Microb. Technol., 1996, 19, 220–225 Search PubMed.
- M. J. Taherzadeh, L. Gustafsson, C. Niklasson and G. Lidén, J. Biosci. Bioeng., 1999, 87, 169–174 Search PubMed.
- P. Cerrutti and S. M. Alzamora, Int. J. Food Microbiol., 1996, 29, 379–386 Search PubMed.
- D. J. Fitzgerald, M. Stratford and A. Narbad, Int. J. Food Microbiol., 2003, 86, 113–122 Search PubMed.
- S. Larsson, A. Reimann, N.-O. Nilvebrant and L. Jönsson, Appl. Biochem. Biotechnol., 1999, 77, 91–103 Search PubMed.
- J. N. Nigam, J. Biotechnol., 2001, 87, 17–27 Search PubMed.
- E. Albers, C. Larsson, G. Liden, C. Niklasson and L. Gustafsson, Appl. Environ. Microbiol., 1996, 62, 3187–3195 Search PubMed.
- M. Rigoulet, H. Aguilaniu, N. Averet, O. Bunoust, N. Camougrand, X. Grandier-Vazeille, C. Larsson, I. L. Pahlman, S. Manon and L. Gustafsson, Mol. Cell. Biochem., 2004, 256, 73–81 Search PubMed.
- E. Palmqvist, J. S. Almeida and B. Hahn-Hagerdal, Biotechnol. Bioeng., 1999, 62, 447–454 Search PubMed.
- C. F. Wahlbom and B. Hahn-Hagerdal, Biotechnol. Bioeng., 2002, 78, 172–178 Search PubMed.
- K. Chan and P. J. O'Brien, J. Appl. Toxicol., 2008, 28, 1004–1015 Search PubMed.
- K. Chan, R. Poon and P. J. O'Brien, J. Appl. Toxicol., 2008, 28, 1027–1039 CAS.
- C. Huang, H. Wu, Q. P. Liu, Y. Y. Li and M. H. Zong, J. Agric. Food Chem., 2011, 59, 4606–4613 Search PubMed.
- J. D. Keating, C. Panganiban and S. D. Mansfield, Biotechnol. Bioeng., 2006, 93, 1196–1206 Search PubMed.
- Z. L. Liu, P. J. Slininger, B. S. Dien, M. A. Berhow, C. P. Kurtzman and S. W. Gorsich, J. Ind. Microbiol. Biotechnol., 2004, 31, 345–352 CAS.
- D. B. Hodge, C. Andersson, K. A. Berglund and U. Rova, Enzyme Microb. Tech., 2009, 44, 309–316 Search PubMed.
- P. Persson, J. Andersson, L. Gorton, S. Larsson, N. O. Nilvebrant and L. J. Jonsson, J. Agric. Food Chem., 2002, 50, 5318–5325 CrossRef CAS.
- J. H. Koschwanez, K. R. Foster and A. W. Murray, PLoS Biol., 2011, 9 DOI:1001110.1001371/journal.pbio.1001122.
- A. Sultana, P. Kallio, A. Jansson, J.-S. Wang, J. Niemi, P. Mantsala and G. Schneider, EMBO J., 2004, 23, 1911–1921 CrossRef CAS.
- J. M. De Bruijn, A. P. G. Kieboom and H. V. Bekkiun, J. Carbohydr. Chem., 1986, 5, 561–569 CAS.
- P. Zuman, Chem. Rev., 2004, 104, 3217–3238 CrossRef CAS.
- W. Davey and H. Gottfried, J. Org. Chem., 1961, 26, 3699–3705 Search PubMed.
- P. Zhu and J. J. Wu, Abstr. Pap. Am. Chem. Soc., 2002, 224, U524–U524 Search PubMed.
Footnote |
| † Electronic supplementary information (ESI) available. See DOI: 10.1039/c2ra21163g |
| This journal is © The Royal Society of Chemistry 2012 |
