Role of textural properties and surface functionalities of selected carbons on the electrochemical behaviour of ionic liquid based-supercapacitors
Mauricio Mora
Jaramillo
a,
Alvaro
Mendoza
ab,
Susana
Vaquero
a,
Marc
Anderson
ac,
Jesus
Palma
a and
Rebeca
Marcilla
*a
aElectrochemical Processes Unit, IMDEA Energy Institute. Parque Tecnológico de Móstoles, Avda. Ramón de la Sagra, 328935, Mostoles, Madrid, Spain. E-mail: rebeca.marcilla@imdea.org; Fax: +34917371140; Tel: +34917371131
bDepartment of Chemical and Energy Technology. Escuela Superior de Ciencias Experimentales y Tecnología (ESCET), Universidad Rey Juan Carlos, 28933, Móstoles, Madrid, Spain
cEnvironmental Chemistry and Technology Program, University of Wisconsin-Madison, WI 53706, USA
First published on 12th July 2012
Abstract
In the present study, five different activated carbons are used as active electrode materials in Ionic Liquid based-Supercapacitors (IL-SCs). Selection of carbons was made according to their different textural and surface properties and includes microporous, microporous–mesoporous and mesoporous carbons with specific surface areas (SDFT) ranging from 1400 to 2200 m2 g−1 and pore lengths (Lo) ranging from 0.7 to 2.8 nm. These carbons are used to build IL-SCs using the ionic liquid N-butyl-N-methylpyrrolidinium bis(trifluoromethanesulfonyl)imide (PYR14TFSI) as the electrolyte. IL-SCs are electrochemically characterized by electrochemical impedance spectroscopy (EIS) and by galvanostatic charge/discharge (C/D) methods at 25 °C and at 60 °C. The effect of increasing the temperature and the voltage window on electrochemical performance is analysed. The performance of IL-SCs in terms of specific capacitance (Cs) and specific energy (Ereal) strongly increased with temperature and with maximum voltage (Vmax) reaching values as high as 245 F g−1 and 58 Wh kg−1 at 60 °C and 3.5 V. The influence of both textural properties and surface chemistry of the carbons on the performance of IL-SCs is analysed in detail.
1. Introduction
Activated carbons are commonly employed electrode materials in supercapacitors (SCs) due to their outstanding properties, such as good conductivity and stability, high attainable surface area, and low cost.1–3 Most of the high surface area carbons maintain a large charge capacity in aqueous electrolytes. However, since the specific energy of supercapacitors is proportional to the square of the operating voltage (Emax = ½CV2), it remains a challenge to achieve high energy in aqueous media due to the low decomposition voltage limit of water (around 1.2 V).In this sense, organic electrolytes based on propylene carbonate or acetonitrile, allowing operating voltages of typically 2.5–2.7 V, have been employed in many commercial supercapacitors specially oriented to higher energy applications.4,5 In terms of specific energy, aqueous based EDLCs are able to store specific energies in the range of 1–5 Wh kg−1 while this range increases to 5–20 Wh kg−1 with organic electrolytes.6
A further step towards the development of high energy supercapacitors has been taken by several groups that propose the use of ionic liquids (ILs) as electrolytes.7–11 Most of the publications reveal an increase in the operating voltage ∼3.5 V while still keeping moderate values of capacitance and consequently yielding higher values of specific energy. However, this increase in energy is accompanied by a loss in power mainly due to the lower conductivity and higher viscosity of ILs in comparison with conventional electrolytes. Increasing the operating temperature up to 100 °C12 and using mixtures of IL with organic solvents13–15 have been proposed as strategies for improving the power of SCs. However, it is still a challenge to obtain high values of both energy and power in Ionic Liquid based-Supercapacitors (IL-SCs) operating at room temperature and without the need for volatile organic solvents.
It is worth mentioning that most of the carbons available in the market are optimized for their use with conventional electrolytes (aqueous or organic) but they are not optimized to operate in combination with ILs. There are several research papers devoted to comparing activated carbons with different textural properties in IL-SCs. However, controversy exists in the scientific literature regarding performance with respect to the microstructure of the carbon. One group postulates that a narrow pore size distribution matching perfectly the ion size of the IL would provide for the best capacitor performance.16,17 Other groups claim that larger porous and even mesoporous materials could help to obtain higher capacitances by making it easier to incorporate the voluminous ions of the IL and improve the wettability of the electrodes with the electrolyte.18–24
In this paper, we show that performance of electrochemical capacitors cannot be based exclusively on the textural features of activated carbons and indeed this interpretation could be misleading. The surface chemical properties of carbon materials that determine the wettability between electrodes and electrolyte may be also a crucial factor in determining electrochemical performance and this factor has not received enough attention.25,26 On the other hand, although the improvement of electrochemical performance (particularly power density) of SCs by using carbons with higher electrical conductivity has been reported for conventional electrolytes,27 no similar research has been carried out with ILs until now.
The general aim of this work is to compare the electrochemical behaviour of five activated carbons having different textural properties and surface chemistries when they are used as active electrode materials in IL-SCs. The pyrrolidinium TFSI based ionic liquids exhibit the best compromise between wide electrochemical stability and high ionic conductivity28 so we choose PYR14TFSI as the electrolyte in this work. In the first part of the paper, the textural and microstructural characterization together with the identification of surface functionalities of the activated carbons are reported. In the second part, the performance of symmetric IL-SCs based on those carbons is investigated at room temperature and 60 °C. Special attention is paid in this study to relate electrochemical performance of IL-SCs to the crucial role of the micro-mesoporosity but also to the importance of surface functionalities that can affect both the electrical conductivity and the wettability of the electrodes.
2. Experimental
2.1 Materials
Five different activated carbons were investigated in this work. Picactif BP 10 (Pica), YECA (Fuzhou Yihuan Carbon) were commercially available and used as received. Z and T carbons derived from coconut shell (supplied by APowerCap Technologies) and CDC2 a carbide derived carbon (Skeleton Technologies) were also used as received. Polytetrafluoroethylene (PTFE 60 wt.% dispersion in water, Sigma Aldrich) was used as a binder and acetylene black (Sigma Aldrich) was used as conductivity enhancer for electrode preparation. N-butyl-N-methylpyrrolidinium bis(trifluoromethanesulfonyl)imide (PYR14TFSI) 99.9% purity was purchased from Solvionic and used as received.2.2 Physico-chemical characterization of activated carbons
Fourier transform infrared (FTIR) spectra were measured in a spectrometer Thermo NICOLET 6700 operating in diffuse reflectance mode (DRIFT). The FTIR spectrum was collected after 128 scans at a resolution of 4 cm−1 in the range of 4000–650 cm−1.
2.3 Preparation of electrodes and assembling of IL-SCs
As a standard procedure, electrode paste was prepared by vigorous mixing the activated carbon (80 wt.%), acetylene black (10 wt.%) and PTFE (10 wt.%) in 2-propanol. The paste was squeezed into a coin-shaped stainless steel mesh current collector (d = 1 cm). The electrodes were then pressed with a uniaxial press (CARVER model 3853-0) applying a pressure of 450 kg cm−2 and dried at room temperature overnight. The mass loading of the dried electrodes was 8–10 mg cm−2, excepting T carbon with 18 mg cm−2.Symmetric ionic liquid based supercapacitors (IL-SCs) were built by assembling a cellulosic filter paper (100 μm) soaked with PYR14TFSI between two identical carbon electrodes in a two electrode Swagelok® cell. Ionic liquid based supercapacitors (IL-SCs) were assembled and hermetically closed inside a glove box (O2 and H2O<0.1 ppm).
2.4 Electrical conductivity measurement
Electrical conductivity of carbon electrodes was measured at RT by the standard four-point probe technique using a SRM Probe Head purchased from Bridge Technology. Different current intensities were applied on the outer probes and the voltages were measured on the inner ones. The resistance of the electrodes was determined from the slope of the voltage versus current plot. Conductivity was calculated by using the following equation: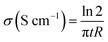 | (1) |
Where t is the thickness of the electrode in cm and R the resistance in Ω.
2.5 Electrochemical characterization of IL-SCs
The electrochemical behaviour of IL-SCs was investigated by electrochemical impedance spectroscopy (EIS) and galvanostatic charge/discharge (C/D) experiments using a Biologic VMP3 multichannel potentiostatic–galvanostatic system with an impedance module.For impedance spectroscopy experiments, the frequency range was varied from 200 kHz to 10 mHz at a bias voltage of 0 V with a potential amplitude of 10 mV.
C/D experiments were carried out from 0 V to Vmax (varied from 2 V up to 3.5 V at 0.5 V intervals) using current densities ranging from 5 to 20 mA cm−2. Specific capacitance of a supercapacitor (CSC in F g−1) is calculated from C/D experiments by applying eqn (2) where I is the discharge current, dV/dt is the slope of discharge curve and mtam is the total active mass of the supercapacitor (only the activated carbon is considered as active material in the calculations). In a symmetrical system where cathode and anode are composed of the same activated carbon (same anodic and cathodic capacitances) and both electrodes have the same weight, the specific capacitance referred to a single electrode (Cs) is related to the capacitance of the SC (CSC) by eqn (3). Both capacitances are referred to the weight of active material, (80% of the electrode weight).
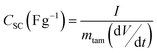 | (2) |
| Cs (F g−1) = 4·CSC | (3) |
Equivalent series resistance (ESR) and specific real energy (Ereal) of supercapacitors are calculated also from C/D experiments by applying eqn (4) and (5) to the discharge profile. ΔV is the ohmic drop when current is reversed, I is the discharge current density (same as the charge current density) and A is the geometric area of the electrodes. ti and tf are the integration limits corresponding to the time in which the discharge starts and finishes, respectively.
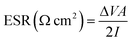 | (4) |
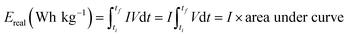 | (5) |
3. Results and discussion
3.1 Physico-chemical characterization of activated carbons
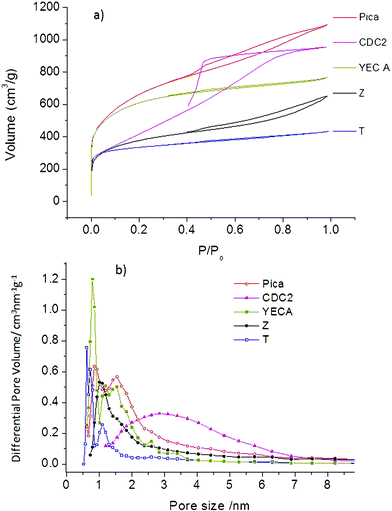 | ||
| Fig. 1 (a) N2 adsorption–desorption isotherms, (b) pore size distribution calculated from the QSDFT model. | ||
Recent studies have questioned the validity of using the Brunauer, Emmett and Teller (BET) equation for the sole determination of surface area for materials exhibiting microporosity.29–31 In this work, specific surface areas calculated by applying BET equation (SBET) are shown only for comparison purposes. Moreover, the quenched solid density functional theory (QSDFT) model has been also used (SDFT) since it has been claimed to offer a more realistic approach than SBET for surface area analysis involving micro-mesoporous carbons.32,33
Average surface areas (Sav) were also calculated by the following expression Sav = SBET/1.19Lo, where Lo is the pore length determined from Dubinin–Radushkevitch (DR) equation. Sav was reported recently and appears to be more reliable, due to the convergence of values obtained from three to four independent and equally valid techniques.29 However, this expression only covers the range of pore length from 0.5 to 1.7 nm so it cannot be applied for the CDC2 carbon containing larger pores.
Due to the large size of PYR14TFSI ions (0.8 nm for both cation and anion),22 pores smaller than 0.8 nm might not be accessible to the electrolyte so the overall microporosity of carbon electrodes might be underutilized.20 Effective surface areas (Se) defined as surface area of pores larger than 0.8 nm were calculated by QSDFT. Total and microporous volume (Vtot and Vmicro) were also determined using the QSDFT equation. The DR method was used to determine the pore length (Lo) for all carbons excepting CDC2 where the higher presence of mesoporous made it more appropriate to use the maximum value in the pore size distribution curve (DFT).
Table 1 summarizes all of the abovementioned textural parameters for the different carbons including SBET, SDFT, Sav, Se, Vtot, Vmicro and Lo. The percentage of micropores confirms that CDC2 is mesoporous (Vmicro only 28%) with SDFT of 1403 m2 g−1. T and YECA carbons are mainly microporous (Vmicro of about 75%) with SDFT of 1595 and 2154 m2 g−1, respectively. Pica, and Z carbons are micro-mesoporous (Vmicro of about 50%) with SDFT of 2185 m2 g−1 and 1460 m2 g−1, respectively. Lower values are found for Sav indicating than SDFT might be overestimated. Regarding the Sav value, the following trend is found for the carbons: YECA>T>Pica>Z.
| Activated carbons | S BET a/m2 g−1 | S DFT b/m2 g−1 | S av c/m2 g−1 | S e d/m2 g−1 | S e (%) | V tot e/cm3 g−1 | V micro f/cm3 g−1 | V micro (%) | L o g/nm |
|---|---|---|---|---|---|---|---|---|---|
| a Specific surface area determined by the BET method. b Specific surface area determined by the QSDFT model considering slit pore sizes. c Average surface area calculated from SBET/(1.19Lo). d Effective surface area calculated for pores >0.8 nm using QSDFT model. e Total pore volume calculated from QSDFT model. f Micropore volume (<2 nm) calculated from QSDFT, similar values were obtained with DR method. g Pore length calculated from Dubinin–Radushkevich (DR). h Pore size estimated from QSDFT pore size distribution, similar values were obtained with BJH. | |||||||||
| Pica | 2411 | 2185 | 1447 | 1265 | 58 | 1.58 | 0.85 | 48 | 1.4 |
| Z | 1551 | 1460 | 863 | 843 | 59 | 1.12 | 0.55 | 49 | 1.5 |
| T | 1263 | 1595 | 1516 | 300 | 19 | 0.62 | 0.47 | 75 | 0.7 |
| YECA | 2175 | 2154 | 1631 | 970 | 45 | 1.10 | 0.86 | 78 | 1.1 |
| CDC2 | 1452 | 1403 | — | 882 | 63 | 1.41 | 0.39 | 28 | 2.8h |
Table 1 shows that pore size (Lo) ranged from 0.7 nm for T carbon to 2.8 nm for the mesoporous CDC2. YECA has a pore size of 1.1 nm and Pica and Z carbon represent an intermediate size of 1.4 and 1.5 nm, respectively. The smallest pore size of 0.7 nm for T carbon is in accordance with the lowest effective surface (Se) of this carbon. In spite of having a high SDFT of 1595 m2 g−1, only 300 m2 g−1 are “effective” (only 20% of SDFT) when used with the electrolyte PYR14TFSI. Although much less pronounced, this effect is also noticeable in the rest of carbons.
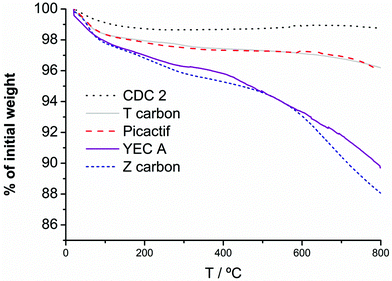 | ||
| Fig. 2 TGA profiles of the activated carbons under Ar flow, heating from 25 to 1000 °C at 10 °C min−1. | ||
Mass spectrum of released gases for both carbon Z and YECA shows that the chemical nature of functionalities was different for these two activated carbons. Curves corresponding to m/z = 44, 12 and 2, which correspond to ions [CO2]+• and [H2]+•, show peaks in the mass spectrum for both carbons indicating the presence of oxygenated functional groups. These peaks are more intense and appear in a broader range of temperature in Z carbon than in YECA indicating a higher percentage and wider variety of oxygenated functional groups in Z carbon. Moreover, a broad peak (from 200 to 600 °C) in the curve at m/z = 69 appears in YECA carbon but not in the Z carbon. This peak which might correspond to the [CF3]+ion has been ascribed in literature to molecules of CF4 in the gas phase having been evolved from a fluorinated carbon material.34
In order to corroborate this finding, FT-IR spectra of all the carbons were obtained (see Fig. 3). Although is not easy to conclusive identify all functional groups using FT-IR analysis, especially if the amount of these groups is not substantial, the presence of oxygenated functional groups in Z carbon is clearly observed by FT-IR and is in agreement with TGA and mass spectrometry characterization for the same carbon. In particular, two peaks at 1600 cm−1 and 1710 cm−1 were assigned to C![[double bond, length as m-dash]](https://www.rsc.org/images/entities/char_e001.gif) O groups (quinones, carboxylic acid) and the broad band around 1200 cm−1 could be attributed to C–O present in alcohols, esters, lactones, etc. No clear peaks corresponding to functional groups were identified for the rest of the carbons despite the significant loss weight observed in the YECA thermogram.
O groups (quinones, carboxylic acid) and the broad band around 1200 cm−1 could be attributed to C–O present in alcohols, esters, lactones, etc. No clear peaks corresponding to functional groups were identified for the rest of the carbons despite the significant loss weight observed in the YECA thermogram.
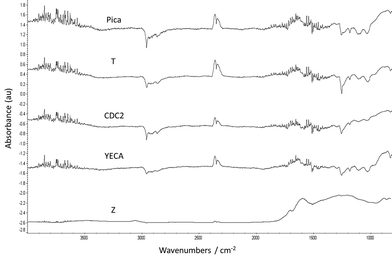 | ||
| Fig. 3 FT-IR spectra of the investigated activated carbons. | ||
![[thin space (1/6-em)]](https://www.rsc.org/images/entities/char_2009.gif) :10:10 (activated carbon:carbon black:PTFE) were determined by the standard four-point probe technique at RT. The highest σ was obtained for CDC2 with 165 S cm−1 and the lowest for Z carbon with 0.5 S cm−1. It is well-known that the presence of oxygenated surface functional groups in carbons can have a negative effect on electrical conductivity by virtue of a decrease in the availability of delocalized π-electrons.27,35 This fact is clearly observed here. The highest and lowest value of σ correspond to CDC2 and Z carbons respectively in accordance with the total absence of surface functional groups in CDC2 (no weight loss in TGA) and the significant amount of oxygenated surface functional groups of Z carbon (TGA and FT-IR). Intermediate σ values were obtained for T carbon, Pica and YECA with 27 S cm−1, 10 S cm−1 and 6 S cm−1, respectively.
:10:10 (activated carbon:carbon black:PTFE) were determined by the standard four-point probe technique at RT. The highest σ was obtained for CDC2 with 165 S cm−1 and the lowest for Z carbon with 0.5 S cm−1. It is well-known that the presence of oxygenated surface functional groups in carbons can have a negative effect on electrical conductivity by virtue of a decrease in the availability of delocalized π-electrons.27,35 This fact is clearly observed here. The highest and lowest value of σ correspond to CDC2 and Z carbons respectively in accordance with the total absence of surface functional groups in CDC2 (no weight loss in TGA) and the significant amount of oxygenated surface functional groups of Z carbon (TGA and FT-IR). Intermediate σ values were obtained for T carbon, Pica and YECA with 27 S cm−1, 10 S cm−1 and 6 S cm−1, respectively.
3.2 Electrochemical characterization of IL-SCs
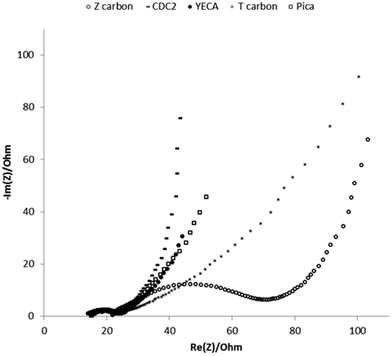 | ||
| Fig. 4 Nyquist impedance spectra of IL-SCs with different carbons obtained at applied potential of 0 V and 60 °C. Frequency range studied: 200 kHz–10 mHz. | ||
At low frequencies, pure capacitive materials show a vertical line in Nyquist plot whereas the presence of diffusive effects, typical of microporous materials, results in a tilted line reaching an angle of 45° for pure diffusive behaviour. Fig. 4 shows that the imaginary part of the impedance sharply increases for CDC2, showing the capacitive behaviour of the electrode. However, for the T carbon this trend is very different. A line tilted about 45° appears in the Nyquist plot of the T carbon showing that the diffusive contribution to the impedance is more important in this carbon. This is in good agreement with the N2 adsorption–desorption isotherm of T carbon that reveals a microporosity of 75% with a small pore length (Lo) of 0.7 nm that leads to a more pronounced diffusion limitation of the large PYR14TFSI ions into the small pores. On the other hand, the mesoporous character of CDC2 facilitates the accessibility of electrolyte into the big pores (Lo ∼ 3 nm). Pica, Z and YECA carbons with larger pores than T carbon, represent intermediate results accordingly to their textural properties. Results at 25 °C show the same trend but resistances are shifted to higher values due to the low conductivity and high viscosity of PYR14TFSI at this temperature.
To study the effect of temperature, C/D experiments from 0 V to a maximum voltage (Vmax) of 2 V were performed both at 25 °C and at 60 °C. Fig. 5 shows the Cs, ESR and Ereal for all the IL-SCs at RT (Fig. 5a, 5b and 5c) and at 60 °C (Fig. 5d, 5e and 5f). It has been already reported that increasing temperature leads to a conductivity increase while viscosity decreases in ionic liquids (ILs).38,39 Consequently, a significant decrease of ESR together with an increase of Cs and Ereal is observed for all IL-SCs. In particular, ESR values are reduced by half; from around 50 to 20 Ω cm2 (see Fig. 5b and 5e). As anticipated by impedance spectroscopy, Z carbon presents the highest value of ESR. This may be explained by the presence of oxygenated surface functional groups. On one hand, these functionalities leads to low values of electrical conductivity (σ = 0.5 S cm−1). On the other hand, the presence of hydrophilic functionalities might also enhance the contact resistance at the electrode/PYR14TFSI interface due to the hydrophobic character of the IL.37
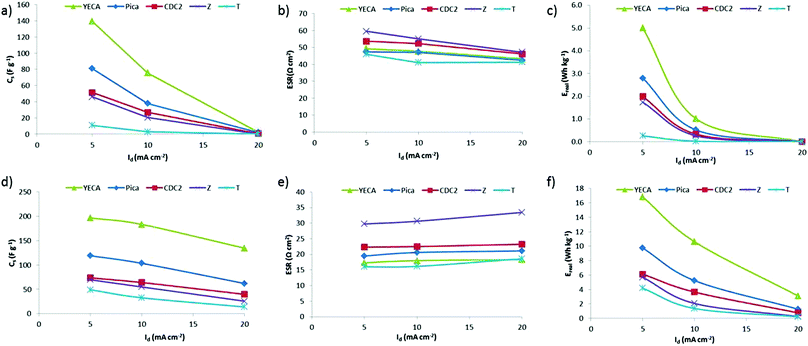 | ||
| Fig. 5 (a) Specific capacitance (Cs), (b) ESR and (c) specific real energy (Ereal) of IL-SCs from C/D experiments when Vmax = 2 V and at RT). (d) Cs, (e) ESR and (f) Ereal at 60 °C. | ||
It is observed from Fig. 5 that Cs and Ereal values of the IL-SCs represent the following trend both at 25 °C and at 60 °C: YECA ≫ Pica > CDC2 ≥ Z > T. YECA exhibits the highest values of Cs and Ereal reaching values of around 197 F g−1 and 17 Wh kg−1 at 5 mA cm−2 and 60 °C. As a general trend, Cs and Ereal decrease when increasing discharge current (Id) for all carbons. However, this drop is more significant at 25 °C where the ionic conductivity limitation of PYR14TFSI is more important.
One of the main advantages of using ILs as electrolytes is the possibility to work at higher potentials (Vmax). In order to study the effect of Vmax on the electrochemical parameters, charge/discharge experiments are carried out at 60 °C fixing the Id at 10 mA cm−2 and shifting the Vmax from 2 V to 3.5 V at increments of 0.5 V. For all IL-SCs, Fig. 6 shows that Cs and Ereal exhibit a linear and potential dependence on Vmax, respectively. Regarding the suitability of active carbon, Fig. 6 shows the same trend YECA ≫ Pica > CDC2 ≥ Z > T as observed before.
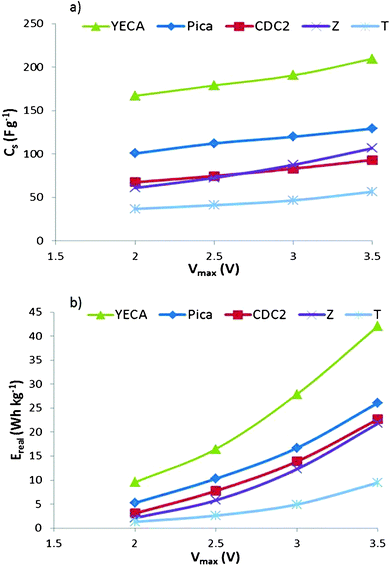 | ||
| Fig. 6 (a) Cs and b) Ereal of IL-SCs from C/D experiments at different Vmax. | ||
To complete the galvanostatic characterization, performance of IL-SCs working at Vmax of 3.5 V and different Id was investigated at 60 °C. As an example, Fig. 7a shows the C/D profiles of the different IL-SCs at Id of 10 mA cm−2. Voltage profiles are mostly linear and no important distortions are observed. It is worthy to highlight the profile of YECA carbon that shows much better electrochemical performance than the rest of activated carbons. A further optimization of the electrode preparation method and assembling of IL-SCs is currently being performed in order to reduce the ESR.
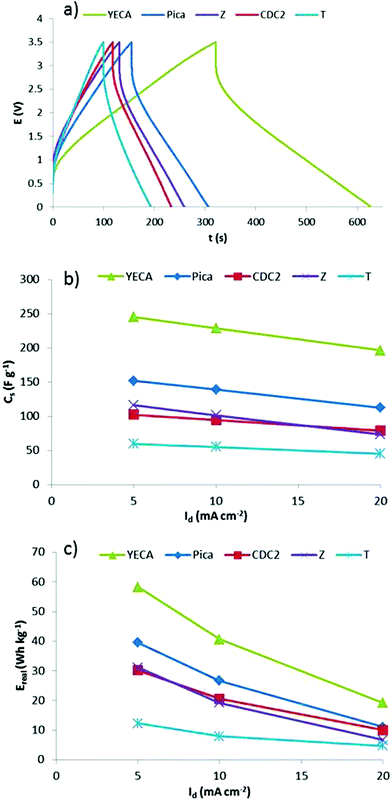 | ||
| Fig. 7 (a) C/D profiles of IL-SCs when they are charged at Vmax = 3.5 V and discharge at discharge current of 10 mA cm−2 at 60 °C, (b) Cs and (c) Ereal obtained from C/D experiments (Vmax = 3.5 V, 60 °C). | ||
C s and Ereal obtained from C/D profiles of IL-SCs are shown in Fig. 7b and 7c and the same trend is observed: YECA ≫ Pica > CDC2 ≥ Z > T. The T carbon represents the lowest value of Cs and Ereal (59 F g−1 and 12 Wh kg−1 at 5 mA cm−2) which can be explained by the low effective surface area of this microporous carbon (Se∼300 m2 g−1) as a consequence of its small pores (Lo = 0.7 nm). It is worth mentioning that the rest of the activated carbons have a much higher effective surface area (Se ≥ 850 m2 g−1). CDC2 and Z with similar values of Se (843 and 882 m2 g−1) show similar values of Cs (∼110 F g−1) and Ereal (∼30 Wh kg−1). Pica carbon, having the highest Se, has values of Cs and Ereal of 152 F g−1 and 40 Wh kg−1, respectively. Particularly interesting is the case of YECA carbon which, while having a lower Se than Pica, exhibits the highest values of Cs and Ereal reaching values of 245 F g−1 and 58 Wh kg−1 at low current density. Moreover, although YECA has a slightly higher average surface area (Sav) than Pica (1631 m2 g−1vs.1447 m2 g−1) this small difference could not explain the much better results obtained from the YECA carbon. Therefore, effective surface area (Se) and average surface area (Sav) are not the only textural parameters affecting the electrochemical performance of activated carbons.
A detailed study of textural properties shows that YECA carbon has a lower pore size than Pica (1.1 nm vs. 1.4 nm) being the percentage of microporous volume (Vmicro%) higher in the case of YECA, 78% vs. 48% for Pica. Moreover, pore size distribution of YECA carbon is narrower than for Pica and displays a maximum around 0.8 nm that coincides with the ions size of PYR14TFSI. As mentioned previously, some authors have claimed that a pore size closer to the electrolyte ion size leads to higher capacitances.16 Certainly, the combination of high microporous character, narrow pore size distribution and pores matching the size of ions in YECA carbon has a positive effect on the electrochemical performance of IL-SCs. However, we believe that the outstanding electrochemical performance of YECA cannot be explained by only taking into account the textural properties of this carbon. In this particular case, other factors such as surface chemistry might also have an influence on the electrochemical parameters. Our hypothesis points to the hydrophobic nature of the fluorinated surface functional groups determined by TGA as a key parameter in determining the superior performance of IL-SCs based on YECA carbon. Further research is being performed in order to quantify the effect of those functional groups in activated carbons with similar textural properties.
4. Conclusions
The electrochemical performance of IL-SCs based on five different activated carbons with diverse textural and surface properties has been investigated.The positive effect of increasing temperature and voltage window on specific capacitance of activated carbons (Cs) and specific energy of IL-SCs (Ereal) was confirmed by charge/discharge experiments. Electrochemical parameters such as Cs and Ereal were calculated and the following trend was found: YECA ≫ Pica > CDC2 ≥ Z > T. In all cases, best results were obtained when IL-SCs are cycled from 0 V to 3.5 V at 5 mA cm−2 and at 60 °C.
The T carbon represents the lowest value of Cs and Ereal due to their low pore size (Lo = 0.7 nm) and low effective surface area (Se∼300 m2 g−1) in comparison with the relatively high effective surface area of the rest of carbons (Se≥850 m2 g−1). YECA carbon that has a lower Se than Pica exhibits the highest values of Cs and Ereal reaching values of 245 F g−1 and 58 Wh kg−1 at low current density. These values widely exceed the performance of the commonly used Pica carbon in the same conditions (152 F g−1 and 40 Wh kg−1).
These results indicate that even if Se is a determining factor on the electrochemical behaviour of the IL-SCs other factors such as pore size distribution and surface chemistry of the activated carbons are also decisive. This work shows that YECA carbon having a combination of high microporous character, narrow pore size distribution, pore sizes matching ion sizes and fluorinated surface functional groups, exhibits the best electrochemical performances in IL-SCs.
Acknowledgements
The authors wish to thank the financial support of the European Commission within the frame of FP7 Project HESCAP (Grant Agreement n° FP7-241405). R. M. acknowledges financial support from the MINECO (former MICINN) through the Ramón y Cajal Program (RYC-2011-08093).References
- Y. Zhai, Y. Dou, D. Zhao, P. F. Fulvio, R. T. Mayes and S. Dai, Adv. Mater., 2011, 23, 4828–4850 CrossRef CAS.
- E. Frackowiak, Phys. Chem. Chem. Phys., 2007, 9, 1774–1785 RSC.
- A. G. Pandolfo and A. F. Hollenkamp, J. Power Sources, 2006, 157, 11–27 CrossRef CAS.
- T. A. Centeno, M. Hahn, J. A. Fernandez, R. Kotz and F. Stoeckli, Electrochem. Commun., 2007, 9, 1242–1246 CrossRef CAS.
- R. Kotz and M. Carlen, Electrochim. Acta, 2000, 45, 2483–2498 CrossRef CAS.
- J. A. Fernandez, M. Arulepp, J. Leis, F. Stoeckli and T. A. Centeno, Electrochim. Acta, 2008, 53, 7111–7116 CrossRef CAS.
- A. Lewandowski and M. Galinski, J. Phys. Chem. Solids, 2004, 65, 281–286 CrossRef CAS.
- T. Sato, G. Masuda and K. Takagi, Electrochim. Acta, 2004, 49, 3603–3611 CrossRef CAS.
- A. Balducci, U. Bardi, S. Caporali, M. Mastragostino and F. Soavi, Electrochem. Commun., 2004, 6, 566–570 CrossRef CAS.
- A. Balducci, R. Dugas, P. L. Taberna, P. Simon, D. Plee, M. Mastragostino and S. Passerini, J. Power Sources, 2007, 165, 922–927 CrossRef CAS.
- H. Kurig, M. Vestli, A. Janes and E. Lust, Electrochem. Solid-State Lett., 2011, 14, A120–A122 CrossRef CAS.
- R. Y. Lin, P. L. Taberna, S. Fantini, V. Presser, C. R. Perez, F. Malbosc, N. L. Rupesinghe, K. B. K. Teo, Y. Gogotsi and P. Simon, J. Phys. Chem. Lett., 2011, 2, 2396–2401 CrossRef CAS.
- A. Krause and A. Balducci, Electrochem. Commun., 2011, 13, 814–817 CrossRef CAS.
- E. Frackowiak, G. Lota and J. Pernak, Appl. Phys. Lett., 2005, 86 Search PubMed.
- A. Lewandowski, A. Olejniczak, M. Galinski and I. Stepniak, J. Power Sources, 2010, 195, 5814–5819 CrossRef CAS.
- C. Largeot, C. Portet, J. Chmiola, P. L. Taberna, Y. Gogotsi and P. Simon, J. Am. Chem. Soc., 2008, 130, 2730 CrossRef CAS.
- J. Chmiola, G. Yushin, Y. Gogotsi, C. Portet, P. Simon and P. L. Taberna, Science, 2006, 313, 1760–1763 CrossRef CAS.
- M. Lazzari, M. Mastragostino, A. G. Pandolfo, V. Ruiz and F. Soavi, J. Electrochem. Soc., 2011, 158, A22–A25 CrossRef CAS.
- M. Lazzari, F. Soavi and M. Mastragostino, Fuel Cells, 2010, 10, 840–847 CrossRef CAS.
- C. O. Ania, J. Pernak, F. Stefaniak, E. Raymundo-Pinero and F. Beguin, Carbon, 2006, 44, 3126–3130 CrossRef CAS.
- J. Zhou, X. Yuan, W. Xing, W. J. Si and S. P. Zhuo, Carbon, 2010, 48, 2765–2772 CrossRef CAS.
- F. B. Sillars, S. I. Fletcher, M. Mirzaeian and P. J. Hall, Energy Environ. Sci., 2011, 4, 695–706 CAS.
- J. A. Fernandez, S. Tennison, O. Kozynchenko, F. Rubiera, F. Stoeckli and T. A. Centeno, Carbon, 2009, 47, 1598–1604 CrossRef CAS.
- C. Arbizzani, S. Beninati, M. Lazzari, F. Soavi and M. Mastragostino, J. Power Sources, 2007, 174, 648–652 CrossRef CAS.
- J. Zhou, W. Xing, S. P. Zhuo and Y. Zhao, Solid State Sci., 2011, 13, 2000–2006 CrossRef CAS.
- M. Lazzari, M. Mastragostino and F. Soavi, Electrochem. Commun., 2007, 9, 1567–1572 CrossRef CAS.
- J. Sánchez-González, F. Stoeckli and T. A. Centeno, J. Electroanal. Chem., 2011, 657, 176–180 CrossRef.
- G. B. Appetecchi, M. Montanino, M. Carewska, M. Moreno, F. Alessandrini and S. Passerini, Electrochim. Acta, 2011, 56, 1300–1307 CrossRef CAS.
- T. A. Centeno, O. Sereda and F. Stoeckli, Phys. Chem. Chem. Phys., 2011, 13, 12403–12406 RSC.
- T. A. Centeno, J. A. Fernandez and F. Stoeckli, Carbon, 2008, 46, 1025–1030 CrossRef CAS.
- T. A. Centeno and F. Stoeckli, Electrochim. Acta, 2011, 56, 7334–7339 CrossRef CAS.
- A. V. Neimark, Y. Lin, P. I. Ravikovitch and M. Thommes, Carbon, 2009, 47, 1617–1628 CrossRef CAS.
- G. Y. Gor, M. Thommes, K. A. Cychosz and A. V. Neimark, Carbon, 2012, 50, 1583–1590 CrossRef CAS.
- Y. M. Shul'ga, V. E. Muradyan, V. A. Martynenko, B. P. Tarasov and N. V. Polyakova, Fullerenes, Nanotubes, Carbon Nanostruct., 2006, 14, 243–247 CrossRef CAS.
- M. J. Bleda-Martinez, J. A. Macia-Agullo, D. Lozano-Castello, E. Morallon, D. Cazorla-Amoros and A. Linares-Solano, Carbon, 2005, 43, 2677–2684 CrossRef CAS.
- J. Gamby, P. L. Taberna, P. Simon, J. F. Fauvarque and M. Chesneau, J. Power Sources, 2001, 101, 109–116 CrossRef CAS.
- Y. R. Nian and H. S. Teng, J. Electroanal. Chem., 2003, 540, 119–127 CrossRef CAS.
- A. Balducci, F. Soavi and M. Mastragostino, Appl. Phys. A: Mater. Sci. Process., 2005, 82, 627–632 CrossRef.
- A. Balducci, W. A. Henderson, M. Mastragostino, S. Passerini, P. Simon and F. Soavi, Electrochim. Acta, 2005, 50, 2233–2237 CrossRef CAS.
| This journal is © The Royal Society of Chemistry 2012 |