DOI:
10.1039/C2RA21020G
(Paper)
RSC Adv., 2012,
2, 9571-9583
An investigation of binding ability of ionic surfactants with trifluoperazine dihydrochloride: insights from surface tension, electronic absorption and fluorescence measurements†
Received
14th March 2012
, Accepted 3rd August 2012
First published on 31st August 2012
Abstract
This work deals with the effect of the ionic surfactants, sodium dodecylsulphate (SDS), dioctylsulphosuccinate sodium salt (AOT), dodecyltrimethylammonium bromide (DTAB) and didodecyldimethylammonium bromide (DDAB), on the physicochemical properties of the antidepressant phenothiazine drug, trifluoperazine dihydrochloride (TFP). Surface tension, fluorescence and electronic absorption measurements have been done in order to study the nature of interactions between drug–ionic surfactant mixtures. Various interfacial, micellar, spectroscopic and corresponding thermodynamic parameters have been calculated from these techniques. The values of the interaction parameter (β) suggest that cationic surfactants exhibit less synergistic interactions with TFP compared to anionic surfactants. To confirm this we further performed fluorescence quenching and electronic absorption titrations of ionic surfactants with TFP. Anionic surfactants (SDS, AOT) have been observed to bind preferentially with TFP over cationic surfactants (DTAB, DDAB), which supports the presence of a cationic charge on the head group of the drug and signifies that anionic surfactants can act as better drug-carriers than cationic surfactants even at very low concentrations. The blue shift and decrease in fluorescence intensity observed in fluorescence quenching methods for TFP + SDS/AOT mixtures confirms the formation of a new complex between interacting species. Also the number of binding sites for drug molecule has been estimated, which helps to give an insight into the mechanism of the drug–surfactant complexes formed. The results indicate that among electrostatic, hydrophobic and van der Waals forces, the former ones are the predominant intermolecular forces between TFP and ionic surfactants.
Introduction
The characterization of phenothiazine drugs with local anaesthetic, antibiotic, tranquillising and antidepressant actions has been the subject of interest due to their aggregation properties, which originates from their rigid, tricyclic hydrophobic group.1,2 Although the pharmacological effect of drug molecules is usually manifested at low concentrations where self-association is not important, it is likely that accumulation of drug molecules at certain sites in the body may cause a localized high concentration, resulting in aggregation and subsequent changes in biological activity due to their decreased ability to pass through biological barriers.3 This excess amount of drugs can cause over-stimulation, psychotic illness and other disorders. So the targeted drug-delivery in body organs is necessary and for these purpose cosolvents, complexing agents, liposome formulations, emulsions and solid dispersions can be used as drug-carriers.4,5 However, almost all these systems have disadvantages, e.g. cyclodextrins need special guest molecule structures for complexation. The stability of liposome encapsulated drugs within the bilayer may be affected due to drug–phospholipid interactions.6 Microemulsion systems are characterized by high surfactant concentrations. These disadvantages of excipients often limit the drug loading in the final product. In this context, the use of micelles as drug carriers presents advantages in comparison to other alternatives.7 The micelles can solubilise poorly soluble drugs in their hydrophobic core, thus increasing their bioavailability.8 Further, they can stay in the blood long enough and their sizes allow them to accumulate in areas with leaky vasculature.9 In addition to all this, drug–surfactant mixed systems have gained economic importance as the micelles are easy to prepare on a large scale.10
Trifluoperazine dihydrochloride (TFP, Fig. 1) represents a biologically important phenothiazine compound that has a great variety of biological, medical and chemical properties. TFP is commonly used in clinics as an antidepressant and antipsychotic drug.11,12 Under physiological conditions TFP is an amphiphilic cationic compound, which consists of a hydrophobic N-containing heterocycle bound to a short chain with a charged amino-group.13 An important and fundamental event in the interactions of drugs with biological tissues at the molecular level is their binding to the membranes.14,15 It is necessary to characterize in detail the drug interaction sites as well as the effect of the microenvironment on these sites.
The surface and bulk properties may have a strong influence on the biological activity of TFP, which makes this study interesting. Hence surface tension and fluorescence measurements have been performed on aqueous solutions of pure TFP and their mixtures with various conventional surfactants, such as sodium dodecyl sulphate (SDS), dioctyl sulphosuccinate sodium salt (AOT), dodecyltrimethyl ammonium bromide (DTAB) and didodecyldimethyl ammonium bromide (DDAB) at various mole fractions of drug. Drug–surfactant mixtures could be studied in the framework of theories originally developed for the surfactant-surfactant mixtures, thus the expressions derived for surfactant mixtures could be applied to the binary mixtures of TFP + SDS/AOT/DTAB/DDAB. The non-ideal behavior of binary mixture of surfactants has been proved by Regular Solution Theory (RST) but it does not adequately describe the behavior of monomers in a surfactant solution, activity coefficients (f1 and f2) and excess free energy in mixed surfactant systems. So Motomura and Rosen's approaches were also applied to explore the nature of these mixtures. The various micellar and interfacial parameters have been evaluated from fluorescence and surface tension measurements.
Spectroscopic studies help in pinpointing the origin of interactions responsible for such association at very low concentrations. So fluorescence quenching and UV-visible spectroscopic methods have been used to locate the number of binding sites (n) in a drug molecule. Further we have calculated the value of binding constants (K, Ka), Stern–Volmer quenching constants (Ksv), % Quenching effect (Q.E.) and the corresponding thermodynamic parameters (ΔGK and ΔG) to confirm our results.
Previous studies of amphiphilic drugs have reported the micellar and interfacial behavior of the phenothiazine derivatives, such as promethazine hydrochloride, chlorpromazine hydrochloride, amitriptyline hydrochloride in the presence of surfactants.16–18 Tabak et al.13 investigated the characteristics of binding of chlorpromazine and trifluoperazine with SDS by changing the pH. Recently, Mu et al.19 reported the aggregation properties and distribution behavior of toluidine blue in surfactin solution by UV-visible, IR and fluorescence measurements. But in the literature there is no report that correlates the micellization and spectroscopic studies to explain the effect of ionic surfactants on TFP and hence, the present study was pursued to meet these requirements. Significantly, this study would be helpful in (a) gaining an insight into the effect of an anti-depressant drug (TFP) on the micellar growth and structure of conventional surfactants, (b) evaluating the influence of the charge on the head group of a conventional surfactant on micellar structural change in drug–surfactant systems, and (c) understanding the effect of the hydrophobic part of the conventional surfactants on the drug–surfactant mixed micelles formed at various concentration ranges.
Experimental section
Materials
The amphiphilic drug trifluoperazine dihydrochloride (TFP) (≥98%), didodecyldimethyl ammonium bromide (≥98%), sodium dodecylsulphate (SDS) (≥99%) and pyrene (≥98%), used as a probe in fluorescence, were purchased from Sigma-Aldrich. Dioctyl sulphosuccinate sodium salt (AOT) (≥96%) was purchased from Lancaster Synthesis, UK. Dodecyltrimethyl ammonium bromide (≥99%) was an ACROS product. All the chemicals were of analytical grade and used without further purification. Double distilled water having a specific conductivity of range (1–2) × 10−6 S cm−1 was used for all the solution preparations. The solutions were prepared by mass with an accuracy of ±0.0001 g using a Sartorius analytical balance. All measurements have been performed at 25 °C after leaving overnight for the stabilization.
Methods
Surface tension measurements.
The Wilhelmy plate method was used to measure the surface tension (γ) values of the pure amphiphile and their mixtures with a Kruss Easy Dyne tensiometer from Kruss Gmbh (Hamburg, Germany). The platinum plate used in the measurements was cleaned by washing with doubly distilled water followed by heating through an alcoholic flame. The surface tension of doubly distilled water, 72.8 mN m−1 at 25.0 ± 0.1 °C, was used for calibration. The γ-values for pure and the mixture of amphiphiles (for even mole fractions) was measured by adding concentrated surfactant solution of pure amphiphile and their mixtures in aqueous solutions. The readings were noted after thorough mixing and temperature equilibration. The γ value decreased on the addition of surfactant solution up to a certain concentration and then it became constant. This break point refers to cmc value, as shown in Fig. 3. It is well known that cmc derived from surface tension is sensitive to impurities.3 There is no evidence of minima in the region of the cmc, which arises generally when highly surface-active impurities are present. The accuracy in the measurement of surface tension with the tensiometer is ±0.15 mN m−1.
Fluorescence measurements.
Steady-state fluorescence experiments were performed with a Cary Eclipse Fluorescence Spectrophotometer from Varian Ltd. at 25.0 ± 0.1 °C. A quartz cell having optical length of 10 mm was used for the measurements. The interactions between TFP and conventional surfactants were studied using fluorescence spectroscopy in two ways. In one of the experiments we studied the micellar properties of the mixtures of TFP with the surfactants by employing an external probe, pyrene. Secondly we studied the fluorescence quenching experiment by considering the effect of surfactants on the fluorescence spectra of phenothiazine moiety of TFP. For both of the experiments, the excitation and the emission band slits were kept at 5 nm. It is to be mention that the values of I1 and I3 for pyrene are not affected by the drug because the polarity of the system is judged by the intensity peaks at I1 (373 nm) and I3 (384 nm) whereas TFP shows a peak around 479 nm, so these peaks appear at different wavelengths and hence do not effect each other (Fig. S1, ESI†).
(a) Critical micelle concentration (cmc) measurements.
Pyrene is the most effective fluorescent probe to investigate the polarity changes in the systems. The concentration of pyrene used in all the measurements is equal to 10−6 mol dm−3 in order to avoid the interference of pyrene in the micelle formation process. The excitation wavelength for the pyrene was 335 nm, while the emission spectrum was recorded between 350–600 nm. The first (I1) and third (I3) vibronic peaks of the pyrene appeared at 373 and 384 nm, respectively. To determine cmc values, the I1/I3 of pyrene spectra were plotted against the concentration of amphiphiles (Fig. 2). For these experiments the concentration of the surfactants was kept 10 times of their cmc values.20
 |
| | Fig. 2 Plots of pyrene intensity (I1/I3) ratio vs. the total concentration (CT) of binary mixtures of drug and surfactants at various mole fractions of TFP (a) TFP + SDS (b) TFP + AOT (c) TFP + DTAB (d) TFP + DDAB at 25 °C. | |
Electronic absorption measurements.
The absorption spectra were monitored over the range of 250–400 nm with a UV-visible spectrophotometer (UV-1800, Shimadzu Company, Japan) equipped with a quartz cuvette (path length, 10 mm) at 25.0 ± 0.1 °C. The solutions for these experiments were prepared in a manner similar to that of the fluorescence quenching measurements.
Results and discussion
Mixed micellization of drug–ionic surfactant systems
Surface tension and fluorescence techniques have been employed to determine the critical micelle concentration (cmc) values of pure amphiphiles (TFP, SDS, AOT, DTAB and DDAB) and their binary mixtures i.e. TFP + SDS/AOT/DTAB/DDAB. Fig. 2 (a–d) and Fig. 3 (a–d) show the plots for all the binary mixtures of surfactants with TFP by employing fluorescence and surface tension techniques. However, for the pure drug (TFP) these plots are given in the ESI† (Fig. S2) and for pure surfactants the plots are not shown here. The cmc values obtained for the same are listed in Table 1 and both the techniques have shown comparable results, which indicate that the method dependent variations are apparent and their average values (Avg.) can be used for further calculations. The cmc values evaluated from the interfacial tension and fluorescence intensity differ from each other, indicating that method dependent variations are apparent. It has been observed that the cmc values obtained from the surface tension are lower than the fluorescence technique, which may be due to the fact that the surface tension measures onset of micelle appearance in the solution. The cmc values obtained from these techniques are low and of the order of 10−4 mol dm−3, hence these values can be easily averaged.21,22 These values for pure drug and ionic surfactants are found to be in good agreement with the literature values.11,18,22–24 It is worth mentioning here that to determine the cmc values more accurately each plot for all the mixtures at various mole fractions of TFP was examined separately. The cmc value of the aqueous solution of pure drug is lower than that of ionic surfactants due to the presence of various groups on the drug molecule which increases its hydrophobicity and favours micellization at low concentration.1,13 For the conventional surfactants, the presence of two hydrophobic tails in twin tail surfactants increases the hydrophobicity of the molecules, which in turn decreases their cmc values.24 With an increase in the mole fraction of TFP in the mixtures, a decrease in cmc values for all the mixtures has been observed. This indicates the formation of mixed micelles and drug molecules are penetrating into the micelles formed by the ionic surfactants in the solution. Similar behaviour has also been reported in the literature.25,26 The possible orientation of the drug molecule and its penetration in SDS micelles is depicted by Fig. 4. The drug molecule prefers the orientation in which the piperazine moiety remains in the stern layer and the hydrophobic portion of the drug is buried in the inner core of the surfactant-micelle. The penetration of the drug molecule depends on the nature and polarity of the micellar core and varies for the various surfactants used. In the case of cationic surfactants the penetration of the drug molecule in the core of micelles of DTAB and DDAB is difficult due to the electrostatic repulsion between the similar charges on the head groups of the interacting species. So these surfactants show lower binding affinity towards TFP than anionic surfactants at concentrations higher than the cmc.
 |
| | Fig. 3 Plots of surface tension (γ) vs. the logarithm of the total concentration (CT) of binary mixtures of drug and surfactants at various mole fractions of TFP (a) TFP + SDS (b) TFP + AOT (c) TFP + DTAB (d) TFP + DDAB at 25 °C. | |
 |
| | Fig. 4 A schematic representation of the penetration of TFP in SDS. | |
Table 1 Micellar parameters: Experimental Average cmc (cmcavg), Ideal cmc (cmc*), Micellar compositions (X1, X1,ideal), interaction parameter (β) and activity coefficients (f1, f2) of binary mixtures of TFP + SDS/AOT/DTAB/DDAB at various mole fractions of TFP (αTFP)
|
α
TFP
|
cmc × 104 (mol dm−3) |
cmc* (mol dm−3) |
X
1
|
X
1,ideal
|
β
|
f
1
|
f
2
|
| |
S.T.f |
Flu.f |
Avg. |
|
|
|
|
|
|
|
refers to ref. 23.
refers to ref. 11.
refers to ref. 22.
refers to ref. 18.
refers to ref. 24.
S.T.-surface tensión, Flu.-fluorescence.
|
| TFP + SDS |
| 0.00 |
80.0 |
88.0 |
84.0 (80.0)a |
|
|
|
|
|
|
| 0.19 |
0.74 |
1.24 |
0.99 |
2.31 |
0.72 |
0.977 |
−6.881 |
0.5830 |
0.0282 |
| 0.40 |
0.62 |
0.80 |
0.71 |
1.11 |
0.80 |
0.992 |
−5.837 |
0.7917 |
0.0238 |
| 0.60 |
0.54 |
0.60 |
0.57 |
0.74 |
0.86 |
0.996 |
−5.482 |
0.8981 |
0.0173 |
| 0.79 |
0.48 |
0.46 |
0.47 |
0.56 |
0.90 |
0.998 |
−7.617 |
0.9266 |
0.0020 |
| 1.00 |
0.48 |
0.41 |
0.44 (0.42)b |
|
|
|
|
|
|
| TFP + AOT |
| 0.00 |
25.0 |
26.4 |
25.7 (25.9)c |
|
|
|
|
|
|
| 0.20 |
0.38 |
1.71 |
1.04 |
2.09 |
0.71 |
0.934 |
−4.997 |
0.6568 |
0.0805 |
| 0.40 |
0.35 |
1.22 |
0.79 |
1.09 |
0.81 |
0.974 |
−3.858 |
0.8699 |
0.0795 |
| 0.61 |
0.33 |
0.65 |
0.49 |
0.72 |
0.81 |
0.988 |
−5.321 |
0.8252 |
0.0304 |
| 0.82 |
0.32 |
0.47 |
0.39 |
0.54 |
0.84 |
0.996 |
−5.749 |
0.8631 |
0.0173 |
| TFP + DTAB |
| 0.00 |
123 |
145 |
134 (138)d |
|
|
|
|
|
|
| 0.19 |
1.95 |
2.21 |
2.08 |
2.32 |
0.91 |
0.985 |
−3.698 |
0.9704 |
0.0467 |
| 0.39 |
0.63 |
0.96 |
0.79 |
1.14 |
0.83 |
0.994 |
−6.321 |
0.8330 |
0.0128 |
| 0.60 |
0.39 |
0.61 |
0.50 |
0.74 |
0.83 |
0.997 |
−7.229 |
0.8114 |
0.0068 |
| 0.79 |
0.38 |
0.60 |
0.49 |
0.56 |
0.91 |
0.999 |
−6.167 |
0.9512 |
0.0060 |
| TFP + DDAB |
| 0.00 |
0.48 |
0.42 |
0.45 (0.45)e |
|
|
|
|
|
|
| 0.20 |
0.44 |
0.42 |
0.43 |
0.45 |
0.00 |
0.200 |
0.000 |
1.000 |
1.000 |
| 0.40 |
0.39 |
0.33 |
0.36 |
0.45 |
0.43 |
0.401 |
−0.843 |
0.7360 |
0.8556 |
| 0.60 |
0.35 |
0.31 |
0.33 |
0.44 |
0.57 |
0.601 |
−1.274 |
0.7901 |
0.6610 |
| 0.80 |
0.34 |
0.31 |
0.32 |
0.44 |
0.69 |
0.800 |
−1.602 |
0.8573 |
0.4664 |
The properties of ideal or non-ideal behavior of mixed micelles of drugs with ionic surfactants can be investigated by applying a pseudo-phase model.27 The main assumption of this model is that the micelles are considered to be a macroscopic phase in equilibrium with a solution containing the corresponding monomers. Under the equilibrium condition of micelle formation, for binary mixtures the ideal cmc is related to the individual cmc's28 by the eqn (1):
| |  | (1) |
where cmc
1 and cmc
2 are the cmc's of pure
drug (TFP) and pure
surfactants (SDS, AOT, DTAB and DDAB), respectively,
α1 is the mole fraction of TFP in the bulk and cmc* is the ideal state mixed cmc. It is clear from
Table 1 that the experimental values of cmc for mixed systems are deviating from the ideal values, which indicates synergism in the mixed micelle formation. The cmc values for all the binary mixtures are found to be less than the cmc* values, which indicate that micelles are formed at a concentration lower than that expected from the ideal mixing. This further suggests that TFP + SDS/AOT/DTAB/DDAB mixtures are formed by attractive interactions.
To study the interactions between drug and surfactant molecules various parameters have been calculated. Regular Solution Approximation29 has been employed for the evaluation of micellar mole fractions (X1) of drug using eqn (2):
| |  | (2) |
where cmc is critical micelle concentration of mixed systems. The above equation is solved to obtain the value of
X1 (
Table 1), which is used for the calculation of the interaction parameter,
β, by
eqn (3).
| |  | (3) |
β values give information on both the nature and strength of interaction between the components in mixed micelles. According to Rubingh,
29 a negative
β value indicates an attractive interaction or synergism, a positive value indicates a repulsive interactions or antagonism and zero value means no interaction in the mixture. Also, higher magnitude of
β values indicates greater interactions whether attractive or repulsive.
Table 1 lists the
β values for TFP + SDS/AOT/DTAB/DDAB mixtures, which are found to be negative for all the mixed systems. However, for the TFP + DDAB system particularly at
αTFP = 0.20 the system behaves as pure components and
β value comes out to be zero, which is due to the weak interactions between DDAB and the
drug molecule. The magnitude of
β values show an overall increase with the increase in mole fraction of TFP for all the binary mixtures studied. This indicates that attractive interactions between the
surfactants and
drug molecules increase with increase in
αTFP due to a rise in the polarity of the medium and hydrophobic interactions caused by the tails of interacting species. This increase in attractive interactions is also supported by the decrease in cmc values (
Table 1). Also, the magnitude of
β values is higher for mixtures of TFP with single chain
surfactants (SDS, DTAB) than TFP with twin-tail
surfactants (AOT, DDAB). This is attributed to the steric hindrance caused by the twin-tail molecules near the head group of
drug molecules and hence restricts the formation of mixed micelles by limiting the effective head group interactions between TFP and AOT/DDAB and hence decreases the value of the interaction parameter.
For synergism in mixed micelle formation, two conditions must be followed: (1) β must be negative, and (2) |β| > |ln (cmc1/cmc2)|.30 Both the conditions are followed by all the binary mixtures studied, which shows that all the systems behave non-ideally. It can be evaluated from the data that all the systems show strong synergism with the β-average values. (βavg) for TFP as −6.454, −4.981, −5.853, −1.239 with SDS, AOT, DTAB, DDAB, respectively. These values suggest that synergism is more for the mixed systems of TFP + SDS/AOT than TFP + DTAB/DDAB. Higher synergism in TFP + SDS/AOT can be explained on the basis of the fact that the rigid portion of the drug molecule binds tightly to the anionic surfactants due to favored electrostatic interactions between the cationic head group of drug molecule and anionic surfactants, which form “ion-paired amphiphiles”. Among binary combinations, the least synergism is observed for the mixed system of TFP + DDAB and the highest for TFP + SDS mixtures.
The micelle mole fraction of the mixed systems in the ideal state (X1,ideal) has been computed by Motomura's approximation,31 which is given by eqn (4).
| |  | (4) |
The values of X1,ideal and X1 increase with the increase in mole fraction of TFP for all the binary mixture (Table 1 and Fig. S3, ESI†). The deviation of X1 from X1,ideal values suggests non-ideal behavior of mixed systems. The increase in X1 values indicates that the mixed micelle formation is favoured as compared to micelle formation of pure components and the mixed micellar phase is enriched in surfactant molecules. The values of X1,ideal are more than X1 for most of the binary mixtures, which suggests that more surfactant is present in the micellar phase than it should be in an ideal mixed state. However, an opposite behavior has been observed for the binary mixtures of TFP + DDAB at low αTFPi.e. 0.20 and 0.40, which suggests that the mixed micelles formed are rich in the drug component. This can be due to the different hydrophobic portions of both components.
The activity coefficients f1 (of the drug) and f2 (of the ionic surfactants) in the mixed micelles, according to the Regular Solution Theory, are explained by following equations:
| | | f1 = exp [β·(1 − X1)2] | (5) |
The values of f1 and f2 are less than unity for most of the systems, indicating non-ideal behavior and attractive interactions between drug molecules and surfactants in the mixed micelles (Table 1). An exception has been noted in the case of TFP + DDAB mixtures at αTFP = 0.20 i.e. the value of the activity coefficients is unity, which supports that the system behaves as pure components at low αTFP (the β value also suggests this fact). The highest deviation in f1 and f2 is observed for TFP + DTAB and least for TFP + DDAB mixtures.
Adsorption at the air/water interface
The adsorption behavior of mixtures of TFP + SDS/AOT/DTAB/DDAB at the interface and its consequent effect on the interfacial properties varies significantly with the concentration of relative components. As the concentration of drug–surfactant mixtures increases, they orient at the air–water interface and substantially decrease the interfacial tension. The surface excess (Γmax) is an effective measure of adsorption of the drug–surfactant mixtures per unit area for various αTFP at the air/water interface. To calculate the interfacial adsorption the Gibbs adsorption equation32 is used, which is given by eqn (7).| | 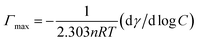 | (7) |
The values of minimum area per molecule, Amin33 are calculated using eqn (8):
| | | Amin = 1020/(NAΓmax) (Å2) | (8) |
where
C,
n,
R,
T and
NA are the total concentration of interacting species, no. of species at the air/solution interface, gas constant, temperature and Avogadro's number, respectively. The value of
n is used as 2 for pure
drug and
surfactants. However, for the mixtures this value is 3 by taking into consideration that they merely indicate changes with the change in the nature and concentration of additives.
17 The
Γmax or
Amin values for pure TFP, AOT are in good agreement with the literature values.
1,22 The
drug–
surfactant solutions have greater preference to be adsorbed at air/solution interface compared to the pure
drug. The values of
Γmax or
Amin depend upon (a) the formation of a compact interfacially adsorbed mixed
drug–
surfactant monolayer because of attractive interactions or van der Waals forces between the hydrophobic part of the
drug molecule and
surfactants, (b) a steric factor caused by bulky groups present in the interacting species. The values of
Amin are more for the mixtures of
drug–surfactant systems than the individual
surfactants, which suggests that interacting components are closely packed at the air/water interface so that their orientation is almost perpendicular to the interface. The values of surface excess and minimum area per molecule shows different trend for mixtures of the
drug with single chain and double-chain
surfactants (
Table 2). For TFP + AOT/DDAB mixtures,
Γmax values increase and
Amin decreases with the increase in the mole fraction of the
drug. On the other hand, for TFP + SDS/DTAB mixtures, the values of
Γmax and
Amin show an overall decrease and increase, respectively, with the increase of
αTFP. This is due to the strong electrostatic interactions and less steric factor between TFP and single chain
surfactants, which increases the minimum area per molecule. The values of surface pressure at cmc (
Πcmc) were obtained by using
eqn (9) and are given in
Table 2.
Table 2 The surface pressure at cmc (Πcmc), surface excess (Γmax .106), minimum area per molecule (Amin) and packing parameters (p) of TFP + SDS/AOT/DTAB/DDAB at various mole fractions of TFP (αTFP)
|
α
TFP
|
Π
cmc (mN m−1) |
Γ
max × 106 (mol m−2) |
A
min (Å2) |
p
|
| TFP + SDS |
| 0.00 |
39.6 |
1.831 |
90.6 |
0.47 |
| 0.19 |
41.5 |
1.413 |
117.4 |
0.36 |
| 0.40 |
41.5 |
1.415 |
117.2 |
0.36 |
| 0.60 |
41.8 |
1.416 |
117.1 |
0.36 |
| 0.79 |
39.7 |
1.251 |
132.6 |
0.32 |
| 1.00 |
16.1 |
1.867 |
88.9 |
0.48 |
| TFP + AOT |
| 0.00 |
42.7 |
1.404 |
118.2 |
0.35 |
| 0.20 |
42.1 |
0.217 |
761.9 |
0.05 |
| 0.40 |
41.3 |
0.996 |
166.5 |
0.25 |
| 0.61 |
40.7 |
1.013 |
163.7 |
0.25 |
| 0.82 |
41.1 |
1.112 |
149.2 |
0.28 |
| TFP + DTAB |
| 0.00 |
40.4 |
1.782 |
93.1 |
0.45 |
| 0.19 |
18.5 |
0.592 |
280.3 |
0.15 |
| 0.39 |
13.8 |
0.436 |
380.0 |
0.11 |
| 0.60 |
10.2 |
0.435 |
380.8 |
0.11 |
| 0.79 |
9.9 |
0.314 |
528.7 |
0.07 |
| TFP + DDAB |
| 0.00 |
43.7 |
1.285 |
129.2 |
0.33 |
| 0.20 |
43.4 |
0.825 |
201.0 |
0.21 |
| 0.40 |
42.1 |
0.899 |
184.6 |
0.22 |
| 0.40 |
42.1 |
0.899 |
184.6 |
0.22 |
| 0.60 |
40.3 |
0.961 |
172.6 |
0.24 |
| 0.80 |
35.9 |
1.223 |
135.6 |
0.31 |
where
γo and
γcmc are the surface tension of the
solvent and of the mixture of
drug-
surfactants at cmc, respectively. The values of
Πcmc (
Table 2) for the binary mixture of
drug–
surfactants show an overall decrease as
αdrug increases. However
Πcmc values for TFP + SDS mixtures firstly increase and then decrease with the increase in mole fraction of the
drug. The minimum surface area (
Amin) of
amphiphiles in mixed micelles can be used to find out the packing parameter (
p), which determines the geometry of micelles and indicate the minimum sized micelles in solution. The packing parameter minimizes the Gibbs free energy of micellization and is given by
eqn (10):
where
Vo is the volume of exclusion per monomer in the aggregate, given by Tanford's formulae,
34Vo = [27.4 + 26.9(
nc − 1)] 2 Å
3,
lc = [1.54 + 1.26(
nc − 1)] Å is the maximum chain length, and
nc is the number of carbon atoms in the
hydrocarbon chain.
35 Here
Amin is related to the
surfactant monolayer at the air/solution interface as explained above. The value of
p is higher than 1/3 for TFP, SDS, AOT, DTAB and equal to 1/3 for DDAB, which indicate the formation of cylindrical micelles (when
p is 1/3–1/2).
36,37 Some authors have also reported a value of the packing parameter of more than 0.33 for single chain
surfactants, which may be due to the flattening of the head group of
surfactants.
35,37 However, for twin tail
surfactants this value is less than expected, which is due to the concentration of the
surfactants used which affect the number of
surfactant molecules undergoing the process of self-association and hence the shape of the micelle formed.
37 Similarly for TFP + SDS mixtures, the value of
p is found to be higher than 1/3 for most of the mole fractions. The size of mixed micelles for these mixtures is determined by the electrostatic interactions between the head group of TFP and SDS, which are stronger and hence decrease
Amin compared to what it would be for other mixtures. The value of
p < 1/3 suggests the formation of spherical micelles in the case of TFP + AOT/DDAB/DTAB mixed systems. This can be explained on the basis that for these mixtures, the minimum area per molecule increases due to the steric origin from the tails of AOT/DDAB and electrostatic origin for ionic head group of the DTAB.
Thermodynamics of bulk and interfacial phenomena
The value of critical micelle concentration can serve as a measure of micelle stability in a given state, the standard thermodynamic parameters of micellization (ΔGom)38 can be determined by the use of following relation: where C12m is the cmc of the mixture of the two components at a given mole fraction. It is observed that the ΔGom values (Table 3) are all negative and the addition of surfactant to the aqueous solution of drug made the formation of mixed micelles more facile. With an increase in the mole fraction of drug, these values become more negative, which indicates that the micellization process becomes more spontaneous for all the mixtures studied.
Table 3 Thermodynamic parameters: free energy of micellization (ΔGom), free energy of adsorption (ΔGoads), surface free energy (Gsmin), excess free energy (ΔGoex) of binary mixtures of TFP + SDS/AOT/DTAB/DDAB at various mole fractions of TFP (αTFP)
|
α
TFP
|
ΔGom(kJmol−1) |
ΔGoads(kJmol−1) |
G
s
min(kJmol−1) |
ΔGex(kJmol−1) |
| TFP + SDS |
| 0.00 |
−11.841 |
−33.469 |
16.649 |
|
| 0.19 |
−22.839 |
−52.209 |
20.300 |
−3.436 |
| 0.40 |
−23.664 |
−52.993 |
20.695 |
−2.313 |
| 0.60 |
−24.177 |
−53.697 |
20.467 |
−1.635 |
| 0.79 |
−24.668 |
−56.403 |
24.443 |
−1.698 |
| 1.00 |
−24.803 |
−33.426 |
29.293 |
|
| TFP + AOT |
| 0.00 |
−14.775 |
−52.199 |
20.299 |
|
| 0.20 |
−22.705 |
−216.71 |
134.91 |
−2.549 |
| 0.40 |
−23.400 |
−64.866 |
29.697 |
−1.471 |
| 0.61 |
−24.516 |
−64.754 |
29.396 |
−2.028 |
| 0.82 |
−25.108 |
−62.068 |
27.326 |
−1.914 |
| TFP + DTAB |
| 0.00 |
−10.676 |
−27.701 |
16.266 |
|
| 0.19 |
−20.996 |
−52.246 |
87.298 |
−0.750 |
| 0.39 |
−23.384 |
−55.035 |
129.11 |
−2.209 |
| 0.60 |
−24.516 |
−47.965 |
137.63 |
−2.527 |
| 0.79 |
−24.576 |
−56.105 |
191.39 |
−1.251 |
| TFP + DDAB |
| 0.00 |
−24.792 |
−62.627 |
21.789 |
|
| 0.20 |
-24.881 |
−77.487 |
32.334 |
0.000 |
| 0.40 |
−25.302 |
−72.132 |
32.476 |
−0.511 |
| 0.60 |
−25.514 |
−67.449 |
31.202 |
−0.773 |
| 0.80 |
−25.551 |
−54.905 |
28.278 |
−0.848 |
Adsorption of amphiphiles at interfaces is determined by a number of forces involving electrostatic attraction, covalent bonding, hydrogen bonding, hydrophobic bonding and solvation and desolvation of various species. The extent and type of forces involved depends on the nature of adsorbate, adsorbent, their composition, and other characteristics of the solvent.39 The influence of such forces on the adsorption behavior is reviewed here from a thermodynamics point of view. ΔGoads, the driving force for adsorption, will be the sum of a number of contributing forces mentioned above. However, here ΔGoads is calculated using ΔGom, which is translated into the standard free energy of adsorption40 at the air/water interface using eqn (12):
| | | ΔGoads = ΔGom − Πcmc/Γmax | (12) |
The second term (Πcmc/Γmax) in the above equation represents the surface work involved in transferring from zero surface pressure to Πcmc at constant minimum area per molecule. Here for all the binary mixtures, the last term of eqn (12) is very small compared to the ΔGom, which suggests that work involved in transferring the surfactant molecule from a monolayer at zero surface pressure to the micelle is negligible. The ΔGoads values (Table 3) are all negative for all the systems studied, which suggests a spontaneous adsorption. Moreover, these values indicate that when a micelle is formed, work has to be done to transfer the surfactant molecules in the monomeric form at the surface to the micellar stage through the aqueous medium.41 ΔGoads values increase with the increase in mole fraction of drug for TFP + single chain surfactants (SDS/DTAB). However, an opposite behavior has been observed for TFP + double chain surfactants (AOT/DDAB). This behavior confirms that, with the increase in the mole fraction of TFP in the case of TFP + AOT/DDAB mixtures, the adsorption process becomes less facile due to the increase in steric hindrance caused by the tails of the surfactants, which further decreases the self-association process at the air/water interface. Also ΔGoads values are found to be more negative than ΔGom, which indicates that the process of adsorption at the surface is more favourable than micelle formation due to the hydrophobic portions of the interacting species, which lead them towards the air/solution interface.
The values of excess free energy of micellization, ΔGex, were calculated using eqn (13) and are tabulated in Table 3:
| | | ΔGex = [X1ln f1 + (1 − X1)ln f2]·RT | (13) |
It is clear from Table 3; values of ΔGex are quite comparable to each other for the binary mixtures of TFP + SDS/AOT/DTAB. However, for TFP + DDAB mixtures the values are very low and increase with the increase in the mole fraction of drug, which indicates that the stability of micelles increases. The average values of ΔGex are −2.27, −1.99, −1.68, −0.71 (kJ mol−1) for mixtures of TFP with SDS, AOT, DTAB and DDAB, respectively. The synergism in the mixed adsorbed monolayer formation can also be determined in terms of the thermodynamic quantity, G(s)min42 given by eqn (14):
G
(s)
min is a measure of evaluation of synergism and is defined as free energy change accompanied by transition from the bulk phase to the surface phase of solution or work needed to make an interface per mole. The low values of G(s)min for TFP + SDS/AOT/DDAB mixtures indicate that a thermodynamically stable surface is formed with synergistic interactions in accordance with their interaction parameters. However, for binary mixtures of TFP + DTAB these values are higher due to the higher values of Amin, which suggests low stability of the mixed micelles of this mixture as compared to other mixtures.
Spectroscopic methods
When studying the solubilisation of drugs in micellar solutions, information about their location, distribution and orientation in micelles is of great importance for understanding kinetic and equilibrium aspects of the solubilisation processes and the physicochemical behavior of solubilised species. Different techniques, such as UV-visible spectroscopy, NMR and fluorescence measurements have been used to determine the locus of solubilization of various solubilizates43 and for the characterization of phenothiazine based drugs in aqueous solution.44 UV-visible and fluorescence methods have been employed for the determination of the interactions between TFP and SDS/AOT/DTAB/DDAB systems. However, for these experiments the concentrations of amphiphiles studied are lower than those of micellar studies.
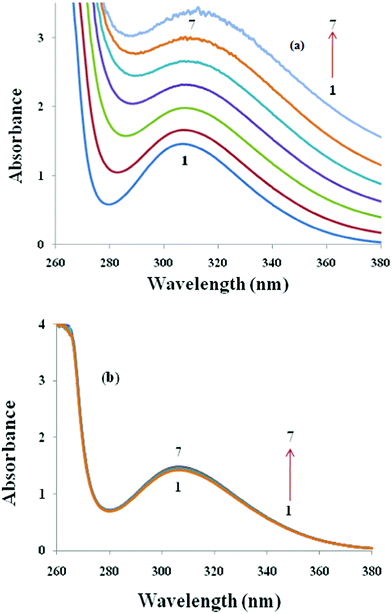
To study the interactions between TFP and ionic surfactants (SDS, AOT, DTAB and DDAB) the absorption spectra of TFP has been studied in the presence of increasing equivalents of these surfactants. It is worth mentioning here that pure surfactants do not show any peak in the UV-visible range (not shown). Fig. 5(a) and Fig. S4 (a) in the ESI† show the UV-visible spectra of TFP in the presence and absence of the anionic surfactants SDS and AOT, respectively. There is only one characteristic peak at 304 nm, which is due to the tricylic region of the antidepressant drug TFP (0.33 mM), designated as 1. On the addition of SDS and AOT (designated as 2–5), the absorption intensity of TFP increases (hyper chromic effect), which indicates the formation of a new complex between TFP and these surfactants. An insignificant red shift of 2 nm in the spectrum could not explain much about the behavior of the complex formed between the drug and anionic surfactants. So for quantitative estimation of the binding of anionic surfactants to the drug molecules the absorbance data is used in the Benesi–Hildebrand equation45,46 which is given as follows:| |  | (15) |
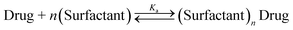
where A0, A, Amax are the absorbance in the absence of, at intermediate concentration, and at infinite concentration of surfactants, respectively, and K is the binding constant. The plot of 1/(A − A0) vs. 1/[Surfactant] gives straight lines (Fig. 6), which further indicates the formation of a 1![[thin space (1/6-em)]](https://www.rsc.org/images/entities/char_2009.gif) :1 complex between drug (TFP) and anionic surfactants (SDS and AOT). The values of the binding constant obtained from the intercept-to-slope ratio of the Bensei–Hildebrand plot (Fig. 6) are 0.126 and 0.014 × 10⁴ mol dm−3 for TFP + SDS/AOT, respectively. It is clear from the values of the binding constant that SDS shows more binding affinity towards TFP than AOT due to the less steric hindrance caused by its single chain hydrophobic group. The value of K is used to calculate the value of free energy change for this process of complexation by using the equation, ΔGK = −RTln K and these values are −17.702 and −12.366 kJ mol−1, respectively. These values are found to be negative for TFP + SDS/AOT mixtures, which indicate the spontaneity of the process of complexation. This may be due to the cationic nature of the head group of the drug molecule, which shows preferable binding to the anionic surfactants because of favourable electrostatic interactions in aqueous solution for the complex formation. However, on the addition of cationic surfactants, DTAB (Fig. 5 (b)) and DDAB (Fig. S4 (b), ESI†) to the aqueous solution of TFP, the absorbance intensity and wavelength of absorbance spectra of TFP do not show any significant change, which suggests less interactions between TFP and cationic surfactants. This could be due to the positive charge present on the head group of cationic surfactants repelling drug molecules. Hence complexation was not observed between TFP and cationic surfactants.
:1 complex between drug (TFP) and anionic surfactants (SDS and AOT). The values of the binding constant obtained from the intercept-to-slope ratio of the Bensei–Hildebrand plot (Fig. 6) are 0.126 and 0.014 × 10⁴ mol dm−3 for TFP + SDS/AOT, respectively. It is clear from the values of the binding constant that SDS shows more binding affinity towards TFP than AOT due to the less steric hindrance caused by its single chain hydrophobic group. The value of K is used to calculate the value of free energy change for this process of complexation by using the equation, ΔGK = −RTln K and these values are −17.702 and −12.366 kJ mol−1, respectively. These values are found to be negative for TFP + SDS/AOT mixtures, which indicate the spontaneity of the process of complexation. This may be due to the cationic nature of the head group of the drug molecule, which shows preferable binding to the anionic surfactants because of favourable electrostatic interactions in aqueous solution for the complex formation. However, on the addition of cationic surfactants, DTAB (Fig. 5 (b)) and DDAB (Fig. S4 (b), ESI†) to the aqueous solution of TFP, the absorbance intensity and wavelength of absorbance spectra of TFP do not show any significant change, which suggests less interactions between TFP and cationic surfactants. This could be due to the positive charge present on the head group of cationic surfactants repelling drug molecules. Hence complexation was not observed between TFP and cationic surfactants.
 |
| | Fig. 6 Benesi–Hildebrand plot (304 nm absorbance) of TFP using eqn (15), assuming 1:1 stoichiometry for association between TFP and anionic surfactants. | |
Fluorescence quenching.
A firm conclusion about the interactions between the ionic surfactants (SDS, AOT, DTAB and DDAB) and drug (TFP) requires more experimentation. So we further performed fluorescence titrations with the same solutions used for UV-visible measurements. Fig. 7(a) and Fig. S5 (a) in the ESI† shows that the addition of anionic surfactants, SDS and AOT, quenched the fluorescence emission of drug molecule (TFP) at 479 nm with a significant hypsochromic shift (shorter wavelength) when excited at a wavelength of 320 nm. The shift in wavelength was recorded as 12 nm and 17 nm, respectively, for TFP + SDS and TFP + AOT mixtures, which confirm the formation of a complex between TFP and anionic surfactants, which are non-fluorescent, causing a decrease in the fluorescence intensity of TFP. The cationic surfactants (DTAB and DDAB) did not show any significant change on the emission spectra of TFP (Fig. 7(b) and Fig. S5 (b), ESI†). This could be due to the fact that cationic surfactants and drug molecules are of a similar nature so one would not expect any significant mutual interactions between these molecules in aqueous solution. To interpret the data from fluorescence quenching studies, it is important to understand what kind of interaction exists between TFP and ionic surfactants. It is assumed that the fluorescence quenching of the drug induced by surfactant is a dynamic quenching process. Fluorescence quenching is described by the Stern–Volmer equation47 which is as follows: | | | I0/I = 1 + Kqτo[Q] = 1 + Ksv[Q] | (16) |
where I0, I, are the fluorescence intensities of TFP without and with quencher, respectively, at 479 nm. Kq is the quenching rate constant and τo is the average lifetime of TFP without quencher and its value is 10−8 s.48Ksv and [Q] are the collisional quenching constant (Stern–Volmer constant) and concentration of the quencher (here ionic surfactants act as quencher), respectively. A linear variation of I0/I versus [Q] (Fig. 8 (a)) will provide the value of Ksv and Kq for the mixtures studied and these values are presented in Table 4. In general, the maximum diffusion collision quenching rate constant of various types of biomolecules is 2.0 × 10¹⁰ mol dm−3 s−1.49 Based on the experimental data, if the quenching process is the dynamic quenching, the value of quenching rate constant must be close to 2.0 × 10¹⁰ mol dm−3 s−1 but the derived quenching rate constants are by far greater than this value. This suggests that the fluorescence quenching is the static quenching, rather than the dynamic collision quenching. Ksv values for the binary mixtures of TFP + DTAB/DDAB are of low magnitude, which confirms fewer interactions between cationic surfactants and TFP (not shown). The free energy change for the quenching process can be calculated from the equation: ΔGq = − RTln Ksv and the values are compiled in Table 4. The negative values of ΔGq assure that the process of quenching is spontaneous and favourable for the mixtures studied. It is to be noted that pure surfactants did not show any spectra in the fluorescence region selected (not shown).
 |
| | Fig. 7 Fluorescence quenching spectra of pure TFP (1) at λex = 320 nm in the presence of increasing equivalents of ionic surfactants from (2–6), (a) SDS and (b) DTAB. | |
![(a) Stern–Volmer plots of fluorescence quenching of TFP by SDS and AOT. (b) A plot of log [(I0 − I)/I] vs. log [surfactant] for SDS and AOT. (c) A plot of percentage quenching in fluorescent intensity in the presence of increasing equivalents of SDS and AOT; λex = 320 nm, λem = 479 nm.](/image/article/2012/RA/c2ra21020g/c2ra21020g-f8.gif) |
| | Fig. 8 (a) Stern–Volmer plots of fluorescence quenching of TFP by SDS and AOT. (b) A plot of log [(I0 − I)/I] vs. log [surfactant] for SDS and AOT. (c) A plot of percentage quenching in fluorescent intensity in the presence of increasing equivalents of SDS and AOT; λex = 320 nm, λem = 479 nm. | |
Table 4 Stern–Volmer quenching constants (Ksv), binding constants (Ka), number of binding sites (n) and corresponding thermodynamic parameter (ΔGq) for the binary mixtures of TFP + SDS/AOT using fluorescence techniques
|
K
sv × 10−4 (mol dm−3) |
K
a × 10−4 (mol dm−3) |
K
q × 10−10 (mol dm−3 s−1) |
n
|
R
|
ΔGq (kJ mol−1) |
| TFP + SDS |
| 0.1621 |
9.240 |
16.21 |
1.523 |
0.9998 |
−18.321 |
| TFP + AOT |
| 0.1880 |
0.907 |
18.80 |
1.213 |
0.9987 |
−18.687 |
For the static quenching process, under the assumption that molecules (surfactant) interact independently with a set of equivalent sites on a biomolecule (Drug) and form a structure [(surfactant)n Drug], the following equilibrium should be reached:
When the system achieves equilibrium, the binding constant can be written as:
| | 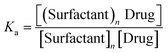 | (17) |
Here [Drug] is the concentration of TFP molecules unbounded. If the overall amount of TFP molecules (bounded and unbounded with the surfactant) is D0, thereupon [D0] = [(Surfactant)n Drug] + [Drug] and [(Surfactant)n Drug] = [D0] − [Drug], so that the above equation becomes:
| |  | (18) |
Using the spectral ratio between fluorescence intensity and the unbound drug molecule [Drug]/[D0] = I/I0 and transforming the equation,50 we obtain:
| | | log [(I0 − I)/I] = log Ka + nlog [Surfactant] | (19) |
where
n is the number of binding sites and
Ka is the apparent binding constant. The values of
Ka and
n can be obtained at the same time using a linear regression of the fitting curve of log [(
I0 −
I)/
I]
versus log [
surfactant] (
Fig. 8 (b)) and are given in
Table 4. It is clear from the values of the binding constant that mixture of TFP + SDS/AOT shows higher binding affinity whereas DTAB/DDAB
surfactants exhibit negligible binding for the
drug molecule. The binding capacity (
n) is greater than unity for TFP + SDS/AOT mixtures. However, these values in the case of TFP + cationic
surfactants are very low (not shown), indicating that DTAB and DDAB show insignificant binding affinity for TFP. The reason behind this is the same as explained above. It is to be mentioned here that the values of binding constant and binding sites differ when considered with different models.
51 So the difference in the values of binding constants obtained from fluorescence and electronic absorption techniques is justified. The percentage quenching effect
44 on the fluorescence intensity of TFP at 479 nm can be determined by using the following equation:
| | | % Quenching effect = [(I' − I)/(I' − I0)] × 100 | (20) |
where
I' is the fluorescence intensity of
water at 479 nm, which is equal to zero and other symbols have their usual meanings. The effect of increasing equivalents of ionic
surfactants versus the % Quenching effect is shown in
Fig. 8 (c). It is clear from the plots that the anionic
surfactants, SDS and AOT, are able to quench the fluorescence emission of TFP by 30.8 and 36.1%, respectively, at the 1
:
1 TFP–
surfactant ratio. The values obtained support the fact that AOT quenches the fluorescence signal more than SDS, which could be due to the presence of two hydrophobic chains, thus increases the quenching efficiency of AOT. However, for cationic
surfactants these values are very low (2–3%) which again confirms the results obtained from
UV-visible studies and other spectroscopic parameters. Also, it can be concluded that with further increase in the concentration of anionic
surfactants i.e. above one equivalent, the % Quenching values remains constant. So these values can be regarded as the maximum quenching recorded for TFP with SDS and AOT. The spectroscopic studies confirm that the anionic
surfactants prefer to bind with the
antidepressant phenothiazine drug, TFP even at very low concentrations.
Conclusions
An estimation of the interactions between the surfactants (SDS, AOT, DTAB and DDAB) and TFP is important to understand the role of these amphiphiles in biological processes. Wide applications of the methods discussed here are to be taken up in such fields, which will benefit us in gaining plentiful information concerning the interaction details. The cmc values for pure amphiphiles are found to be in good agreement with the literature values. For all the drug–surfactant mixtures studied, the cmc values decrease with the increase in the mole fraction of drug. The values of surface excess, packing parameter and cmc* have been found to decrease after the mixing of amphiphiles. The negative values of ΔGom and ΔGoads show that the micelle formation and adsorption of surfactant at the air/solution interface is energetically favourable, while a negative value of ΔGex ensures stability of the mixed micelles.
Electronic absorption spectra and fluorescence quenching methods report an enhancement in the absorbance and blue shift with the decrease in fluorescence intensity, respectively, for TFP + SDS/AOT mixtures. However, there is no effect of cationic surfactants on the absorbance and fluorescence intensity of TFP. This suggests that the anionic surfactants are more efficient in binding with TFP than cationic surfactants, even at very low concentrations. Moreover, it is well recognized that anionic surfactants demonstrate more biodegradable and less toxic behaviour than cationic ones.52,53 In conclusion, the present study indicate that anionic surfactants can act as better drug-delivery agents than cationic surfactants and hence TFP + SDS/AOT mixtures will find enormous applications in biological, medicinal and chemical fields. The value of binding constants (K, Ka) and Stern–Volmer quenching constant (Ksv) is found to be a maximum for TFP + SDS mixtures. However, the maximum %Quenching effect is reported by AOT due to the presence of two hydrophobic chains. The results indicate that among electrostatic, hydrophobic and van der Waals forces, the former ones are the predominant intermolecular forces between TFP and ionic surfactants. Moreover the knowledge of the structural features that determines the binding capacity of TFP and surfactants may open up new avenues for the design of the most suitable drug delivery systems.
This work also emphasizes the importance of development of the better mixed systems which can be frequently used for drug-delivery purposes. Hence, it is hoped that these findings will illuminate novel ways for researchers to further study in various fields by providing alterative and well-characterized systems.
Acknowledgements
Rabia Sharma thanks the Council of Scientific and Industrial Research (CSIR), New Delhi, India, for the award of Senior Research Fellowship.
References
- M. A. Cheema, M. Siddiq, S. Barbosa, P. Taboada and V. Mosquera, J. Chem. Eng. Data, 2008, 53, 368–373 CrossRef CAS
 .
.
- E. Borrego, D. Sicilia, S. Rubio and D. P. Bendito, Anal. Chim. Acta, 1998, 362, 285–297 CrossRef CAS .
- M. G. Pichel, S. Barbosa, P. Taboada and V. Mosquera, Colloid Polym. Sci., 2003, 281, 575–579 Search PubMed .
- M. J. Lawrence and G. D. Rees, Adv. Drug Delivery Rev., 2000, 45, 89–121 CrossRef CAS .
- M. Nakano, Adv. Drug Delivery Rev., 2000, 45, 1–4 CrossRef CAS .
- A. Krishnadas, I. Rubinstien and H. Onyuksel, Pharm. Res., 2003, 20, 297–302 CrossRef CAS .
- J. Watkins, A. M. Ward and T. N. Appleyard, Br. Med. J., 1997, 2, 1084–1085 CrossRef .
- K. Woodburn and D. Kessel, J. Photochem. Photobiol., B, 1994, 22, 197–201 CrossRef CAS .
- V. P. Torchilin, J. Controlled Release, 2001, 73, 137–172 CrossRef CAS .
- M. A. Rub Kabir-ud-Din and A. Z. Naqvi, J. Colloid Interface Sci., 2011, 354, 700–708 CrossRef .
- S. Schreier, S. V. P. Malheiros and E. Paula, Biochim. Biophys. Acta, Biomembr., 2000, 1508, 210–234 CrossRef CAS .
- W. Caetano, E. L. Gelamo, M. Tabak and R. Itri, J. Colloid Interface Sci., 2002, 248, 149–157 CrossRef CAS .
- W. Caetano and M. Tabak, J. Colloid Interface Sci., 2000, 225, 69–81 CrossRef CAS .
- O. G. Mouritsen and K. Jorgensen, Chem. Phys. Lipids, 1994, 73, 3–25 CrossRef CAS .
- M. Vermathaen, E. A. Louie, A. B. Chodosh, S. Ried and U. Simonis, Langmuir, 2000, 16, 210–221 CrossRef .
- N. Erdinc, S. Gokturk and M. Tuncay, Colloids Surf., B, 2010, 75, 194–203 CrossRef CAS .
- L. R. S. Barbosa, W. Caetano, R. Itri, P. Homem-de-Mello, P.S. Santiago and M. Tabak, J. Phys. Chem. B, 2006, 110, 13086–13093 CrossRef CAS .
- A. B. Khan Kabir-ud-Din and A. Z. Naqvi, Colloids Surf., B, 2010, 80, 206–212 CrossRef .
- J. Liu, A. Zou and B. Mu, Colloids Surf., B, 2010, 75, 496–500 CrossRef CAS .
- M. S. Bakshi, G. Kaur and I. Ahmad, Colloids Surf., A, 2005, 253, 1–8 CrossRef CAS .
- S. P. Moulik, M. E. Haque, P. K. Jana and A. R. Das, J. Phys. Chem., 1996, 100, 701–708 CrossRef CAS .
- R. K. Mahajan and R. Sharma, J. Colloid Interface Sci., 2011, 363, 275–283 CrossRef CAS .
- R. Sharma, A. Shaheen and R. K. Mahajan, Colloid Polym. Sci., 2011, 289, 43–51 CAS .
- R. Kaur, S. Kumar, V. K. Aswal and R. K. Mahajan, Colloid Polym. Sci., 2012, 290, 127–139 CAS .
- M. D. A. Al-Ahmadi Kabir-ud-Din, A. Z. Naqvi and M. Akram, Colloids Surf., B, 2012, 92, 16–24 CrossRef .
- N. Sharma, S. K. Jain and R. C. Rastogi, Spectrochim. Acta, Part A, 2008, 69, 748–756 CrossRef .
- J. H. Clint, J. Chem. Soc. Faraday Trans., 1975, 171, 1327–1334 Search PubMed .
- P. Mukerjee, Adv. Colloid Interface Sci., 1967, 1, 241–275 CrossRef CAS .
-
D. N. Rubingh, in Solution Chemistry of Surfactants, ed. K. L. Mittal, Plenum, New York, 1979, vol. 1 Search PubMed .
- M. J. Rosen, Prog. Colloid Polym. Sci., 1998, 109, 35–41 CrossRef CAS .
-
K. Motomura and M. Aratono, in Mixed Surfactant Systems, ed. K. Ogino and M. Abe, Dekker, New York, 1998 Search PubMed .
-
D. K. Chattoraj and K. S. Birdi, Adsorption and the Gibbs Surface Excess, Plenum, New York, 1984 Search PubMed .
- K. Anand, O. P. Yadav and P. P. Singh, Colloids Surf., 1991, 55, 359–364 CrossRef .
-
C. Tanford, The Hydrophobic Effect: Formation of Micelles and Biological Membranes, John Wiley & Sons, New York, 1980 Search PubMed .
- J. N. Israelachvili, D. J. Mitchell and B. W. Ninham, J. Chem. Soc., Faraday Trans. 2, 1976, 1, 1525–1568 RSC .
-
D. Myers, Surfactant Science and Technology, John Wiley and Sons, Inc., Hoboken, NJ, 3rd edn, 2006, Search PubMed .
-
J. N. Israelachvili, Intermolecular and Surface Forces, Harcourt Brace and Company, New York, 2nd edn, 1998 Search PubMed .
-
D. F. Evans and H. Wennerstorm, The Colloidal Domain: Where Physics, Chemistry, Biology and Technology Meets, 1994, VCH, New York Search PubMed .
- P. Somasundaran, S. Shrolri and L. Huang, Pure Appl. Chem., 1998, 70, 621–626 CrossRef CAS .
- M. J. Rosen, A. W. Cohen, M. Dahanayake and X. Y. Hua, J. Phys. Chem., 1982, 86, 541–545 CrossRef CAS .
- S. B. Sulthana, P. V. C. Rao, S. G. T. Bhat and A. K. Rakshit, J. Phys. Chem. B, 1998, 102, 9653–9660 CrossRef CAS .
- T. Oida, N. Nakashima, S. Nagadome, J.-S. Ko, S.-W. Oh and G. Sughihara, J. Oleo Sci., 2003, 52, 509–522 CrossRef CAS .
- P. Parekh, K. Singh, D. G. Marangoni and P. Bahadur, Colloids Surf., B, 2011, 83, 69–77 CrossRef CAS .
- R. K. Mahajan, S. Mahajan, A. Bhadani and S. Singh, Phys. Chem. Chem. Phys., 2012, 14, 887–898 RSC .
- Y. Shiraishi, S. Sumiya, Y. Kohno and T. Hirai, J. Org. Chem., 2008, 73, 8571–8574 CrossRef CAS .
- B. K. Paul, A. Samanta and N. Guchhait, J. Phys. Chem. B, 2010, 114, 6183–6196 CrossRef CAS .
- M. Hu, X. Wang, H. Wang, Y. Chai, Y. He and G. Song, Luminescence, 2012, 27, 204–210 CrossRef CAS .
- J. R. Lakowica and G. Weber, Biochemistry, 1973, 12, 4161–4170 CrossRef .
- S. Bi, L. Ding, Y. Tian, D. Song, X. Zhou, X. Liu and H. Zhang, J. Mol. Struct., 2004, 730, 37–45 CrossRef .
- J. Kang, Y. Liu, M. X. Xie, S. Li, M. Jiang and Y. D. Wang, Biochim. Biophys. Acta, Gen. Subj., 2004, 1674, 205–214 CrossRef CAS .
- X. L. Wei, J. B. Xiao, Y. Wang and Y. Bai, Spectrochim. Acta, Part A, 2010, 75, 299–304 CrossRef .
- N. Vlachy, C. Merle, D. Touraud, J. Schmidt, Y. Talmon, J. Heilmann and W. Kunz, Langmuir, 2008, 24, 9983–9988 CrossRef CAS .
- G. C. Kalur and S. R. Raghavan, J. Phys. Chem. B, 2005, 109, 8599–8604 CrossRef CAS .
Footnote |
| † Electronic Supplementary Information (ESI) available. See DOI: 10.1039/c2ra21020g |
|
| This journal is © The Royal Society of Chemistry 2012 |
Click here to see how this site uses Cookies. View our privacy policy here.