Magnetic particle-based immunoassay of phosphorylated p53 using protein cage templated lead phosphate and carbon nanospheres for signal amplification
Aiqiong
Chen
a,
Yuanwu
Bao†
b,
Xiaoxiao
Ge
a,
Yongsoon
Shin
c,
Dan
Du
*a and
Yuehe
Lin
*c
aKey Laboratory of Pesticides, Chemical Biology at the Ministry of Education, College of Chemistry, Central China Normal University, Wuhan 430079, P. R. China. E-mail: dudan@mail.ccnu.edu.cn (D. Du); yuehe.lin@pnnl.gov (Y. Lin)
bDMPK Department, Sundia MediTech Company, 388 Jialilue Road 9 #, Zhangjiang High-Tech Park, Shanghai, P. R. China 201203
cPacific Northwest National Laboratory, Richland, WA 99352, USA
First published on 12th September 2012
Abstract
Phosphorylated p53 at serine 15 (phospho-p5315) is a potential biomarker of gamma-radiation exposure. In this paper, we described a new magnetic particle (MP)-based electrochemical immunoassay of human phospho-p5315 using carbon nanospheres (NS) and protein cage nanoparticles (PCN) for signal amplification. Greatly enhanced sensitivity was achieved for three reasons: 1) PCN and the p5315 signal antibody (p5315 Ab2) are linked to the carbon NS (PCN-p5315 Ab2-NS) as a label; 2) PCN increases the amount of metal ions in the cavity of each apoferritin; 3) MPs capture a large amount of primary antibodies. Protein cage templated metallic phosphates, instead of enzymes, as multi-labels have the advantage of eliminating the addition of mediator or immunoreagents and, thus, makes the immunoassay system simpler. Subsequent stripping voltametric analysis, detected olead ions on a disposable screen-printed electrode. The response current was proportional to the phospho-p5315 concentration in the range of 0.02 to 20 ng mL−1 with a detection limit of 0.01 ng mL−1, which was 30-fold lower than that of the ELISA measurement of phospho-p5315. This method shows an acceptable stability and reproducibility and the assay results for phospho-p5315-spiked human serum presented good recovery rates.
1. Introduction
Protein p53 plays a vital role in controlling cell growth and modulating DNA repair processes.1–3 Loss of p53 function results in the induction of tumors and gene mutation, which is caused by a conformational change in the structure of the p53 protein.4 In response to stress, p53 undergoes rapid phosphorylation on several serine and threonine residues within the N- and C-terminal domains.5 It has been reported that phosphorylation at serine 392 may regulate the oncogenic function of mutant forms of p53 protein in breast cancer.6 A recent study reported that p53 phosphorylation at serine 15 (phospho-p5315) can lead to p53 stabilization and enhanced transactivation of p53 target genes, which is a potential biomarker of gamma-radiation exposure.7 Although enzyme-linked immunosorbent assaying (ELISA) is a powerful tool for the detection of protein and several commercial kits are available for phospho-p5315 with a very low detection limit,8 it involves several incubation and washing steps. In addition, ELISA needs expensive instruments and is lab-oriented. Therefore, the development of an inexpensive and operationally simple method to determine phospho-p5315 is of great significance.Electrochemical immunoassays combined with nanoparticle-based signal amplification strategies have attracted considerable interest and are extensively applied in the determination of proteins because of their intrinsic advantages of simplicity, portability and low cost.9,10 One of the most popular amplification strategies is the use of functionalized nanoparticles.11,12 For example, Rusling's group13,14 has achieved enhanced sensitivity for the immunodetection of prostate-specific antigen and interleukin-6 by using enzyme-functionalized carbon nanotubes (CNTs) as a label. They also developed an ultrasensitive immunosensor for a cancer biomarker by synthesizing magnetic bioconjugate particles containing 7500 enzyme labels along with detection antibodies.15 Ju and coauthors designed a novel tracer via the one-pot assembly of glucose oxidase and antibodies on gold nanoparticles for an ultrasensitive and multiplexed measurement of tumor markers.16 Our group has developed sensitive immunosensors for α-fetoprotein detection based on enzyme labeled carbon NS.17 Recently, we reported a new electrochemical immunosensor for the ultrasensitive detection of phospho-p53392 based on graphene oxide as a nanocarrier in a multienzyme amplification strategy.18 Although enzyme functionalized-conjugates amplify the responses of the immunosensors, the presence of dissolved O2 or the addition of a mediator to the detection solution is necessary.19,20 The addition of non-immunoreagents causes the immunoassay system to be more complex, increases the analytical time and increases the cost.21 To eliminate the addition of a mediator or other reagents, here we use protein cage templated metallic phosphate, instead of enzymes, as a multilabel for signal amplification.
Apoferritin, a typical protein cage, is an iron storage protein, which can store up to 4500 iron atoms in its fully saturated form; however, it more commonly holds 2000 iron atoms per apoferritin in the iron phosphate form. There are 6 hydrophobic channels and 8 hydrophilic channels connecting the outside of apoferritin with its interior.22,23 A newly developed nanoparticle has previously been used as a template to synthesize metal phosphate-apoferritin core–shell nanoparticles and used as a versatile nanoparticle-based label in electrochemical immunoassays.24 Issues to be considered with nanoparticle-based biosensors include the difficulty of making uniformly sized metal nanoparticles and the unstable nature of the linkage between the nanoparticles and the proteins. Apoferritin-templated nanoparticles overcome all of these limitations. They provide a restrained environment to produce uniformly size particles and the devices are compatible with biomolecules due to the protein cage. Here, porous carbon nanospheres (NS) were used as nanocarriers to load a large amount of metal phosphate-apoferritin for signalling.25 A “green” synthetic approach has been developed at Pacific Northwest National Laboratory (PNNL) that involves the transformation of sugars into homogeneous and stable colloidal NS, which are hydrophilic.26,27 Such NS yield homogeneous and narrow size distributions and has several binding sites for metal phosphate-apoferritin nanoparticles on each nanosphere. Although other carbon materials, such as carbon nanotubes (CNTs), can be used as labels some problems including nanotube heterogeneity and impurity need to be overcome.
In this paper, we report a novel magnetic particle (MP)-based electrochemical immunoassay of human phospho-p5315 using NS as nanocarriers and PCN in the signal amplification strategy. Greatly enhanced sensitivity is achieved for three reasons: first, PCN and p5315 signal antibody (p5315 Ab2) are linked to the NS (PCN-p5315 Ab2-NS) as a label; 2) PCN as a tag increases the amount of metal ions in the cavity of each apoferritin; 3) MPs capture a large amount of primary antibodies (Ab1) and thus amplify the detection response. Protein cage templated metallic phosphate, instead of enzymes, as multilabels for signal amplification has the advantage of eliminating the addition of mediator or other immunoreagents. This approach not only increases the sensitivity but also avoids the addition of mediator or other reagents in the detection solution.
2. Experimental section
Materials
A human phospho-p53 (S15) ELISA kit was purchased from R&D Systems Inc. Carboxyl-functionalized monodispersed magnetic particles (MPs, 5 mg mL−1) were purchased from BaseLine Chromtech (Tianjing, China). Apoferritin, bovine serum albumin (BSA), 1-ethyl-3-(3-dimethylaminopropyl) carbodiimide hydrochloride (EDC), N-hydroxysuccinimide (NHS), 2-(N-morpholino)ethanesulfonic acid (MES), phosphate buffered saline (PBS) and Tween-20 were purchased from Sigma–Aldrich. Lead nitrate and tris-HCl were acquired from Shengshi Reagent Co. (Wuhan, China). Colloidal NS was synthesized from fructose in a closed system under hydrothermal conditions as described previously26,27 and characterized by 13C solid-state nuclear magnetic resonance (NMR), Fourier transform-infrared (FT-IR) spectroscopy and electron imaging studies. The diffusion method was used to prepare PCN (magnified inset in Scheme 1) as described before24 and characterized by transmission electron microscopy (TEM). The blocking solution consisted of 1% BSA and 0.05% Tween-20. Human serum was obtained from Hubei General Hospital (Wuhan, China).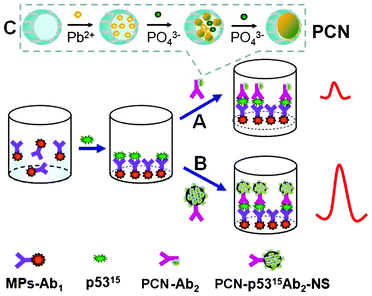 | ||
| Scheme 1 A schematic illustration of sandwich immunoassays based on different secondary antibody paths of (A) PCN-p5315Ab2 and (B) the PCN-p5315Ab2-NS conjugate. (C) Preparation of PCN based on the diffusion approach of lead ions and phosphate buffer to form a Pb3(PO4)2 core within the apoferritin shell. | ||
Apparatus
Electrochemical measurements were performed on a CHI 660C workstation (CH Instruments Co., Shanghai, China). A disposable screen-printed electrode (SPE) consisting of a carbon working electrode, a carbon counter electrode and an Ag/AgCl reference electrode were purchased from Dropsens Inc. The magnetic processing platform was from Bio-Nano Technology Co. (Shanghai, China). The electrochemical quartz crystal microbalance (EQCM) was from Ivium Technologies (Netherlands) and was composed of a QCM200 quartz crystal microbalance. Dried NS were characterized by field emission scanning electron microscopy (FE-SEM) on a JEOL-JSEM 633F. The TEM study was carried out on a Philips CM-120 electron microscope (Philips, Eindhoven, The Netherlands).Preparation of MP-p5315Ab1 conjugates
10 μL of a carboxyl-functionalized MP suspension was dispersed in 1.0 mL of 100 mM MES buffer (pH 5.2) and then mixed with 100 mM NHS and EDC solution at room temperature for 30 min under vigorous shaking. After washing and magnetic separation, 20 μL of p5315Ab1 (0.5 mg mL−1) was added to the activated MPs and incubated for 2 h at room temperature. The mixture was magnetically separated and washed three times with pH 7.4 PBS and 0.05% Tween-20. The resulting MP-p5315Ab1 conjugates were re-suspended in 1.0 mL pH 7.4 PBS with 0.1% BSA and stored at 4 °C.Preparation of PCN-p5315Ab2-NS
To generate carboxylic groups on the surfaces of the NS, 5 mg NS were refluxed in HNO3 for 10 h. The resulting dispersion was washed repeatedly with water until the pH was ∼7.0. After centrifugation at 13![[thin space (1/6-em)]](https://www.rsc.org/images/entities/char_2009.gif) 000 rpm for 5 min, the functionalized NS were mixed with 1.0 mL 400 mM EDC and 100 mM NHS in pH 5.2 MES buffer and activated for 30 min. The buffer wash was repeated to remove excess EDC and NHS. Subsequently, the resulting functionalized NS were dispersed in 1.0 mL pH 7.4 PBS and sonicated for 10 min to obtain a homogeneous dispersion. Then, 50 μL of PCN at 1.0 mg mL−1 and 50 μL of p5315Ab2 at 5.0 μg mL−1 were added to the dispersion and the mixture was stirred overnight. The mixture was washed with PBS and centrifuged at 13
000 rpm for 5 min, the functionalized NS were mixed with 1.0 mL 400 mM EDC and 100 mM NHS in pH 5.2 MES buffer and activated for 30 min. The buffer wash was repeated to remove excess EDC and NHS. Subsequently, the resulting functionalized NS were dispersed in 1.0 mL pH 7.4 PBS and sonicated for 10 min to obtain a homogeneous dispersion. Then, 50 μL of PCN at 1.0 mg mL−1 and 50 μL of p5315Ab2 at 5.0 μg mL−1 were added to the dispersion and the mixture was stirred overnight. The mixture was washed with PBS and centrifuged at 13![[thin space (1/6-em)]](https://www.rsc.org/images/entities/char_2009.gif) 000 rpm for 5 min three times and the supernatant discarded. The resulting mixture was re-dispersed in 1.0 mL pH 7.4 PBS containing 1% BSA and stored at 4 °C. In control experiments, an PCN-p5315Ab2 was prepared using avidin as a bridge to link biotin-modified p5315Ab2 to apoferritin.28
000 rpm for 5 min three times and the supernatant discarded. The resulting mixture was re-dispersed in 1.0 mL pH 7.4 PBS containing 1% BSA and stored at 4 °C. In control experiments, an PCN-p5315Ab2 was prepared using avidin as a bridge to link biotin-modified p5315Ab2 to apoferritin.28
Electrochemical immunoassay of phospho-p5315
A 25 μL sample of the MP-p5315Ab1 conjugate suspension was first mixed with 25 μL of a phospho-p5315 solution in a centrifuge tube and reacted for 50 min at room temperature. After magnetic separation and washing, 50 μL of the PCN-p5315Ab2-NS conjugate was then introduced into the tube and incubated for 30 min with gentle mixing. The supernatant was removed through repeated magnetic separation and washing. The resulting “wet-cake” complex of MP-p5315Ab1/phospho-p5315/PCN-p5315Ab2-NS stuck to the the tube wall. 10 μL 1.0 M HCl was added to the tube and mixed for 5 min to release the lead ions from the captured PCN, followed by addition of 50 μL 0.2 M acetate buffer (pH 4.6) containing 0.5 mg L−1 Bi. Then, 50 μL aliquots were transferred to the surface of the SPE, which was electrochemically pretreated via cyclic voltammetric scanning. Square wave voltammetry (SWV) measurements were carried out with an in situ-plated Bi film formed on the SPE after a 2 min accumulation at −0.9 V. Subsequent stripping was performed from −0.9 to −0.3 V with a step potential of 4 mV, an amplitude of 25 mV and a frequency of 15 Hz. A baseline correction of the resulting voltammogram was performed with CHI software. The detection limit (DL) was calculated from the 3 fold standard deviation of a blank (3σ).3. Results and discussion
3.1. Signal amplification immunoassay
The sandwich-type electrochemical immunoassay with PCN-p5315Ab2 (A) and PCN-p5315Ab2-NS (B) as labels is shown in Scheme 1. The magnified inset shows the preparation of PCN nanoparticles by a diffusion approach. Briefly, lead ions diffused into the apoferritin cavity (with negative electrostatic potential) through hydrophilic channels and accumulated on the surface of the internal cavity. When the phosphate buffer was slowly introduced into the solution, a Pb3(PO4)2 core is formed within the apoferritin shell. To enhance the detection sensitivity, we uses carbon NS as nanocarriers to enable the loading of a large amount of PCN. A greatly amplified response was achieved using PCN-p5315Ab2-NS instead of PCN-p5315Ab2. Typical electrochemical responses are shown in Fig. 1A. MP-p5315Ab1 did not show any detectable electrochemical signal on the SPE (curve a; black line). After incubation of the MP-p5315Ab1 with 5.0 ng mL−1 phospho-p5315 antigen, no obvious change in the response was observed. However, after incubation with PCN-p5315Ab2, the captured PCN was dissolved by HCl, resulting in the release of lead ions, which could be seen by the obvious stripping current at the in situ-plated Bi film-modified SPE (curve d; purple line). A significantly increased current was further observed (curve e; green lin) when PCN-p5315Ab2 was replaced with PCN-p5315Ab2-NS during the sandwich immunoreactions. It is not surprising that the enhanced signal was ascribed to a large amount of PCN loaded on the surface of the carbon NS. Furthermore, control experiments were conducted by directly exposing MP-p5315Ab1 to PCN-p5315Ab2 or PCN-p5315Ab2-NS without pre-incubation with the phospho-p5315 antigen. Small stripping currents were observed (curves b, c; blue and red lines respectively) due to the nonspecific adsorption of PCN on the magnetic particles. Although the incubation of PCN-p5315Ab2-NS (curve c) showed a much higher background signal than that of PCN-p5315Ab2 (curve b), the signal-to-noise ratio (S/N) from PCN-p5315Ab2-NS (curves e/c) was much larger than that from PCN-p5315Ab2 (curves d/b).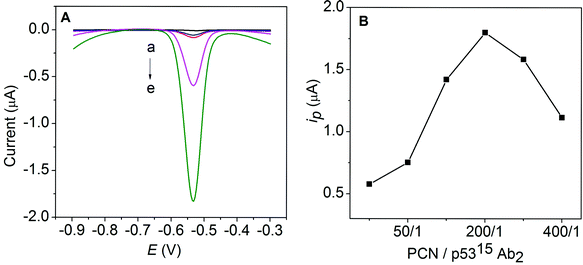 | ||
| Fig. 1 (A) Electrochemical responses of MP-p5315Ab1 (a), MP-p5315Ab1/PCN-p5315Ab2 (b), MP-p5315Ab1/PCN-p5315Ab2-NS (c), MP-p5315Ab1/phospho-p5315/PCN-p5315Ab2 (d) and MP-p5315Ab1/phospho-p5315/PCN-p5315Ab2-NS (e) on the SPE in an acetate buffer containing 0.5 mg mL−1 Bi. (B) The effect of the ratio of PCN/p5315Ab2 on the response current. | ||
The ratio of PCN and p5315Ab2 on the surface of the carbon NS is the most important factor on the response signal. As shown in Fig. 1B, one can see that the stripping current increases with an increasing ratio of PCN/p5315Ab2 and the maximum response is achieved at a ratio of 200/1. The increase of the PCN/p5315Ab2 ratio could increase the total amount of PCN loaded per NS, which is expected to enhance the response during electrochemical detection. However, the reduced amount of p5315Ab2 might decrease the immunocoupling efficiency toward the captured phospho-p53 antigen, which may result in a decreased response. Therefore, the PCN/p5315Ab2 ratio of 200/1 was selected as the optimal condition to prepare the PCN-p5315Ab2-NS conjugate.
3.2. Functionalization and characterization of carbon NS and PCN
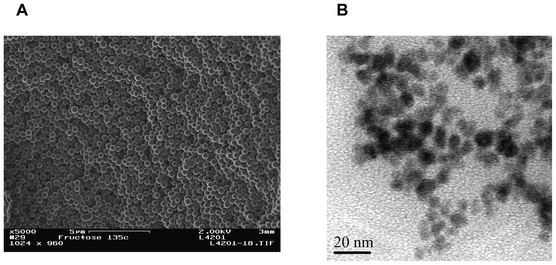
One can see from Fig. 2A that the carbon NS show a homogeneous distribution with an average diameter of 400 nm. These monodispersed carbon NS appear smooth, with a small porous structure to facilitate the loading PCN and antibody to each nanosphere. To prepare PCN core–shell nanoparticles, a diffusion approach was used. Briefly, Pb2+ diffused easily into the apoferritin cavity (with a negative electrostatic potential) through hydrophilic channels, facilitated by electrostatic force and ligand affinity for apoferritin. Then, the electrostatic potential was reversed and the phosphate anions were able to enter the apoferritin cavity. Gradually, a lead phosphate core formed within the apoferritin shell and remained stable inside apoferritin. Fig. 2B shows the TEM image of PCN on a TEM grid. One can see that individual particles are clearly identifiable with an average size of 8 nm; the dense lead phosphate cores appear black and are surrounded by an amorphous shell.3.3. Evaluation of the immunoaffinities of functionalized antibodies to phospho-p5315
QCM has been successfully developed as a dynamic and sensitive tool to monitor antibody–antigen specific recognition.29 In the current experiments, the immunoaffinities of functionalized MP-p5315Ab1 and PCN-p5315Ab2-NS to phospho-p5315 were monitored in real time based on frequency changes (Δf) (Fig. 3). Before adding the samples, the QCM was initially equilibrated with Tris-HCl for 0.5 h until a stable baseline was achieved. After adding phospho-p5315, the response of Δf decreased as expected, indicating that phospho-p5315 was recognized by MP-p5315Ab1. The second decrease of Δf was also observed after the introduction of PCN-p5315Ab2-NS due to the specific recognition between phospho-p5315 and PCN-p5315Ab2-NS. These results strongly support that the functionalized antibodies can specifically recognize their antigens and the two immunoreactions were accomplished within 50 min and 30 min, respectively.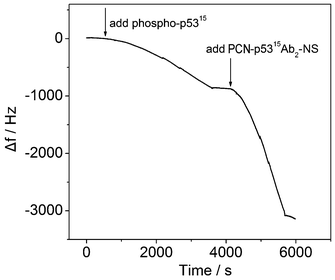 | ||
| Fig. 3 QCM responses in the immunoreactions. | ||
3.4. Optimization of the detection conditions
The incubation time of the two immunoreactions was further optimized by following the electrochemical responses. It can be seen from Fig. 4A that the stripping current increased with a increase of the incubation time and tended toward a steady value after 50 min, indicating the thorough capture of phospho-p5315 by MP-p5315Ab1 (curve a; black line). In the second immunoreaction, the current response also increased upon an increase of the incubation time and reached a plateau after 30 min, which showed saturated binding between phospho-p5315 and PCN-p5315Ab2-NS (curve b, red line, in Fig. 4A). Long incubation times could result in a larger non-specific signal. These results are in agreement with those of the QCM, discussed above.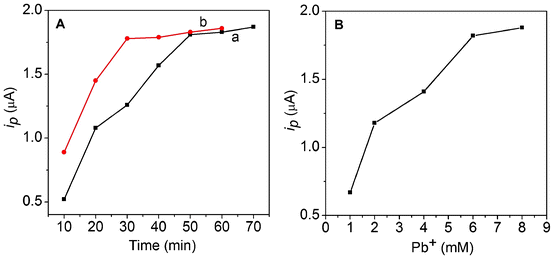 | ||
| Fig. 4 (A) Dependence of the stripping current on the incubation time of phospho-p53 (a) and PCN/p5315Ab2 (b). (B) Dependence of the stripping current on the concentration of lead nitrate. | ||
The amount of lead ions during the preparation of PCN is another factor affecting the detection signal. To achieve an optimal loading capacity of lead in the apoferritin cavity, different concentrations of lead nitrate on the immunoassay signal were studied. As shown in Fig. 4B, the current response increased with an increasing concentration of lead nitrate. The response current increased upon an increased concentrations of lead nitrate and achieved the highest signal at 6 mM lead ions. It was found that a high concentration of metal ions (>8 mM) caused the heavy aggregation of apoferritin. Thus, 6 mM lead nitrate was used in the experiments.
3.5. Electrochemical detection of phospho-p5315
After the above optimizations, the proposed amplification approach was examined with different concentrations of phospho-p5315, as shown in Fig. 5. Well defined stripping currents were observed for the lead ions and increased with an increase of the phospho-p5315 concentration. A linear response was obtained over the concentration range from 0.02 to 20 ng mL−1 with thea detection limit (DL) of 0.01 ng mL−1 (inset of Fig. 5). The calibration slope was found to be 0.58 μA mL ng−1, with a correlation coefficient of 0.9976. For comparison, we used PCN-p5315Ab2 as a reporting antibody for phospho-p5315 determination. The linear range was from 0.1 to 20 ng mL−1, with a DL of 0.1 ng mL−1. The calibration slope was found to be 0.22 μA mL ng−1, with a correlation coefficient of 0.9960. Obviously, the proposed multi-PCN labeling strategy using carbon NS as nanocarriers possesses the advantages of both high sensitivity and a wide linear range in comparison to PCN-p5315Ab2 labels in the electrochemical immunoassay. Furthermore, the phospho-p53 (S15) ELISA kit shows a linear range of 0.3–20 ng mL−1, with a DL of 0.3 ng mL−1 for phospho-p5315 determination. This amplification approach has a much lower DL than that of ELISA.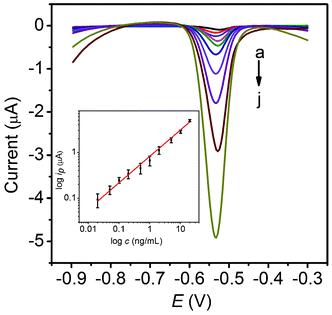 | ||
| Fig. 5 Stripping curves of MP-p5315Ab1/phospho-p5315/PCN-p5315Ab2-NS after incubation with 0.02 (a), 0.05 (b), 0.1 (c), 0.2 (d), 0.5 (e), 1.0 (f), 2.0 (g), 5.0 (h), 10 (i) and 20 (j) ng mL−1 phospho-p5315 in acetate buffer containing 0.5 mg mL−1 Bi. The inset shows the calibration curve. | ||
A series of phospho-p5315-spiked human serum samples were used to test the accuracy of the amplification approach. The results are summarized in Table 1. This shows that the recoveries were in the range of 91.0–110.2%, indicating an acceptable reliability.
| Sample No. | 1 | 2 | 3 | 4 |
|---|---|---|---|---|
| Amount added (ng ml−1) | 0.1 | 0.5 | 1.0 | 5.0 |
| Calculated (ng ml−1) | 0.091 ± 0.002 | 0.551 ± 0.003 | 1.06 ± 0.003 | 4.66 |
| Recovery (%) | 91.0 | 110.2 | 106.0 | 93.2 |
The reproducibility was evaluated by analyzing the concentrations of phospho-p5315 at the sensing platform with six replicate determinations. The coefficients of variation were 4.7% and 6.2% at 0.2 and 2.0 ng mL−1 phospho-p5315, respectively, indicating acceptable reproducibility.
4. Conclusions
In summary, we have developed a highly sensitive and selective magnetic particle-based electrochemical immunoassay of phosphorylated protein using carbon NS as nanocarriers and metal-encoded apoferritin in the signal amplification strategy. Enhanced sensitivity was achieved by not only using functionalized carbon NS to link PCN and the signal antibody at a high ratio, but also by using apoferritin to encode a large number of metal ions. Apoferritin-templated metallic phosphate, instead of enzymes, as a multilabel for signal amplification has the advantage of eliminating the addition of mediators or non-immunoreagents and, thus, makes the immunoassay system simpler. The proposed immunoassay shows excellent performance for the detection of phosphorylated protein with a wide linear range and low detection limit and acceptable stability, reproducibility and accuracy. The new encoded metallic phosphate nanoparticle tags represent a useful identification/protection method. The encoded nanoparticles also offer great promise for the determination of other proteins and as multiplex electrochemical biosensors and immunosensors.Acknowledgements
This work was supported by the National Natural Science Foundation of China (21075047) and the self-determined research funds of CCNU from the colleges' basic research and operation of MOE (CCNU11C01002). Y. Lin acknowledges the financial support by the CounterACT Program, Office of the Director, National Institutes of Health (OD) and the National Institute of Neurological Disorders and Stroke (NINDS), Grant Number U01 NS058161-01. The contents of this publication are solely the responsibility of the authors and do not necessarily represent the official views of the NIH. Pacific Northwest National Laboratory is operated by Battelle for US-DOE under Contract DE-AC05-76RL01830.References
- G. I. Evan and K. H. Vousden, Nature, 2001, 411, 342 CrossRef CAS.
- J. H. Jeong, H. Nakajima, J. Magae, C. Furukawa, K. Taki, K. Otsuka, M. Tomita, I. S. Lee, C. H. Kim and H. W. Chang, Int. J. Cancer, 2009, 124, 2797 CrossRef CAS.
- M. G. Van Oijen and P. Slootweg, J. Clin. Cancer Res., 2000, 6, 2138 CAS.
- E. Appella and C. W. Anderson, Eur. J. Biochem., 2001, 268, 2764 CrossRef CAS.
- T. Minamoto, T. Buschmann, H. Habelhah, E. Matusevich, H. Tahara, A. L. Boerresen-Dale, C. Harris, D. Sidransky and Z. Ronai, Oncogene, 2001, 20, 3341 CrossRef CAS.
- D. B. S. Yap, J. K. Hsieh, S. Zhong, V. Heath, B. Gusterson, T. Crook and X. Lu, Cancer Res., 2004, 64, 4749 CrossRef CAS.
- A. Tichy, D. Zaškodova, F. Zoelzer, J. Vavrova, Z. Šinkorova, J. Pejchal, J. Osterreicher and M. Řezačova, Folia Biologica., 2009, 55, 41 CAS.
- M. L. Cox and D. W. Meek, Cell. Signalling, 2010, 22, 564 CrossRef CAS.
- J. Wu, Z. Fu, F. Yan and H. Ju, TrAC, Trends Anal. Chem., 2007, 26, 679 CrossRef CAS.
- D. Du, S. Chen, D. Song, H. Li and X. Chen, Biosens. Bioelectron., 2008, 24, 475 CrossRef CAS.
- Y. Wu, C. Chen and S. Liu, Anal. Chem., 2009, 81, 1600 CrossRef CAS.
- S. Xu, Y. Liu, T. Wang and J. Li, Anal. Chem., 2011, 83, 3817 CrossRef CAS.
- X. Yu, B. Munge, V. Patel, G. Jensen, A. Bhirde, J. D. Gong, S. N. Kim, J. Gillespie, J. S. Gutkind, F. Papadimitrakopoulos and J. F. Rusling, J. Am. Chem. Soc., 2006, 128, 11199 CrossRef CAS.
- R. Malhotra, V. Patel, J. P. Vaque, J. S. Gutkind and J. F. Rusling, Anal. Chem., 2010, 82, 3118 CrossRef CAS.
- V. Mani, B. V. Chikkaveeraiah, V. Patel, J. S. Gutkind and J. F. Rusling, ACS Nano, 2009, 3, 585 CrossRef CAS.
- G. Lai, F. Yan and H. Ju, Anal. Chem., 2009, 81, 9730 CrossRef CAS.
- D. Du, Z. Zou, Y. S. Shin, J. Wang, H. Wu, M. H. Engelhard, J. Liu, I. A. Aksay and Y. Lin, Anal. Chem., 2010, 82, 2989 CrossRef CAS.
- D. Du, L. Wang, Y. Shao, J. Wang, M. H. Engelhard and Y. Lin, Anal. Chem., 2011, 83, 746 CrossRef CAS.
- D. Du, F. Yan, S. Liu and H. Ju, J. Immunol. Methods, 2003, 283, 67 CrossRef CAS.
- G. Liu, Z. Wu, S. Wang, G. Shen and R. Yu, Anal. Chem., 2001, 73, 3219 CrossRef CAS.
- Z. Dai, F. Yan, J. Chen and H. Ju, Anal. Chem., 2003, 75, 5429 CrossRef CAS.
- M. Li, C. Viravaidya and S. Mann, Small, 2007, 3, 1477 CrossRef CAS.
- H. Wu, M. H. Engelhard, J. Wang, D. R. Fisher and Y. Lin, J. Mater. Chem., 2008, 18, 1779 RSC.
- G. Liu, H. Wu, A. Dohnalkova and Y. Lin, Anal. Chem., 2007, 79, 5614 CrossRef CAS.
- D. Du, A. Chen, Y. Xie, A. Zhang and Y. Lin, Biosens. Bioelectron., 2011, 26, 3857 CrossRef CAS.
- Y. S. Shin, I. T. Bae, B. W. Arey and G. J. Exarhos, J. Phys. Chem. C, 2008, 112, 4844 CAS.
- C. Yao, Y. S. Shin, L. Q. Wang, C. F. Windisch, W. D. Samuels, B. W. Arey, C. Wang, W. M. Risen and G. J. Exarhos, J. Phys. Chem. C, 2007, 111, 15141 CAS.
- J. L. Guesdon, T. Ternynck and S. Avrameas, J. Histochem. Cytochem., 1979, 27, 1131 CrossRef CAS.
- D. M. Kim, M. A. Rahman, M. H. Do, C. Ban and Y. B. Shim, Biosens. Bioelectron., 2010, 25, 1781 CrossRef CAS.
Footnote |
| † These authors contributed equally to this work. |
| This journal is © The Royal Society of Chemistry 2012 |

