Single-component fuel cells fabricated by spark plasma sintering†
Marian
Stingaciu
a,
Bin
Zhu
*b,
Manish
Singh
c and
Mats
Johnsson
a
aDepartment of Materials and Environmental Chemistry, Stockholm University, SE-106 91 Stockholm, Sweden
bDepartment of Energy Technology, Royal Institute of Technology, KTH Stockholm, SE- 10044 Sweden. E-mail: bin.zhu@energy.kth.se
cGETT Fuel Cell AB, Stora Nygatan 33, S-10314, Stockholm, Sweden
First published on 9th October 2012
Abstract
Porous single-component fuel cells, made up of a single layer of mixed ionic and electronic conductivity, have been fabricated using spark plasma sintering (SPS) and their performances were tested in methanol. It was possible to optimize the current/power output by changing the sintering conditions which directly influence the grain size, porosity, grain contacts and conducting paths for the fabricated cells.
Solid oxide fuel cells (SOFCs) are considered to be the next generation in energy conversion devices which convert chemical energy into electricity without the emission of toxic gases. Initially, electrolyte fuel cells were operational around 1000 °C where a high ionic conductivity of 0.1 S cm−2 was achieved, using yttrium stabilized zirconia (YSZ) as an electrolyte.1 Although YSZ has been considered one of the most reliable electrolyte materials for SOFCs, many efforts have been made in finding new alternatives to YSZ.2,3 The research and development has been focused mainly on lowering the operating temperature. In order to reduce the operating temperature of a SOFC, an electrolyte possessing superior oxygen ion conductivity at lower temperatures is required.4 Different types of materials like cerium oxide, bismuth oxide or perovskites have been considered as possible candidates.5–7 These structures allow formation of a large number of oxygen vacancies by doping, leading to an increased ionic conductivity at intermediate temperatures. Recently,8 a samarium doped CeO2–Na2CO3 composite has been investigated and found to be superior to doped Bi2O3 and doped CeO2 at operating temperatures below 600 °C. A samarium doped CeO2–Na2CO3 composite is a mixed proton- and ionic conductor as the composite structure allows both oxygen ions to transfer through CeO2 and proton transfer through the interface between CeO2 and carbonate.9 Integrating catalytic properties and semiconductivity in the same composite material has been used as an energy conversion device consisting of a single-component which can work like a more traditional three component fuel cell.10,11 This novel single component device design removes the electrolyte layer by using only a single homogeneous multifunctional nanocomposite layer without “macroscopic” layered electrolyte, or anode and cathode constructions but provides the same function and performance. It was selected as a research highlight by Nature Nanotechnology (ref. 12) in the article entitled “Three in one”. So far the work on single component fuel cells has been focused mainly on the synthesis and development of new candidate materials13,14 and little work has been devoted to new fabrication techniques.
In the present work we introduce SPS as a suitable method for the fabrication of single-component fuel cells (see the ESI† for more details). The technique is fast, reliable, simple and it is possible to optimise the sintering parameters in order to apply the technique on different types of materials; structural ceramics,15–17 bioceramics,18,19 magnetoelectric composites,20 nuclear fuels21 or different functional materials e.g. thermoelectrics,22 ferroelectric/piezoelectric materials,23 permanent magnets.24 In the field of conventional three component fuel cells the SPS technique has previously been applied to sinter highly dense YSZ- or CeO2 based electrolyte materials25,26 which provide higher ionic conductivity compared to pressure less sintered electrolytes.27 Due to the use of a pulsed DC-current through the electrodes, punches and the graphite die a decrease in the sintering temperature is achieved as well as a considerable shortening of the sintering time compared with e.g. conventional hot pressing. These aspects are very important especially when a desired microstructure for the fabricated cells needs to be controlled and especially on single-component cells where a controlled grain size and porosity is essential in order to obtain the highest power density. To our knowledge this is the first study on single-component fuel cells that is devoted to finding the correlation between microstructure and cell performance in a controlled manner. Reproducible results on single-component fuel cells are very important for further fundamental studies. It should be pointed out that the desired microstructure in a single-component fuel cell is different from the one in a conventional three component device. In the latter a completely dense electrolyte compatible with porous anode and cathode materials is needed, while in the single-component fuel cell there is only one porous component/layer. How a single porous component/layer and its microstructure affects the device performance is a key factor and this deserves further study in order to understand the mechanisms behind the single component fuel cell and to further improve the device performance.
In this work the influence of the SPS sintering parameters, e.g. temperature and applied pressure, on the performance of single-component fuel cells was studied. The present work is also the first to report single component fuel cells operated by a liquid fuel (methanol).
A samarium doped CeO2–Na2CO3 composite was used as the ionic conducting material and the preparation is described elsewhere.8 The electron conductor material is a mixture of several metal oxides Li2xZn1-xO–NiO–SrO–CuO in the molar ratio 1![[thin space (1/6-em)]](https://www.rsc.org/images/entities/char_2009.gif) :2:1:2 prepared by a solid state reaction by mixing Li2CO3, Zn(NO3)2, NiCO3·2Ni (OH)2·6H2O, SrNO3, CuCO3, and Cu(OH)2 (all from Sigma-Aldrich) followed by subsequent calcination at 800 °C for 4 h. Finally, the ionic and electron conducting materials were mixed in deionized water containing citric acid (see the ESI† for more details).
:2:1:2 prepared by a solid state reaction by mixing Li2CO3, Zn(NO3)2, NiCO3·2Ni (OH)2·6H2O, SrNO3, CuCO3, and Cu(OH)2 (all from Sigma-Aldrich) followed by subsequent calcination at 800 °C for 4 h. Finally, the ionic and electron conducting materials were mixed in deionized water containing citric acid (see the ESI† for more details).
The starting powder mixture was loaded into a graphite die and subjected to sintering using SPS apparatus (model Dr Sinter 2050, SPS Syntex Inc., Japan). A K-type thermocouple inserted in the graphite die was used for temperature regulation. For each fabricated SPS sample an amount of about 0.80 g of sample was used and loaded into a 20 mm diameter graphite die. Both sides of the loaded sample were covered by silver coated meshes which play the role of current collectors. To obtain a good flatness of the sintered samples, stainless steel plates were used as separators between the meshes and graphite punches. The entire assembly was then sintered under vacuum (4 Pa) by heating to the plateau temperature in the range 400–700 °C with a heating rate of 50 °C min−1. Pressure was applied on the way up to the plateau temperature during sintering and kept there for 5 min under 25 MPa. A separate series was made where the uniaxial pressure was varied in the range 10–50 MPa at a plateau of 550 °C.
The X-ray diffraction pattern of the as prepared powder mixture is shown in Fig. 1. A number of oxides can be identified: CeO2, Li1-xZnxO, CuO and NiO. Also, diffraction patterns of the SPS sintered materials obtained at 400, 550 and 700 °C are shown in the same figure. There are no changes observed in the phase composition of the SPS materials compared to the as-prepared powder indicating that no chemical reactions between the different constituents took place during sintering.
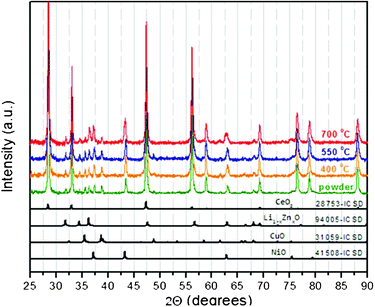 | ||
| Fig. 1 X-Ray diffraction patterns of the as-prepared powder and fabricated cells after SPS sintering at 400, 550 and 700 °C, respectively. In the lower part of the figure the Inorganic Crystal Structure Database (ICSD) references for the different oxides are given. | ||
Fuel cells having a diameter of 20 mm and thickness of 0.8–1 mm were produced. Cross section SEM micrographs of the fuel cell fabricated at 550 °C are shown in the ESI.† Seven different sintering temperatures in the range 400–700 °C were tested. The microstructures of the cells fabricated at various temperatures A, B and C are shown in Fig. 2(a)–(c).
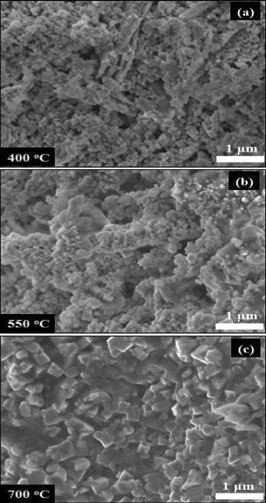 | ||
| Fig. 2 SEM images showing the morphology of the fuel cells sintered at different temperatures for 5 min at 25 MPa: (a) cell A, (b) cell B and (c) cell C. | ||
In order to avoid the confusion between the SPS sintering temperature and testing temperature of the fabricated cells the following notations were chosen: A = SPS at 400 °C/25 MPa/5 min, B = SPS at 550 °C/25 MPa/5 min, C = SPS at 700 °C/25 MPa/5 min. The cells sintered at the lower temperatures A and B show no obvious grain growth or apparent change in the microstructure and contain very fine particles in the range 50–120 nm after sintering. However, for cell C a marked reduction in porosity and a substantial grain growth are observed with an increase in particle size up to 300 nm, see Fig. 2 (c).
Porosities of the cells A, B and C were evaluated by means of mercury porosimetry using a Micromeritics Autopore III porosimeter and the results are given in Table 1. The total intrusion volume decreases with the increasing sintering temperature of the cells which can be directly related to the change in the porosity. The average pore diameter is much smaller for cell A compared to cell B indicating that the pore system is at a very fine scale at lower sintering temperatures and the smallest pores will disappear when increasing the sintering temperature to the conditions for cell B, subsequently only the larger pores important for mass transport are left. The small pore system in cell A may result in the fuel getting trapped in the cell. It was also observed that cell A is much more brittle than the other cells due to the low sintering temperature that results in a poorly sintered material. The results show that an optimised microstructure, e.g. particle- and pore size have significant effect on device performances.
| SPS sintering T/°C | Total intrusion volume/ml g−1 | Total pore area/m2 g−1 | Average pore diameter/μm | |
|---|---|---|---|---|
| A | 400 | 0.21 | 3.03 | 0.27 |
| B | 550 | 0.11 | 1.80 | 5.67 |
| C | 700 | 0.00 | 0 | — |
Typical I (current) − V (voltage) characteristics together with power density measured at 550 °C for the cells A, B and C are shown in Fig. 3. An open circuit voltage in the range 0.85–0.9 V was observed for all tested cells. It can also be seen that a maximum power density with the smallest voltage losses was obtained at a current density of 0.4 A cm−2 for the cell A. A more complete representation of the maximum power density and cell voltage dependence on the SPS sintering temperature is shown in Fig. 4(a) for cells measured at 550, 520 and 500 °C using air as oxidant and methanol as fuel. It is observed that the power density increases when the operating temperature increases. Among the tested cells the highest power density of ∼204 mW cm−2 was obtained at an operating temperature of 550 °C for cell B. The difference in power density between the cells fabricated at different temperatures can be attributed mainly to the microstructure characteristics. A sintering at lower temperature, e.g. cell A resulted in weaker connections in between the particles which leads to a poorer conducting path thus lowering the power outputs. When a higher sintering temperature was used for cell C a significant loss in porosity accompanied by a coarsening and grain growth was observed, which results in a big loss for the particle grains contact and conducting paths as well as a big decrease of the porous structure. This showed a 60% loss of the cell power delivery compared with cell B which shows the best performance due to both maximized particle contacts and optimized contact paths that can enhance the conduction and power output correspondingly. The pressure dependence of the maximum power density for the cell tested at 500, 520 and 550 °C is shown in Fig. 4(b). The maximum power density of ∼205 mW cm−2 was found for the cell sintered at 550 °C under an applied pressure of 35 MPa. A decrease in the output power density was observed when the applied pressure decreased down to 10 MPa where a value of ∼180 mW cm−2 was noted. This slight difference in the cell performance with the different applied pressure can be related also to the microstructure characteristics where a balance between porosity and grain size has to be found in order to improve the output power density.
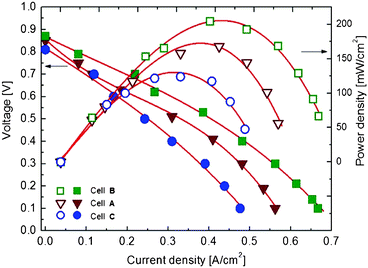 | ||
| Fig. 3 The power density of single-component fuel cells A, B and C. | ||
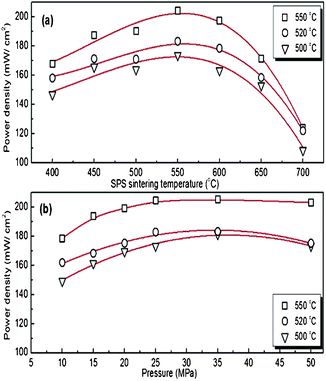 | ||
| Fig. 4 Performance of single component fuel cells measured at 500, 520 and 550 °C, respectively. (a) Influence of SPS sintering temperature at an applied pressure of 25 MPa. (b) Influence of applied pressure during SPS sintering at 550 °C. | ||
In conclusion, single-component fuel cells containing samarium doped CeO2–Na2CO3 as ionic material and a mixture of metal oxides Li2xZn1-xO–NiO–SrO–CuO as electronic conductor were fabricated by SPS and their performances were tested in methanol and air as fuel and oxidant. Sintering temperatures in the range 400–700 °C and different applied pressures 10–50 MPa were tested. The measurement at a working temperature of 550 °C showed that a cell fabricated at 550 °C/25 MPa exhibits a higher power density, ∼204 mW cm−2, compared with those sintered at either higher or lower temperatures. A cell sintered at 700 °C did show e.g. ∼125 mW cm−2; a decrease of about 60% in power density. The SPS pressure applied during the cell fabrication does not show significant effects on the fabricated cell performances. However, the maximum power density values of the fabricated cell was ∼205 mW cm−2 obtained at a current density of 0.4 A cm−2 for the cell sintered at 35 MPa and tested at 550 °C. Based on the present results we are confident that our initial efforts in fabricating single-component fuel cells show their great potential and that the cell performance can be improved in future studies. In fact, already at this stage, our reported power density values for single-component fuel cells fabricated by SPS, tested at 550 °C and operated by methanol are in general comparable28,29 or much higher,30–32 however, not the best33 compared to values reported on three component cells. The high values for single-component cells are mainly related to the use of nanosized particles in the composites where the ionic conduction takes place and is enhanced at the grain boundaries.34 Indeed by the absence of electrodes additional problems such as interface compatibility, interface resistance or high ohmic resistance are overcome. Nevertheless, it is also clear from the experiments that optimizing the microstructure plays an important role in order to get good cell performance and there is a balance to reach between porosity and grain size. A good porous microstructure was obtained for the cells fabricated at temperatures in the range 500–600 °C while further temperature increase resulted both in reduced porosity and severe grain growth.
Fuel cells based on the single-component concept have been fabricated for the first time using the advantages of SPS which allows a simple, fast and inexpensive way to obtain fuel cells in one single step at relatively low sintering temperatures. The fabricated cells were operated by methanol used as a liquid fuel and the reported results show good power density values at low working temperatures. The use of methanol in the field of fuel cell technology should be preferable compared to e.g. hydrogen in order to lower the costs for production, storage and transport, however it may not yield the highest current density.35 The single component fuel cells reported can be made in one blending step and one sintering step reducing the fabrication costs making them applicable for industrial purposes. In this work the results were obtained on cells fabricated with a lab scale SPS machine. However, bigger samples can be made with a SPS designed for production that is an available technology for the upscaling of composites with a designed microstructure.
Acknowledgements
This work has been carried out through financial support from the Berzelii Centre EXSELENT on porous materials and GETT Fuel Cells International AB. The VINNOVA and VR (Contract No. 621-2011-4983) financial support from KTH research is highly acknowledged. Arto Ojuva is acknowledged for the help provided with the mercury porosimetry measurements.References
- B. C. H. Steel and A. Heinzel, Nature, 2001, 414, 345–352 CrossRef.
- J. Maier, Nat. Mater., 2005, 4, 805–815 CrossRef CAS.
- A. S. Arico, P. Bruce, B. Scrosati, J. Tarascon and W. van Schalkwijk, Nat. Mater., 2005, 4, 366–377 CrossRef CAS.
- J. B. Goodenough, Nature, 1999, 404, 821–823 CrossRef.
- T. Inoue, T. Setoguchi, K. Eguchi and H. Arai, Solid State Ionics, 1989, 35, 285–291 CrossRef CAS.
- A. M. Azad, S. Larose and S. A. Akbar, J. Mater. Sci., 1994, 29, 4135–4151 CrossRef CAS.
- Y. Takeda, H. Ueno, N. Imanishi, O. Yamamoto, N. Sammes and M. B. Phillipps, Solid State Ionics, 1996, 86–88, 1187–1190 CrossRef CAS.
- X. D. Wang, Y. Ma, R. Raza, M. Muhammed and B. Zhu, Electrochem. Commun., 2008, 10, 1617–1620 CrossRef CAS.
- W. Xiaodi, Y. Ma, S. Li, A. H. Kashyout, B. Zhu and M. Muhammed, J. Power Sources, 2011, 196, 2754–2758 CrossRef.
- B. Zhu, R. Raza, G. Abbas and M. Singh, Adv. Funct. Mater., 2011, 21, 2465–2469 CrossRef CAS.
- B. Zhu, R. Raza, H. Qin, Q. Liu and L. Fan, Energy Environ. Sci., 2011, 4, 2986–2992 CAS.
- Research Highlights, Nature Nanotechnology, 2011, 6, 330 Search PubMed.
- B. Zhu, H. Qin, R. Raza, Q. Liu, L. Fan, J. Patakangas and P. Lund, Int. J. Hydrogen Energy, 2011, 36, 8536–8541 CrossRef CAS.
- Y. Xia, X. Liu, Y. Bai, H. Li, X. Deng, X. Niu, X. Wu, D. Zhou, M. Lv, Z. Wang and J. Meng, RSC Adv., 2012, 2, 3828–3834 RSC.
- L. Gao, Z. Shen, H. Miyamoto and M. Nygren, J. Am. Ceram. Soc., 1999, 82, 1061–1063 CrossRef CAS.
- Z. Shen, M. Johnsson, Z. Zhao and M. Nygren, J. Am. Ceram. Soc., 2002, 85, 1921–1927 CrossRef CAS.
- L. An, A. Ito and T. Goto, J. Eur. Ceram. Soc., 2012, 32, 3097–3102 CrossRef CAS.
- C. Drouet, C. Largeot, G. Raimbeaux, C. Estournès, G. Dechambre, C. Combes and C. Rey, Adv. Sci. Technol., 2006, 49, 45–50 CrossRef CAS.
- F. Zhang, K. Lin, J. Chang, J. Lu and C. Ning, J. Eur. Ceram. Soc., 2008, 28, 539–545 CrossRef CAS.
- M. Stingaciu, R. K. Kremer, P. Lemmens and M. Johnsson, J. Appl. Phys., 2011, 110, 044903 CrossRef.
- S. Yeo, E. Mckenna, R. Baney, G. Subhash and J. Tulenko, J. Nucl. Mater., 2012 DOI:10.1016/j.jnucmat.2012.09.015.
- L. Zhang, T. Tosho, N. Okinaka and T. Akiyama, Mater. Trans., 2007, 48, 2088–2093 CrossRef CAS.
- T. Hungria, J. Galy and A. Castro, Adv. Eng. Mater., 2009, 11, 615–631 CrossRef CAS.
- M. Yue, P. L. Niu, J. X. Zhang and D. T. Zhang, IEEE Trans. Magn., 2006, 42, 2894–2896 CrossRef CAS.
- K. A. Khor, X. J. Chen, S. H. Chan and L. G. Yu, Mater. Sci. Technol., 2004, A366, 120–126 CAS.
- K. Choi, W. Tong, R. D. Maiani, D. E. Burkes and Z. A. Munir, J. Nucl. Mater., 2010, 404, 210–216 CrossRef CAS.
- X. J. Chen, K. A. Khor, S. H. Chan and L. G. Yu, Mater. Sci. Eng., 2003, A341, 43–48 CAS.
- M. Liu, R. Peng, D. Dong, J. Gao, X. Liu and G. Meng, J. Power Sources, 2008, 185, 188–192 CrossRef CAS.
- Y. Jiang and A. V. Virkar, J. Electrochem. Soc., 2001, 148, A706–A709 CrossRef CAS.
- L. Sun, Y. Hao, C. Zhang, R. Ran and Z. Shao, Int. J. Hydrogen Energy, 2010, 35, 7971–7981 CrossRef CAS.
- M. Sahibzada, B. C. H. Steele, K. Hellgardt, D. Barth, A. Effendi, D. Mantzavinos and I. S. Metcalfe, Chem. Eng. Sci., 2000, 55, 3077–3083 CrossRef CAS.
- D. J. L. Brett, A. Atkinson, D. Cumming, E. Ramírez-Cabrera, R. Rudkin and N. P. Brandon, Chem. Eng. Sci., 2005, 60, 5649–5662 CrossRef CAS.
- V. Baglio, A. Stassi, F. V. Matera, V. Antonucci and A. S. Aricò, Electrochim. Acta, 2009, 54, 2004–2009 CrossRef CAS.
- B. Zhu, Int. J. Energy Res., 2009, 33, 1126–1137 CrossRef CAS.
- B. Zhu, R. Raza, Q. Liu, H. Qin, Z. Zhu, L. Fan, M. Singh and P. Lund, RSC Adv., 2012, 2, 5066–5070 RSC.
Footnote |
| † Electronic Supplementary Information (ESI) available. See DOI: 10.1039/c2ra20829f |
| This journal is © The Royal Society of Chemistry 2012 |