Large-scale stereoscopic structured heazlewoodite microrod arrays and scale-like microsheets for lithium-ion battery applications
Liwei
Mi
*ab,
Qi
Ding
ac,
Weihua
Chen
*c,
Zhi
Zheng
a,
Hongwei
Hou
c,
Chuntai
Liu
b and
Changyu
Shen
*b
aKey Laboratory for Micro-Nano Energy Storage and Conversion Materials of Henan Province, Institute of Surface Micro and Nano Materials, Xuchang University, Henan 461000, P. R. China. E-mail: mlwzzu@163.com; Fax: +86-374-2968784; Tel: +86-374-2968784
bNational Engineering and Research Center for Advanced Polymer Processing Technology, Zhengzhou University, Henan 450001, P. R. China. E-mail: shency@zzu.edu.cn
cDepartment of Chemistry, Zhengzhou University, Henan 450001, P. R. China. E-mail: chenweih@zzu.edu.cn
First published on 28th June 2012
Abstract
Large-scale stereoscopic structured heazlewoodite (Ni3S2) microrod arrays and scale-like microsheets were successfully prepared by a facile and environmentally benign approach, in which deionized water and ethanol were used as the environmentally friendly solvent. Uniform bamboo shoot-like Ni3S2 microrods and scale-like Ni3S2 microsheets were distributed evenly at the surface of a porous three-dimensional nickel substrate. Studies found that the growth process of Ni3S2 is dependent on the reaction temperature and solution polarity. An increase in reaction temperature could achieve a rod structure while an increase in solution polarity could obtain a denser structure. Due to the large surface area and regular morphology, the stereoscopic structured Ni3S2 microrod arrays and scale-like Ni3S2 microsheets were employed as cathode materials for lithium-ion batteries, and the initial discharge capacity of Ni3S2 microrod arrays reached 592 mA h g−1.
Introduction
The demand for renewable and clean energy has been rapidly increasing because of climate change and environmental degradation.1–5 As a new alternative energy, the lithium-ion battery has been widely used for portable electronic devices, electric vehicles and other fields, due to its light weight, high energy density, long cycling capability, and lack of memory effect.6,7 However, traditional electrode materials cannot meet power supply requirements because of their low capacity and their inability to conduct electricity well.8–10 The capacity of lithium-ion batteries is limited by the size, shape, morphology, and crystal structure of such materials. To some extent, their capacity can be effectively enhanced through the controlled synthesis of lithium-ion battery materials with a specific structure and morphology. At present, the controlled synthesis of nano- or micromaterials with specific morphologies remains a challenge in solid-state chemistry.Nowadays, transition metal sulfides are employed as cathodes for high-capacity lithium-ion batteries because of their high theoretical capacity and low cost. Nickel sulfide (Ni3S2), one of the most important transition metal sulfides, has received huge interest among researchers in recent decades because of its numerous applications in magnetism,11 photology,12 catalysis,13 and electrochemistry.14 Used in the lithium battery system, nickel sulfide has a variety of advantages. For one thing, the resources of elementary substance nickel (Ni) and sulfur (S) are of low cost, and nickel sulfide with a micro- or nanostructure is easy to prepare. Moreover, the room temperature resistivity of single crystalline Ni3S2 is about 1.8 × 10⁻⁵ Ω cm, which is much lower than that of the polycrystal (1.1 × 10⁻³ Ω cm),15 and can lead to ease of transportation for electrons and lithium ions. Ni3S2 materials also have a high theoretical capacity and a high rate of charge and discharge performance.
Besides their chemical composition, the size, structure, and morphology of electrode materials also play a vital role in their electrochemical behavior. One-dimensional (1D) nanomaterials have a stable structure and satisfactory flexibility during charge and discharge, resulting in a higher capacity and a better cycle performance. For example, SrSnO3 nanorods exhibited better recyclability over 50 cycles, with a reversible lithium storage capacity of 200 mA h g−1, than SrSnO3 nanoparticles.16 V2O5 micro/nanotubes were prepared by Yin et al. and used as a cathode material for lithium-ion batteries, which exhibited great improvement in their electrochemical performance.17 Meanwhile, because of their large specific surface area, two-dimensional (2D) nanomaterials also exhibit a good electrochemical performance. The ordered nanostructures of Co(OH)2 nanosheets and cobalt oxide nanowall arrays on reduced graphene oxide sheets show excellent electrochemical performance.18,19 A stereoscopic three-dimensional (3D) electrode with a porous structure is also believed to increase the number of reactive sites of electrode/electrolyte contact area and ease volume expansion of the active materials further in the charge and discharge processes.
Based on the above information, scale stereoscopic structured heazlewoodite (Ni3S2) microrod arrays and scale-like microsheets were designed and synthesized via a facile and environmentally benign solvothermal technique. Absolute ethyl alcohol and deionized water were used to make mixed solvents. The morphology and structure of Ni3S2 products could be achieved by adjusting the polarity of the solution, reaction time, and reaction temperature. The growth process of nickel sulfide could be successfully controlled by changing the reaction conditions, such as reaction temperature, solvents, and reaction times. The probable growth mechanism of the products was discussed in detail in this paper. Finally, the stereoscopic structured Ni3S2 was used as a cathode material for lithium-ion batteries through charge–discharge tests.
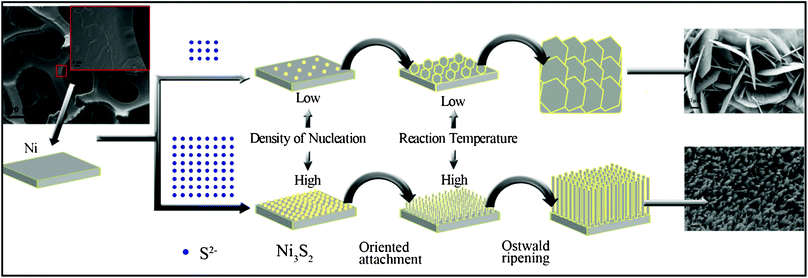 | ||
| Scheme 1 Schematic diagram of the morphological evolution of crystalline Ni3S2 grown in situ on a porous nickel substrate. | ||
Experiment
Synthesis and processing
All chemical reagents in this work were analytical grade and were used without further purification. Uniform bamboo shoot-like Ni3S2 microrod arrays (Ni3S21) were prepared by a typical solvothermal method. In this reaction, a piece of clean nickel foam (0.0280 g), ethyl alcohol (12 mL), deionized water (4 mL), and thiourea (0.0726 g) were placed in a 25 mL Teflon-lined autoclave. The autoclave was sealed, heated to 160 °C and kept for 24 h, and then left to cool naturally. The end products were collected and washed several times using deionized water and ethyl alcohol, and then dried in a vacuum at 70 °C for 6 h. In addition, the synthesis method of hierarchical microsheets Ni3S22 is similar to that of Ni3S21; the difference is the change in solution composition and reaction temperature. For Ni3S22, the mixed solvents utilized were 1 mL deionized water and 15 mL ethyl alcohol. The reaction temperature was 120 °C. The chemical reaction equations for this solvothermal fabrication process may be expressed as follows:| (NH2)2CS + 2H2O→H2S + CO2 + 2NH3 | (1) |
| 2H2S + 3Ni→Ni3S2 + 2H2 | (2) |
To control the synthesis of end products with a specific morphology, a series of contrasting experiments with different reaction times, reaction temperatures, and solution polarities was designed (Scheme 1).
The Ni3S23 and 4 were prepared with the same reaction time and solution composition as for Ni3S21; only the reaction temperatures were different. The reaction temperatures of Ni3S23 and 4 were 140 °C and 160 °C, respectively. Three other samples of Ni3S25, 6, and 7 were synthesized with the same reaction time and reaction temperature as for sample 1; the differences were in the composition of the mixed solution. The volume ratios of ethyl alcohol to deionized water for each sample were 15![[thin space (1/6-em)]](https://www.rsc.org/images/entities/char_2009.gif) :
:![[thin space (1/6-em)]](https://www.rsc.org/images/entities/char_2009.gif) 0.4, 15
0.4, 15![[thin space (1/6-em)]](https://www.rsc.org/images/entities/char_2009.gif) :
:![[thin space (1/6-em)]](https://www.rsc.org/images/entities/char_2009.gif) 0.6, and 15
0.6, and 15![[thin space (1/6-em)]](https://www.rsc.org/images/entities/char_2009.gif) :
:![[thin space (1/6-em)]](https://www.rsc.org/images/entities/char_2009.gif) 0.8, respectively. All these products have the same post-treatment process as Ni3S21.
0.8, respectively. All these products have the same post-treatment process as Ni3S21.
Characterization
A Bruker D8 ADVANCE X-ray diffractometer was employed to characterize the structure of the Ni3S2 samples with nickel-filtered Cu-Kα radiation, 40 kV, 40 mA, and a scanning step of 0.1 per second. All the X-ray diffraction (XRD) measurements were carried out in the range 20° ≤ 2θ ≤ 80°. The morphology and size of the Ni3S2 crystals were characterized using Zeiss Evo LS-15 scanning electron microscopy (SEM) equipped with energy dispersive X-ray spectroscopy (EDS). The product Ni3S2 was etched from the mesh template, and the remaining amount of Ni was quantitatively analyzed using an Agilent 720/730 series inductively coupled plasma optical emission spectrometer (ICP-OES).Electrochemical performance test
The coin-type cells were directly fabricated in an argon-filled glove box using the nickel sulfide microrod array and microsheets in situ, grown on nickel substrate as the cathode without any ancillary materials, and lithium metal as the anode. The electrolyte was 1 mol L−1 LiPF6 in a mixture of ethylene carbonate (EC) and dimethyl carbonate (DMC; 1![[thin space (1/6-em)]](https://www.rsc.org/images/entities/char_2009.gif) :
:![[thin space (1/6-em)]](https://www.rsc.org/images/entities/char_2009.gif) 1 by volume). Charge and discharge cycles were performed in the potential range 1.0 V to 3.0 V at room temperature using a LAND battery test system (model CT2001A). The cyclic voltammetry (CV) test was achieved by using the as-prepared Ni3S2 microrod arrays on nickel foam as the working electrode and two lithium foils as the reference and counter electrodes with an electrochemical working station (model CHI660D) at a scanning rate of 0.5 mV s−1.
1 by volume). Charge and discharge cycles were performed in the potential range 1.0 V to 3.0 V at room temperature using a LAND battery test system (model CT2001A). The cyclic voltammetry (CV) test was achieved by using the as-prepared Ni3S2 microrod arrays on nickel foam as the working electrode and two lithium foils as the reference and counter electrodes with an electrochemical working station (model CHI660D) at a scanning rate of 0.5 mV s−1.
Results and discussion
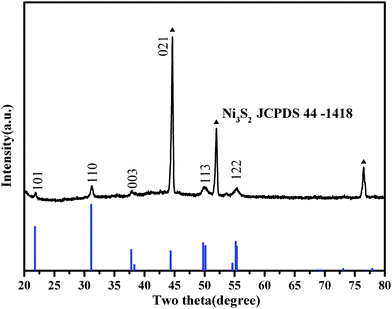
Large-scale stereoscopic structured heazlewoodite microrod arrays were successfully synthesized in a mixture of 12 mL absolute ethyl alcohol and 4 mL deionized water at 160 °C for 24 h in a 25 mL Teflon-lined autoclave. Fig. 1 is a typical XRD pattern of as-prepared Ni3S2 microrod arrays (Ni3S21). In this pattern, the diffraction peaks located at 21.75°, 31.12°, 37.78°, 38.27°, 44.33°, 49.73°, 50.12°, 55.16°, 68.99°, 73.04°, and 77.89° can respectively be assigned to the (101), (110), (003), (021), (202), (113), (211), (122), (303), (214), and (401) faces of heazlewoodite phase Ni3S2 with lattice constants a = 5.745 Å and c = 7.135 Å, which are in good agreement with JCPDS No. 44–1418. No peaks of any other phases or impurities were detected in the spectra, revealing the high phase purity of the Ni3S2 products.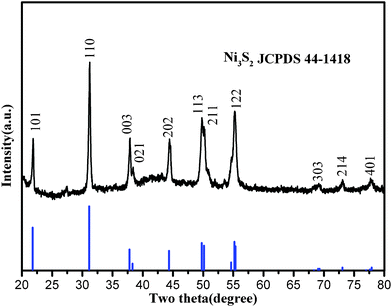 | ||
| Fig. 1 XRD pattern of the as-prepared 1D micro bamboo shoot-like Ni3S21. | ||
The preparation of Ni3S2 micro bamboo shoots 1 was done by etching the porous nickel mesh template. The overall view of these materials is illustrated in Fig. 2a. In the whole silhouette, the 3D porous nickel substrate with mesh structure is entirely covered with end products; the pore size of the mesh template ranges from 200 μm to 500 μm, and the width of the single network skeleton is about 100 μm. This special network porous structure is believed to improve the electrochemical properties because the structure can effectively increase the contact area of chemical electrodes. The cross-linked structure can also provide a passageway for the continuous transfer of electrons and ions. The magnified SEM images of stereoscopic structured heazlewoodite 1 are listed separately in Fig. 2b, 2c and 2d. As shown in Fig. 2b and 2c, the as-prepared Ni3S2 microrod arrays cover the surface of the mesh template. All these microstructured bamboo shoot-like arrays have the same growth direction and uniform size and shape. The diameter of an individual Ni3S2 microrod is within the range 100 nm to 300 nm, and the length is about 10 μm (Fig. 2d). Ordered 1D materials with a nano or a microstructure are thought to have a good electrochemical performance because they have a definite space between each other, which is ideal for electron transport.
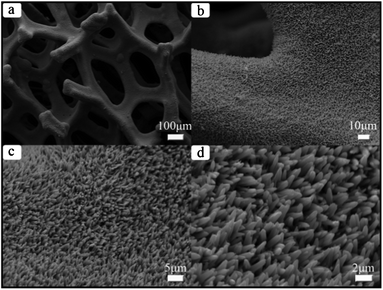 | ||
| Fig. 2 SEM images of as-obtained Ni3S21: (a) for overall view; (b), (c) and (d) for magnified SEM images. | ||
The reaction temperature was lowered to 120 °C and the solvent ratio was adjusted using 15 mL deionized water and 1 mL ethyl alcohol. Finally, Ni3S22 was obtained, which was completely different in size and morphology from Ni3S21. As seen in Fig. 3a, large-scale uniform flake nickel sulfide is distributed over the whole skeleton of the mesh framework. The structure of Ni3S22 is similar to that of Ni3S21, the pore size of the mesh template is in the range 200 μm to 500 μm, and the width of the single network skeleton is about 100 μm. Flake nickel sulfides are arranged very closely, cross each other, and grow in situ on the surface of the 3D network template (Fig. 3b and 3c). Fig. 3d reveals that the thickness and width of the regular hexagonal microsheets were about 90 nm and 10 μm, respectively.
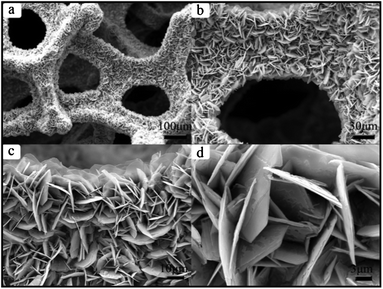 | ||
| Fig. 3 SEM images of as-prepared Ni3S22: (a) for overall view; (b), (c), and (d) for magnified SEM images. | ||
Compared with Ni3S21, the synthesis reaction of 2 is not complete. The diffraction peak of elemental nickel metal is found in the XRD pattern of the as-synthesized Ni3S2 microsheet 2. The diffraction peaks marked with ▲ can be indexed as the nickel substrate. In Fig. 4, all diffraction peaks except those marked with ▲ are identical to heazlewoodite Ni3S2 with space group R3m. Similarly to Ni3S21, the XRD pattern of as-prepared Ni3S22 is also in good agreement with JCPDS No. 44–1418. The diffraction peaks located at 21.75°, 31.1°, 37.78°, 49.73°, and 55.16° can respectively be assigned to the (101), (110), (003), (113), and (122) faces of heazlewoodite phase Ni3S2.
 | ||
| Fig. 4 XRD pattern of the as-synthesized 2D flake microsheet Ni3S22 (the diffraction peaks marked with ▲ can be indexed as the nickel substrate). | ||
To clarify the key factors that have the greatest influence on the size, structure, and morphology of the Ni3S2 microcrystals, a series of contrast experiments was designed as follows. Reaction time and solution composition were controlled by changing the reaction temperature to get Ni3S22, 3, and 4. The reaction temperatures of Ni3S23 and 4 are 140 °C and 160 °C, respectively. Contrasting the preparation methods of Ni3S23 and 4, their main difference is the solution composition. The volume ratio of ethyl alcohol to deionized water for Ni3S23 is 15![[thin space (1/6-em)]](https://www.rsc.org/images/entities/char_2009.gif) :
:![[thin space (1/6-em)]](https://www.rsc.org/images/entities/char_2009.gif) 1, while the ratio for Ni3S24 is 14
1, while the ratio for Ni3S24 is 14![[thin space (1/6-em)]](https://www.rsc.org/images/entities/char_2009.gif) :
:![[thin space (1/6-em)]](https://www.rsc.org/images/entities/char_2009.gif) 2. Along with the rise in reaction temperature, the morphology of Ni3S2 products clearly underwent a great change. When the reaction temperature is 140 °C, the morphology of Ni3S23 gradually inclined to flat (Fig. 5b). However, when the reaction temperature rose to 160 °C, numerous small cubic nano- or microparticles appeared on the surface of the mesh template (Fig. 5c). On the other hand, when the solution polarity was increased by increasing the proportion of water in the mixed solution, the end product Ni3S21 turned into bamboo shoot-like crystals with a microstructure (Fig. 5d).
2. Along with the rise in reaction temperature, the morphology of Ni3S2 products clearly underwent a great change. When the reaction temperature is 140 °C, the morphology of Ni3S23 gradually inclined to flat (Fig. 5b). However, when the reaction temperature rose to 160 °C, numerous small cubic nano- or microparticles appeared on the surface of the mesh template (Fig. 5c). On the other hand, when the solution polarity was increased by increasing the proportion of water in the mixed solution, the end product Ni3S21 turned into bamboo shoot-like crystals with a microstructure (Fig. 5d).
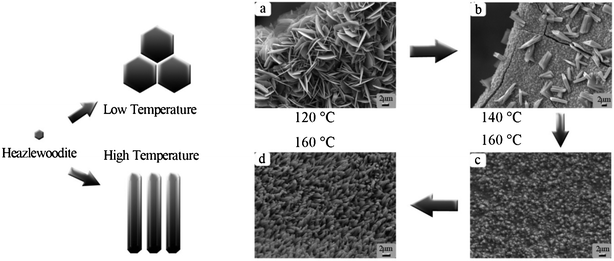 | ||
Fig. 5 The influence of reaction temperature and solvent composition on the morphology and size of Ni3S2 microcrystals. (a) For Ni3S22, the reaction temperature is 120 °C and the volume ratio of ethyl alcohol to deionized water is 15![[thin space (1/6-em)]](https://www.rsc.org/images/entities/char_2009.gif) : :![[thin space (1/6-em)]](https://www.rsc.org/images/entities/char_2009.gif) 1. (b) For Ni3S23, the reaction temperature is 140 °C and the volume ratio of ethyl alcohol to deionized water is 15 1. (b) For Ni3S23, the reaction temperature is 140 °C and the volume ratio of ethyl alcohol to deionized water is 15![[thin space (1/6-em)]](https://www.rsc.org/images/entities/char_2009.gif) : :![[thin space (1/6-em)]](https://www.rsc.org/images/entities/char_2009.gif) 1. (c) For Ni3S24, the reaction temperature is 160 °C and the volume ratio of ethyl alcohol to deionized water is 15 1. (c) For Ni3S24, the reaction temperature is 160 °C and the volume ratio of ethyl alcohol to deionized water is 15![[thin space (1/6-em)]](https://www.rsc.org/images/entities/char_2009.gif) : :![[thin space (1/6-em)]](https://www.rsc.org/images/entities/char_2009.gif) 1. (d) For Ni3S21, the reaction temperature is 160 °C and the volume ratio of ethyl alcohol to deionized water is 12 1. (d) For Ni3S21, the reaction temperature is 160 °C and the volume ratio of ethyl alcohol to deionized water is 12![[thin space (1/6-em)]](https://www.rsc.org/images/entities/char_2009.gif) : :![[thin space (1/6-em)]](https://www.rsc.org/images/entities/char_2009.gif) 4. 4. | ||
The typical XRD spectra of as-prepared Ni3S21, 2, 3, and 4 are presented in Fig. 6. Clearly, the diffraction peaks match well with the heazlewoodite phase Ni3S2 with lattice constants a = 5.745 Å and c = 7.135 Å, which are in good agreement with JCPDS No. 44–1418. However, the content of nickel metal in Ni3S23, 4 and 2 increased from the contrast results of XRD patterns. This result means that the rise in temperature is beneficial to the reaction in the fabrication of these materials. In contrast, the synthesis of Ni3S21 is the most thorough, due to the increase in the deionized water content of the mixed solution, thus further increasing the solution polarity.
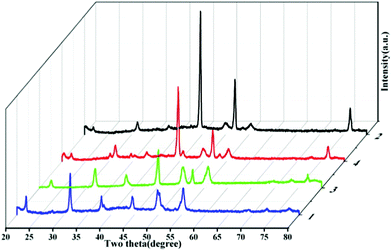 | ||
| Fig. 6 Typical XRD spectra of as-prepared Ni3S21, 2, 3, and 4. | ||
To validate the influence of the solution polarity on the reaction, a few sets of experiments were designed. The fabrication of Ni3S25, 6, and 7 was achieved by adjusting the volume ratios of ethyl alcohol to deionized water to 15![[thin space (1/6-em)]](https://www.rsc.org/images/entities/char_2009.gif) :
:![[thin space (1/6-em)]](https://www.rsc.org/images/entities/char_2009.gif) 0.4, 15
0.4, 15![[thin space (1/6-em)]](https://www.rsc.org/images/entities/char_2009.gif) :
:![[thin space (1/6-em)]](https://www.rsc.org/images/entities/char_2009.gif) 0.6, and 15
0.6, and 15![[thin space (1/6-em)]](https://www.rsc.org/images/entities/char_2009.gif) :
:![[thin space (1/6-em)]](https://www.rsc.org/images/entities/char_2009.gif) 0.8, respectively. Along with the increase in deionized water content, the flake structure of the nickel sulfide clearly increased quickly in number (Fig. 7). The XRD data of these three nickel sulfides are extremely similar to those of Ni3S22. This finding may be due to the increased solution polarity, which increased the solubility of thiourea, resulting in a more complete reaction. The EDS analysis was collected on a Zeiss Evo LS-15 SEM. As shown in Fig. 8, the experimental data show that the sulfur (S) content in Ni3S25, 6, and 7 increased in turn. In contrast, the sulfur content of Ni3S22 is the highest among these four compounds. The Moore ratios of sulfur (S) and nickel (Ni) in these four compounds in the experiment data are 7.57
0.8, respectively. Along with the increase in deionized water content, the flake structure of the nickel sulfide clearly increased quickly in number (Fig. 7). The XRD data of these three nickel sulfides are extremely similar to those of Ni3S22. This finding may be due to the increased solution polarity, which increased the solubility of thiourea, resulting in a more complete reaction. The EDS analysis was collected on a Zeiss Evo LS-15 SEM. As shown in Fig. 8, the experimental data show that the sulfur (S) content in Ni3S25, 6, and 7 increased in turn. In contrast, the sulfur content of Ni3S22 is the highest among these four compounds. The Moore ratios of sulfur (S) and nickel (Ni) in these four compounds in the experiment data are 7.57![[thin space (1/6-em)]](https://www.rsc.org/images/entities/char_2009.gif) :
:![[thin space (1/6-em)]](https://www.rsc.org/images/entities/char_2009.gif) 92.43, 15.38
92.43, 15.38![[thin space (1/6-em)]](https://www.rsc.org/images/entities/char_2009.gif) :
:![[thin space (1/6-em)]](https://www.rsc.org/images/entities/char_2009.gif) 84.62, 30.24
84.62, 30.24![[thin space (1/6-em)]](https://www.rsc.org/images/entities/char_2009.gif) :
:![[thin space (1/6-em)]](https://www.rsc.org/images/entities/char_2009.gif) 69.76, and 38.76
69.76, and 38.76![[thin space (1/6-em)]](https://www.rsc.org/images/entities/char_2009.gif) :
:![[thin space (1/6-em)]](https://www.rsc.org/images/entities/char_2009.gif) 61.24, respectively. Thiourea dissolves in water more easily than ethanol. Consequently, more thiourea dissolved in the mixed solution with the increased water content, producing more sulfur ions that react with the nickel substrate. These results indicate that the size and morphology of the final products can be controlled by changing the solution polarity.
61.24, respectively. Thiourea dissolves in water more easily than ethanol. Consequently, more thiourea dissolved in the mixed solution with the increased water content, producing more sulfur ions that react with the nickel substrate. These results indicate that the size and morphology of the final products can be controlled by changing the solution polarity.
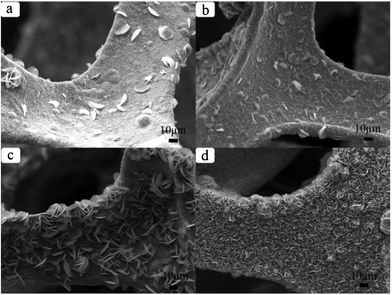 | ||
Fig. 7 The influence of solvent composition on the morphology and size of Ni3S2 microcrystals. (a) For Ni3S25, the volume ratio of ethyl alcohol to deionized water is 15![[thin space (1/6-em)]](https://www.rsc.org/images/entities/char_2009.gif) : :![[thin space (1/6-em)]](https://www.rsc.org/images/entities/char_2009.gif) 0.6. (b) For Ni3S26, the volume ratio of ethyl alcohol to deionized water is 15 0.6. (b) For Ni3S26, the volume ratio of ethyl alcohol to deionized water is 15![[thin space (1/6-em)]](https://www.rsc.org/images/entities/char_2009.gif) : :![[thin space (1/6-em)]](https://www.rsc.org/images/entities/char_2009.gif) 0.6. (c) For Ni3S27, the volume ratio of ethyl alcohol to deionized water is 15 0.6. (c) For Ni3S27, the volume ratio of ethyl alcohol to deionized water is 15![[thin space (1/6-em)]](https://www.rsc.org/images/entities/char_2009.gif) : :![[thin space (1/6-em)]](https://www.rsc.org/images/entities/char_2009.gif) 0.8. (d) For Ni3S22, the volume ratio of ethyl alcohol to deionized water is 15 0.8. (d) For Ni3S22, the volume ratio of ethyl alcohol to deionized water is 15![[thin space (1/6-em)]](https://www.rsc.org/images/entities/char_2009.gif) : :![[thin space (1/6-em)]](https://www.rsc.org/images/entities/char_2009.gif) 1.0. 1.0. | ||
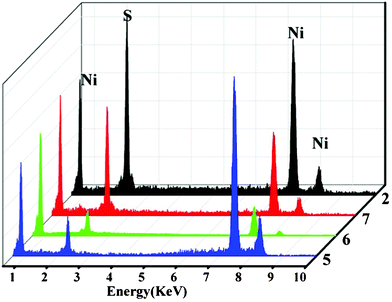 | ||
| Fig. 8 EDS measurement of as-synthesized Ni3S22, 5, 6, and 7. | ||
Based on the above analysis, the size, shape, and morphology of Ni3S2 products can be easily controlled by adjusting the reaction temperature and solution polarity. With the rise in temperature and the adjustment to the mixture proportions of the solution, uniform flake nickel sulfide microsheets can transform into large-scale regular microrod arrays. The chemical and physical performance of compounds depends on their structure and morphology, especially in micro or nano size. Thus the morphology and shape must be controlled to obtain excellent performance of the compounds. Achieving different morphologies and structures may improve the performance of the compounds.
Global awareness of the low-carbon economy and sustainable concepts has greatly promoted the progress of chemical power sources such as lithium-ion batteries.20–25 Among them, elemental sulfur and organosulfide have been proposed as promising cathode materials for the next generation of high-performance rechargeable lithium batteries, due to their high theoretical capacity. The Li-S batteries have increasingly attracted attention for their high theoretical capacity, good machining performance, and high conductivity.26,27 The electrode active materials directly growing on the surface of the current collector offers good electrical transport and interaction with active materials and current collector contacts. Herein, stereoscopic Ni3S2 microrod arrays and microsheets with a mesh structure were directly employed as the working anode in coin-type cells, which were assembled in an Ar-filled glovebox at room temperature. A Li-metal circular foil was utilized as the counter and reference electrodes, a microporous polypropylene membrane was used as the separator, and a 1 M solution of LiPF6 dissolved in a mixed solution of EC and DMC (1![[thin space (1/6-em)]](https://www.rsc.org/images/entities/char_2009.gif) :
:![[thin space (1/6-em)]](https://www.rsc.org/images/entities/char_2009.gif) 1 by volume) served as the electrolyte. Charge and discharge cycles were performed in the potential range 1.0 V to 3.0 V at room temperature using a LAND battery test system (model CT2001A). The charging and discharging reaction of Ni3S2 could be explained as follows:
1 by volume) served as the electrolyte. Charge and discharge cycles were performed in the potential range 1.0 V to 3.0 V at room temperature using a LAND battery test system (model CT2001A). The charging and discharging reaction of Ni3S2 could be explained as follows:
 | (3) |
 | (4) |
In theory, if Ni3S2 was completely converted into Ni and Li2S, its capacity would reach 462 mA h g−1. The mechanism for explaining the high discharge capacity of Ni3S2 with a 1D structure at low potential was proposed as follows: according to the model of interfacial charge storage, Li ions are stored on the sulfide side of the interface, while electrons are concentrated on the metallic side, leading to a charge separation. On this basis, a high surface area results in a high proportion of the total number of atoms lying near or on the surface, and produces a high capacity. On the other hand, the substrate of nickel foam with a 3D structure also provides a higher surface area than the lamellar substrate and a passageway for serial transmission of electrons, enhancing electroconductivity and reducing the distance for Li ions to diffuse because of its mutual cross-linked structure. Meanwhile, the surface area of 1D structure materials is higher than that of common materials. Fig. 9 shows the typical voltage–specific capacity curve of the Ni3S2 microrod array 1/Li cell and Ni3S2 microsheet 2/Li cell cycled at 14.2 mA g−1 and 26.1 mA g−1, respectively, at room temperature. The initial discharge curve of the Ni3S2 microrod array 1/Li cell has a smooth voltage plateau at about 1.30 V and a high discharge capacity of 592.9 mA h g−1. The first charge curve has a smooth voltage plateau at about 1.85 V and a high charge capacity of 508.6 mA h g−1. The first discharge capacity of the Ni3S2 microsheet 2/Li cell is about 381.7 mA h g−1. The conspicuous difference in electrochemical performance could be ascribed to their different morphologies and different degrees of reaction. The synthesis reaction is not complete, that is to say not all of the nickel elements become Ni3S2 materials. By comparison, the fabrication reaction of large-scale stereoscopic structured heazlewoodite microrod arrays 1 is smoothly finished. Compared with conventional bulk materials and nano- or microsized particles, 1D materials with nano or microstructures also have the advantage of a high aspect ratio, which can facilitate the alleviation of the mechanical stress induced by the volume change during repeated charge–discharge cycles. On this account, the initial discharge capacity of the Ni2S31 electrode is 592 mA h g−1, much higher than its theoretical capacity. In addition, the amount of remaining Ni was quantitatively analyzed using ICP-OES and the burning neutralization test. The results of these two methods are 51.2% and 47.9% (molar ratio), respectively, suggesting that about half of the nickel element is not involved in this synthesis reaction. In fact, the initial discharge capacity of the active ingredient in the Ni2S32 electrode is 783 mA h g−1 and far beyond its theoretical capacity, which is calculated according to the ICP-OES analysis results. Thus, carefully regulating the morphology and structure of nickel sulfide will improve its electrochemical properties.
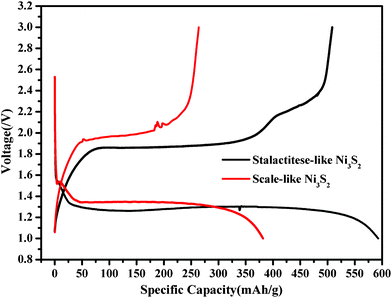 | ||
| Fig. 9 Typical voltage–specific capacity curve of the Ni3S2 microrod arrays/Li cell and Ni3S2 microsheets/Li cell cycled between 1.0 V and 3.0 V at 14.2 mA g−1 and 26.1 mA g−1, respectively, at room temperature. | ||
Fig. 10 shows the cyclic voltammograms of the as-prepared Ni3S2 microrod array/Li cell. The potential scanning rate is 0.5 mV s−1 in the voltage range 0.5–3.2 V vs. Li/Li+ at room temperature. The profiles of the CV curves of the 1st and 2nd cycle are similar, whereas an obvious difference between the initial two and subsequent three cycles is found. In the first cathodic scan, two inconspicuous reduction peaks are seen at around 1.3 V and 0.9 V, which are attributed to the formation of the SEI (solid electrolyte interface) and the formation of Ni. In the first anodic scan, three oxidation peaks at around 2.7 V can be attributed to the decomposition of the SEI and the formation of nickel sulfide. In the 3rd to 5th cycles, it is seen that there exists a high current peak occurring at around 1.0–1.1 V in the oxidation process, due to the insertion of lithium into the nickel sulfide microrod arrays. In contrast, there is a high current peak occurring at 2.2–2.3 V in the reduction process due to the extraction of lithium from the nickel sulfide microrod arrays.
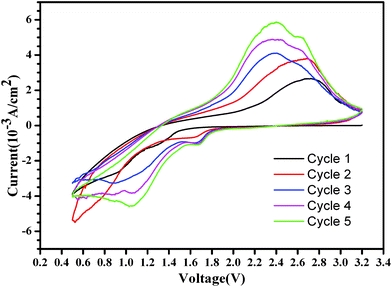 | ||
| Fig. 10 Cyclic voltammograms for the as-prepared Ni3S2 microrod array/Li cell. The potential scanning rate is 0.5 mV s−1 in the potential range 0.5–3.2 V vs. Li/Li+. | ||
Conclusions
In summary, large-scale stereoscopic structured heazlewoodite (Ni3S2) microrod arrays and scale-like microsheets were successfully prepared by a facile and environmentally benign approach, in which deionized water and ethanol were used as the environmentally friendly solvent. The structure and morphology of nickel sulfide could be controlled by adjusting the reaction temperature and solution polarity. The rise in reaction temperature could obtain a rod structure, whereas the increase in solution polarity could obtain a more dense structure. Carefully regulating the morphology and structure of nickel sulfide enhances its electrochemical properties. The initial discharge capacity of the as-obtained microrod arrays 1 electrode is 592 mA h g−1, and for the effective components, the discharge capacity of the as-fabricated scale-like microsheet 2 electrode is as high as 783 mA h g−1. All these figures are greater than the theoretical capacity of 462 mA h g−1. This study is valuable for the controlled growth of metal sulfides grown in situ on the 3D network metal template. Furthermore, this study also provides guidance on the development of the lithium-ion electrode.Acknowledgements
This work was supported by the National Science Foundation of China (Grant No. 21001090 and 21103153), China Postdoctoral Science Foundation funded project (Grant No. 20100480856 and 201003398), and Henan Province (Grant No. 2010HASTIT018 and 2012IRTSTHN021).References
- R. Pitchai, V. Thavasi, S. G. Mhaisalkar and S. Ramakrishna, J. Mater. Chem., 2011, 21, 11040–11051 RSC.
- D. W. Choi, D. H. Wang, I. T. Bae, J. Xiao, Z. M. Nie, W. Wang, V. V. Viswanathan, Y. J. Lee, J. G. Zhang, G. L. Graff, Z. G. Yang and J. Liu, Nano Lett., 2010, 10, 2799–2805 CrossRef CAS.
- J. E. Slota, X. M. He and W. T. S. Huck, Nano Today, 2010, 5, 231–242 CrossRef CAS.
- Q. F. Zhang and G. Z. Cao, Nano Today, 2011, 6, 91–109 CrossRef CAS.
- J. B. Goodenough and Y. Kim, Chem. Mater., 2010, 22, 587–603 CrossRef CAS.
- M. Armand and J.-M. Tarascon, Nature, 2008, 451, 652–657 CrossRef CAS.
- Y. He, L. Huang, X. Li, Y. Xiao, G. L. Xu, J. T. Li and S. G. Sun, J. Mater. Chem., 2011, 21, 18517–18519 RSC.
- R. Krishnan, T. M. Lu and N. Koratkar, Nano Lett., 2011, 11, 377–384 CrossRef CAS.
- V. Etacheri, R. Marom, R. Elazari, G. Salitra and D. Aurbach, Energy Environ. Sci., 2011, 4, 3243–3262 CAS.
- Y. X. Wang, L. Huang, L. C. Sun, S. Y. Xie, G. L. Xu, S. R. Chen, Y. F. Xu, J. T. Li, S. L. Chou, S. X. Dou and S. G. Sun, J. Mater. Chem., 2012, 22, 4744–4750 RSC.
- W. Zhou, W. Chen, J. Nai, P. Yin, C. Chen and L. Guo, Adv. Funct. Mater., 2010, 20, 3678–3683 CrossRef CAS.
- Q. Su, J. Li, G. Zhong, G. Du and B. Xu, J. Phys. Chem. C, 2011, 115, 1838–1842 CAS.
- Masoud Salavati-Niasaria, F. Davar and H. Emadi, Chalcogenide Letters, 2010, 7, 647–655 Search PubMed.
- K. Aso, H. Kitaura, A. Hayashi and M. Tatsumisago, J. Mater. Chem., 2011, 21, 2987–2990 RSC.
- P. A. Metcalf, P. Fanwick, Z. Kakol and L. M. Honig, J. Solid State Chem., 1993, 104, 81–87 CrossRef CAS.
- X. Y. Hu, Y. W. Tang, T. Xiao, J. Z. Jiang, Z. Y. Jia, D. W. Li, B. H. Li and L. J. Luo, J. Phys. Chem. C, 2010, 114, 947–952 CAS.
- H. H. Yin, K. Yu, H. Peng, Z. L. Zhang, R. Huang, J. Travas Sejdic and Z. Q. Zhu, J. Mater. Chem., 2012, 22, 5013–5019 RSC.
- X. L. Huang, X. Zhao, Z. L. Wang, L. M. Wang and X. B. Zhang, J. Mater. Chem., 2012, 22, 3764–3769 RSC.
- J. X. Zhu, Y. K. Sharma, Z. Y. Zeng, X. J. Zhang, M. Srinivasan, S. Mhaisalkar, H. Zhang, H. H. Hng and Q. Y. Yan, J. Phys. Chem. C, 2011, 115, 8400–8406 CAS.
- J. F. von Bülow, H. L. Zhang and D. E. Morse, Adv. Energy Mater., 2012, 2, 309–315 CrossRef.
- E. S. Lee, A. Huq, H. Y. Chang and A. Manthiram, Chem. Mater., 2012, 24, 600–612 CrossRef CAS.
- X. F. Zhang, K. X. Wang, X. Wei and J. S. Chen, Chem. Mater., 2011, 23, 5290–5292 CrossRef CAS.
- F. Y. Cheng, J. Liang, Z. L. Tao and J. Chen, Adv. Mater., 2011, 23, 1695–1715 CrossRef CAS.
- B. Scrosati, J. Hassoun and Y. K. Sun, Energy Environ. Sci., 2011, 4, 3287–3295 CAS.
- F. F. Cao, Y. G. Guo and L. J. Wan, Energy Environ. Sci., 2011, 4, 1634–1642 CAS.
- R. Demir-Cakan, M. Morcrette, F. Nouar, C. Davoisne, T. Devic, D. Gonbeau, R. Dominko, C. Serre, G. Férey and J. Tarascon, J. Am. Chem. Soc., 2011, 133, 16154–16160 CrossRef CAS.
- J. Hassoun and B. Scrosati, Angew. Chem., Int. Ed., 2010, 49, 2371–2374 CrossRef CAS.
| This journal is © The Royal Society of Chemistry 2012 |
