High-performance supercapacitors based on a graphene–activated carbon composite prepared by chemical activation
Yao
Chen
,
Xiong
Zhang
,
Haitao
Zhang
,
Xianzhong
Sun
,
Dacheng
Zhang
and
Yanwei
Ma
*
Institute of Electrical Engineering, Chinese Academy of Sciences, Beijing, 100190, P. R. China. E-mail: ywma@mail.iee.ac.cn; Fax: +86 10 82547137; Tel: +86 10 82547129
First published on 27th June 2012
Abstract
Graphene has been widely applied as a promising supercapacitor material based on the electric double-layer mechanism. In order to solve the dispersed problem of graphene, noncovalent functionalized graphene is prepared. However, not all of these functionalized graphene materials can be employed in supercapacitors due to non-electrochemically activated molecules absorbed on graphene. Here we find a route of chemical activation with KOH to transfer noncovalent functionalized graphene to a graphene–activated carbon composite with a high specific surface area. Stable graphene colloids absorbed by oligomers of p-phenylene diamine was produced during the reduction of graphite oxide. KOH can homogeneously contact the solid graphene nanosheets after drying the colloid. Chemical activation by annealing the graphene based hybrid with KOH leads to a greatly increased specific surface area of 798 m2 g−1. The resulting graphene–activated carbon composite has a good capacitance of 122 F g−1 and energy density of 6.1 Wh kg−1 in aqueous electrolyte. The supercapacitor exhibits maximum energy densities of 52.2 and 99.2 Wh kg−1 in an ionic liquid electrolyte at room temperature and 80 °C, respectively.
Introduction
Over the past decade, a great deal of efforts have been devoted to the research of energy storage devices with high energy and power densities. As an intermediate system between dielectric capacitors and secondary batteries, supercapacitors can operate at very high charge and discharge rates.1 That is why they can be applied in a variety of energy storage fields requiring high power capability,2 such as load cranes, forklifts and electric vehicles. Among all supercapacitor electrode materials, carbon materials based on the eelectrical double-layer mechanism have a high electrical conductivity. Other pseudocapacitive materials, for instance metal oxide and conductive polymers, exert Faradic redox reactions, leading to a relatively low power and retention.3,4 Hence, carbon-based supercapacitors have the unique advantage of higher energy density when operated in organic electrolytes as well as a higher power density and longer cycle life.5 However, compared with batteries, the energy density of carbon-based supercapacitors is still significantly low, mainly due to their limited capacitance. As we know, the specific capacitance of carbon materials depends on their effective specific surface area (SSA) accessible by electrolyte ions. Therefore, it is essential to enhance the effective SSA for carbon materials so that high energy and power densities can be obtained in supercapacitors.Generally, commercially activated carbon has a very large SSA but a disproportionate specific capacitance due to its inappropriate pore structure for ionic transport. The exact mechanism of ionic transport within porous textures is very complex, because all factors like connectivity, size distribution, and pore shape have to be considered. Graphene, as a new 2D material consisting of a monolayer of carbon atoms, has attracted much attention on the horizon of material science.6 It also has a large theoretical SSA of 2630 m2 g−1, which shows promising application in supercapacitors.7 Peculiarly, the SSA of graphene sheets is related to the number of layers rather than the distribution of pores. Moreover, graphene, even chemically exfoliated graphene, has a lower resistance than activated carbon. These unique advantages of graphene hold great promise for potential applications in supercapacitors.8 However, chemically exfoliated graphene is conventionally prone to intrinsic corrugations9 and consequently only obtains a relatively low SSA in the solid state.10 In order to solve aggregation during the reduction process, many methods were managed to disperse graphene in liquid phases and thus noncovalent functionalized graphene absorbed by large π-bond molecules was prepared.11,12 Unfortunately, most of these large molecules with high mass are non-electrochemically active and also decrease the SSA of graphene after covering its surface. So, it seems that noncovalent functionalized graphene cannot be applied in supercapacitors.
Typically, as in our previous report,13 a stable functionalized graphene colloid was produced by reducing exfoliated graphite oxide (GO) with p-phenylene diamine. The graphene based material is supposed to have a large SSA due to its outstanding dispersing ability in ethanol. Conversely, the SSA of the dried graphene decreases severely owing to the absorption of oxidation products of p-phenylene diamine (OPPD) on its surface in the solid state. It was revealed that the absorbed product is composed of dissolved oligomers and undissolvable OPPD by AFM imaging, Raman and UV-vis spectra. In order to exert the SSA potential of the excellently dispersed graphene, the absorption on its surface should be utilized. It is evident that partial impurities on the surface of graphene can be removed and residual absorption be transferred to activated carbon by annealing at high temperature. The activated carbon partially covered on graphene is a spacer to separate the individual graphene sheets, perhaps resulting in a large SSA. However, there are still two aspects to deteriorate the SSA of the material: one is that solid activated carbon still occupies most of the graphene surface and the other is that annealing at high temperature also leads to more severe agglomeration. As we know, chemical activation can tune pore size effectively for moderate-to-low structural order activated carbon materials. For example, Portet et al.14 used alkaline hydroxide to increase the volume of small pores <2 nm. Yan et al.15 prepared activated carbon with a high SSA using polyaniline as a precursor by twice annealing. Recently, the KOH activation method was also employed to generate nanoscale pores in microwave-prepared graphene with a high SSA.16 In our opinion, the chemical activation can be also employed to noncovalent functionalized graphene to increase its SSA.
In this paper, we synthesize a graphene–activated carbon composite by one-step KOH activation annealing using stable graphene colloids as a precursor. Obviously, the KOH activated method can create micropores or mesopores in the activated carbon covered on graphene. Hence part of the surface of the graphene sheets with a few layers is exposed because of etched activated carbon. Simultaneously the pores in the activated carbon also increase its SSA. In addition, the generation of gas in the activated reaction also prevents severe agglomeration of graphene sheets to some extent. As a result, the SSA of the final product greatly increases to 798 m2 g−1. It manifests that the activated method can bring noncovalent functionalized graphene prosperity for application in the energy storage field. Here, an ionic liquid of 1-ethyl-3-methylimidazolium tetrafluoroborate (EMIBF4) with a 4 V potential window is used as an electrolyte to enhance its energy capability. The maximum energy densities of the supercapacitor reach 52.2 and 99.2 Wh kg−1 in EMIBF4 electrolyte at room temperature (RT) and 80 °C respectively.
Experimental
GO was synthesized from natural graphite by the modified Hummers method.17 The synthesis of stable graphene colloids was described elsewhere.13 Typically, 0.2 g of GO in 200 mL of water was sonicated and 1.8 g of PPD was dissolved in 200 mL of N,N-dimethylformamide (DMF). Next, the colloid and the solution were mixed and refluxed in a water bath at 90 °C for 24 h. After filtration and washing with acetone, the powder was transferred into ethanol to form a stable functionalized graphene colloid by mild ultrasonication. Subsequently, 1.2 g of KOH was added into the functionalized graphene colloid and the resulting suspension was stirred. Then, the dried powder obtained by evaporating ethanol was heated at 800 °C for 1 h under an Ar atmosphere. Finally, the graphene–activated carbon composite, designated as GAC, was collected after rinsing with water and desiccation. For comparison, the aggregated graphene based material, noted as AG, was obtained in the same condition but with impregnated KOH.Raman spectra were obtained on a RM 2000 microscopic confocal Raman spectrometer (Renishaw inVia Plus, England) employing a 514 nm laser beam. X-ray diffraction (XRD) patterns were performed using a X'Pert Pro system with Cu–Ka radiation. X-ray photoelectron spectroscope (XPS) spectra were recorded on a PHI Quantear SXM (ULVAC-PH INC) which used Al as the anode probe. Surface area analysis was determined with Micromeritics TriStar II 3020. Transmission electron microscopy (TEM) morphology was investigated by JEOL JSM 2010.
The electrode materials are composed of GAC or AG, acetylene black and polytetrafluoroethylene binder with a weight ratio of 8![[thin space (1/6-em)]](https://www.rsc.org/images/entities/char_2009.gif) :
:![[thin space (1/6-em)]](https://www.rsc.org/images/entities/char_2009.gif) 1
1![[thin space (1/6-em)]](https://www.rsc.org/images/entities/char_2009.gif) :
:![[thin space (1/6-em)]](https://www.rsc.org/images/entities/char_2009.gif) 1. Then the electrode materials were pressed on nickel meshes as current collectors. The weight of activated material in each electrode with a diameter of 14 mm is at least 0.012 g. Coin-size capacitor cells were assembled in an Ar glove box using a polypropylene separator. The electrolyte was 1-ethyl-3-methylimidazolium tetrafluoroborate (EMIBF4). Finally, the cycle performances of the two-electrode systems were measured using Arbin MITS PRO 4.27. All other properties were detected by a CHI 660 C workstation at either RT or 80 °C.
1. Then the electrode materials were pressed on nickel meshes as current collectors. The weight of activated material in each electrode with a diameter of 14 mm is at least 0.012 g. Coin-size capacitor cells were assembled in an Ar glove box using a polypropylene separator. The electrolyte was 1-ethyl-3-methylimidazolium tetrafluoroborate (EMIBF4). Finally, the cycle performances of the two-electrode systems were measured using Arbin MITS PRO 4.27. All other properties were detected by a CHI 660 C workstation at either RT or 80 °C.
Results and discussion
Fig. 1 shows the Raman spectra of GAC and AG, both displaying two characteristic D and G lines of chemically modified graphene. Compared with the Raman spectrum of graphene powder before annealing,13 there are no peaks arising from OPPD in AG, illustrating that the impurity is removed by and large after annealing at a high temperature. In the spectrum of GAC, the D band at 1344 cm−1 represents disorder in graphitic materials and the G band at 1579 cm−1 is consistent with an active E2g phonon respectively.18 The G band in the AG spectrum shifts to 1592 cm−1. More importantly, the D![[thin space (1/6-em)]](https://www.rsc.org/images/entities/char_2009.gif) :
:![[thin space (1/6-em)]](https://www.rsc.org/images/entities/char_2009.gif) G intensity ratio of GAC is obviously more than that of AG, indicative of more translational symmetry breaking or defects in GAC. Both specimens have also been investigated by XRD further (Fig. 2). Although the XRD results of them are similar on the whole, GAC still shows a slightly broad band at the (002) plane compared to that in AG. The inconspicuous difference in the XRD results may imply that severe agglomeration may be ameliorated in GAC.
G intensity ratio of GAC is obviously more than that of AG, indicative of more translational symmetry breaking or defects in GAC. Both specimens have also been investigated by XRD further (Fig. 2). Although the XRD results of them are similar on the whole, GAC still shows a slightly broad band at the (002) plane compared to that in AG. The inconspicuous difference in the XRD results may imply that severe agglomeration may be ameliorated in GAC.
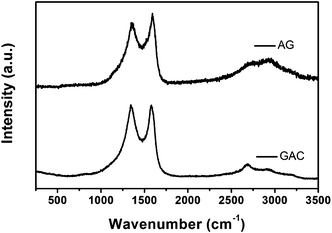 | ||
| Fig. 1 Raman spectra of GAC and AG. | ||
The C![[thin space (1/6-em)]](https://www.rsc.org/images/entities/char_2009.gif) :
:![[thin space (1/6-em)]](https://www.rsc.org/images/entities/char_2009.gif) N
N![[thin space (1/6-em)]](https://www.rsc.org/images/entities/char_2009.gif) :
:![[thin space (1/6-em)]](https://www.rsc.org/images/entities/char_2009.gif) O atom ratio of AG is 89
O atom ratio of AG is 89![[thin space (1/6-em)]](https://www.rsc.org/images/entities/char_2009.gif) :
:![[thin space (1/6-em)]](https://www.rsc.org/images/entities/char_2009.gif) 8
8![[thin space (1/6-em)]](https://www.rsc.org/images/entities/char_2009.gif) :
:![[thin space (1/6-em)]](https://www.rsc.org/images/entities/char_2009.gif) 3 while that of GAC is 91
3 while that of GAC is 91![[thin space (1/6-em)]](https://www.rsc.org/images/entities/char_2009.gif) :
:![[thin space (1/6-em)]](https://www.rsc.org/images/entities/char_2009.gif) 2
2![[thin space (1/6-em)]](https://www.rsc.org/images/entities/char_2009.gif) :
:![[thin space (1/6-em)]](https://www.rsc.org/images/entities/char_2009.gif) 7. No K atom is observed in the XPS survey spectrum of GAC (not shown), suggesting that all K products in the chemical activation reaction are rinsed away. It is found that the N
7. No K atom is observed in the XPS survey spectrum of GAC (not shown), suggesting that all K products in the chemical activation reaction are rinsed away. It is found that the N![[thin space (1/6-em)]](https://www.rsc.org/images/entities/char_2009.gif) :
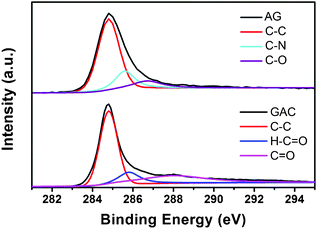
:![[thin space (1/6-em)]](https://www.rsc.org/images/entities/char_2009.gif) O value of GAC is reverse to that of AG. Further, the XPS C1s spectra in Fig. 3 analyze their chemical bonds. AG shows three components that correspond to C–C (284.8 eV), C–N (285.6 eV) and C–O (286.7 eV). In the spectra of GAC, the intensity of C–N is weakened while another different in the peaks of C
O value of GAC is reverse to that of AG. Further, the XPS C1s spectra in Fig. 3 analyze their chemical bonds. AG shows three components that correspond to C–C (284.8 eV), C–N (285.6 eV) and C–O (286.7 eV). In the spectra of GAC, the intensity of C–N is weakened while another different in the peaks of C![[double bond, length as m-dash]](https://www.rsc.org/images/entities/char_e001.gif) O (288 eV) emerges. Combining with the N
O (288 eV) emerges. Combining with the N![[thin space (1/6-em)]](https://www.rsc.org/images/entities/char_2009.gif) :
:![[thin space (1/6-em)]](https://www.rsc.org/images/entities/char_2009.gif) O value in GAC, the increased C
O value in GAC, the increased C![[double bond, length as m-dash]](https://www.rsc.org/images/entities/char_e001.gif) O bond may be attributed to the reaction between carbon and KOH. However, in brief, the carbon element dominates in both samples.
O bond may be attributed to the reaction between carbon and KOH. However, in brief, the carbon element dominates in both samples.
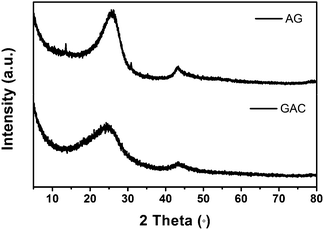 | ||
| Fig. 2 XRD patterns of GAC and AG. | ||
As chemically modified graphene inevitably aggregates after desiccation, its SSA reported by most literatures19,20 is much smaller than the theoretical value. However, the practical SSA of graphene is absolutely due to its layers.5 In our previous study,13 we found that OPPD absorbed on graphene deteriorates the SSA severely but it separates graphene. Hence the graphene-based material has a good potential to obtain a large SSA. However, the annealing process leads to the agglomeration of graphene and hence a great decrease of its SSA. So AG no doubt has a small BET value of 107 m2 g−1, which is nearly the same as that of thermally exfoliated graphene.21 The SSA measurement of GAC (Fig. 4a) also exhibits a type IV isotherm curve, indicative of a mesoporous structure in the GAC. It yields an evidently increased SSA of 798 m2 g−1, almost 8 times that of AG. The high SSA value is superior in comparison with a graphene–carbon nanotube composite.22 Their pore distribution is obtained by BJH analysis from the adsorption branches.23 It is clear that until 20 nm AG has a pore distribution much broader than that of GAC, shown in Fig. 4b. The pores with diameters of 2.4, 4.2 and 5.5 nm in AG contribute to the pore volume prominently. The average pore width of GAC by BET is 2.0 nm, smaller than of AG at 4.5 nm. Compared with annealed graphene with a big average pore size of 20 nm,20 GAC with a small pore size has a narrower pore distribution with an interconnected pore structure and short pore length.
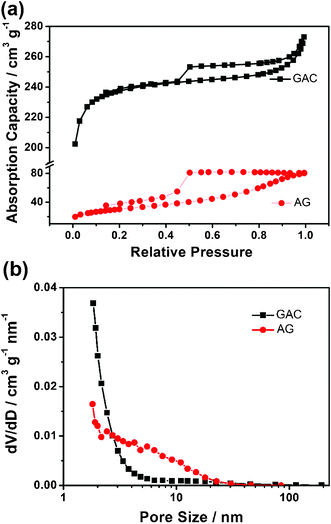 | ||
| Fig. 4 (a) Nitrogen adsorption–desorption isotherm and (b) pore-size distribution of GAC and AG. | ||
TEM images reveal the morphology difference between GAC and AG. Fig. 5a describes aggregated and crumpled GAC sheets accompanying a spot of hollow spheres with a diameter of ca. 100 nm. In Fig. 5b, there are 4 layers of graphene identified as the fewest number of layers observed in GAC. The result is not comparable to the graphene colloids because agglomeration occurs during the annealing treatment. As a sharp contrast, more severe aggregation of a few layers of graphite (>10 layers) is observed in Fig. 5d and e. The layer number of GAC and AG revealed by TEM are consistent with their BET values respectively, proving that chemical activation with KOH greatly increases the SSA of the graphene-based material. It is noted that there is no other morphology but graphite sheets in AG. High resolution TEM has also been employed to investigate the particular hollow sphere in GAC. In Fig. 5c, a partially amorphous structure can still be observed in the hollow sphere even when GAC suffers a high temperature of 800 °C. As we know from the previous report, OPPDs absorbed on graphene sheet present large spheres.24 It can be surmised that OPPD forms activated carbon under the combined influence of KOH and high annealing temperatures. On the contrary, there are no hollow carbon spheres in AG. The TEM contrast is in line with the D![[thin space (1/6-em)]](https://www.rsc.org/images/entities/char_2009.gif) :
:![[thin space (1/6-em)]](https://www.rsc.org/images/entities/char_2009.gif) G ratios in their Raman spectra. The residual activated carbon in GAC leads to a higher D
G ratios in their Raman spectra. The residual activated carbon in GAC leads to a higher D![[thin space (1/6-em)]](https://www.rsc.org/images/entities/char_2009.gif) :
:![[thin space (1/6-em)]](https://www.rsc.org/images/entities/char_2009.gif) G ratio in the Raman spectrum than that of AG. These results imply that KOH hampers the removal of OPPD, which is a precursor of activated carbon in the annealing course. Alternatively, OPPD turns to gas at a high temperature without KOH even if in Ar. Hence, KOH also plays an important role in increasing the SSA of the carbon composite by transferring OPPD to activated carbon as a spacer between graphene.
G ratio in the Raman spectrum than that of AG. These results imply that KOH hampers the removal of OPPD, which is a precursor of activated carbon in the annealing course. Alternatively, OPPD turns to gas at a high temperature without KOH even if in Ar. Hence, KOH also plays an important role in increasing the SSA of the carbon composite by transferring OPPD to activated carbon as a spacer between graphene.
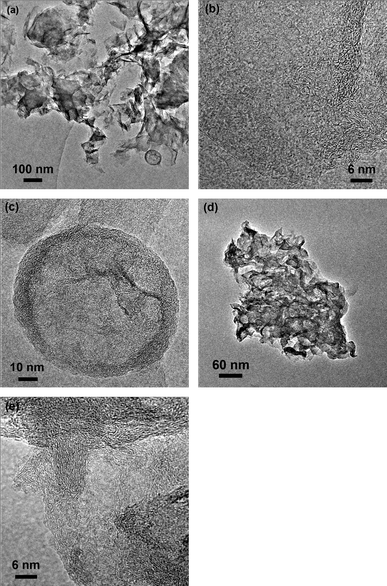 | ||
| Fig. 5 TEM images in (a) low and (b, c) high magnification of GAC and (d) low and (e) high magnification of AG. | ||
Fig. 6 panels a and b depict cyclic voltammetry (CV) profiles of GAC and AG at 10 mV s−1 using KOH and EMIBF4 as the electrolyte at RT, respectively. Both CVs in KOH feature perfect rectangular shaped curves, illustrating that the electrical double-layer capacitance mechanism dominates in the two materials. The CV curves in EMIBF4 are also featureless, inferring that both samples have little pseudocapacitive contribution. The ability to retain a rectangular shape in the ionic liquid is much better than that in 1 M tetraethylammonium tetrafluoroborate in propylene carbonate than for other carbon materials,25 which is associated with fast ion transport dynamics in the mesoporous structure of the two carbon materials. Apparently, the capacitance of GAC in Fig. 5 a and b is much higher than those of AG due to its larger SSA. The charge–discharge curves in Fig. 6c obtained at 0.1 A g−1 give the capacitance (122 and 27 F g−1) of GAC and AG in KOH electrolyte. The evident difference in capacitance agrees with the BET results. When EMIBF4 with a wide potential window of 4 V is used as the electrolyte at RT to enhance the energy density of the supercapacitors, the capacitive nature of GAC and AG is also displayed in Fig. 6d. The difference of properties in the ionic liquid electrolyte is similar to that in KOH. The highest capacitance of GAC at 0.1 A g−1 is 94 F g−1, also nearly 8 times that of AG (only 12 F g−1). The excellent result in GAC is nearly the same as that of graphene prepared with hydrazine hydrate even in organic electrolytes.5
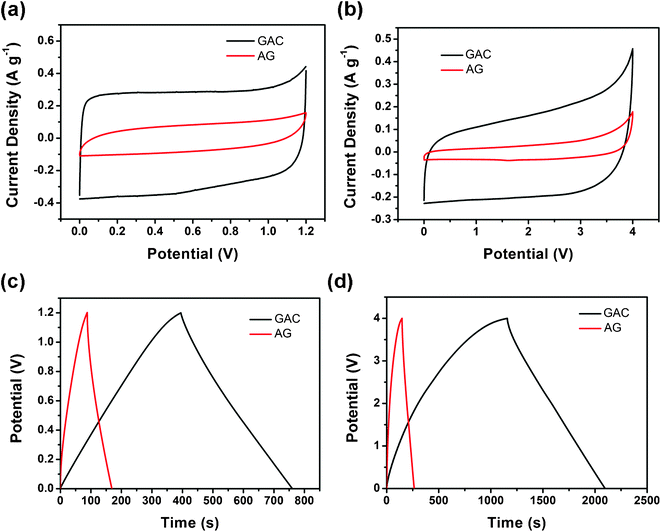 | ||
| Fig. 6 Comparison of the properties of supercapacitors between GAC and AG. CV profiles at 10 mV s−1 using (a) KOH and (b) EMIBF4 as the electrolyte, charge–discharge curves at 0.1 A g−1 using (c) KOH and (d) EMIBF4 as the electrolyte of GAC and AG at RT. | ||
According to the equation of
| E = 0.5CV2 m−1 | (1) |
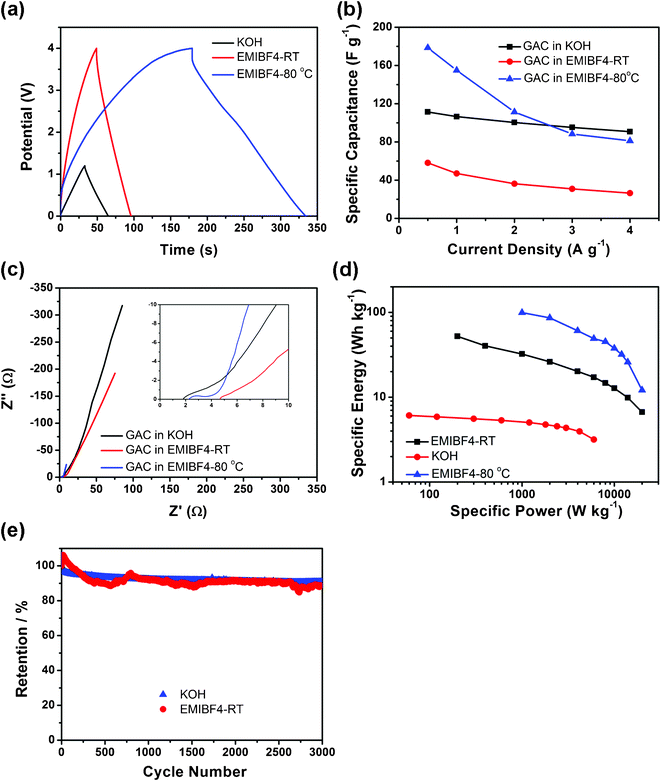 | ||
| Fig. 7 Properties of GAC supercapacitors. (a) Charge–discharge curves at 1 A g−1, (b) rate capability, (c) EIS plots and its magnification in high frequency in the inset, (d) Ragone plots and (e) cycle performances of GAC in KOH at RT, EMIBF4 at RT and EMIBF4 80 °C. | ||
Conclusions
The functionalized graphene colloid reported previously was used as a precursor. The GAC composite has been synthesized by a chemical activation method in one-step annealing. Impregnating KOH can greatly increase the SSA of the graphene-based material, reaching 798 m2 g−1, almost 8 times that of the control sample AG. Many thin but crumpled graphitic layer sheets and a spot of amorphous hollow carbon spheres are observed in GAC, illuminating that GAC is a composite of graphene and activated carbon. The activated carbon spheres arise from OPPD absorbing onto graphene in the colloid. The performance of GAC is much higher than that of AG due to the SSA difference. GAC in KOH shows a capacitance of 122 F g−1 and energy density of 6.1 Wh kg−1 in high loading. Its highest energy density reaches 99.2 Wh kg−1 in EMIBF4 at 80 °C, revealing a good application potential in supercapacitors.Acknowledgements
This work was supported by the Knowledge Innovation Program of the Chinese Academy of Sciences (no. KJCX2-YW-W26), Beijing Municipal Science and Technology Commission (no. Z111100056011007), and the National Natural Science Foundation of China (no. 21001103 and 51025726).References
- C. Liu, Z. Yu, D. Neff, A. Zhamu and B. Z. Jang, Nano Lett., 2010, 10, 4863 CrossRef CAS.
- Y. Chen, X. Zhang, D. Zhang and Y. Ma, Mater. Lett., 2012, 68, 475 CrossRef CAS.
- G. Wang, L. Zhang and J. Zhang, Chem. Soc. Rev., 2012, 41, 797 RSC.
- Y. Chen, X. Zhang, D. Zhang, P. Yu and Y. Ma, Carbon, 2011, 49, 573 CrossRef CAS.
- M. D. Stoller, S. Park, Y. Zhu, J. An and R. S. Ruoff, Nano Lett., 2008, 8, 3498 CrossRef CAS.
- K. S. Novoselov, A. K. Geim, S. V. Morozov, D. Jiang, Y. Zhang, S. V. Dubonos, I. V. Grigorieva and A. A. Firsov, Science, 2004, 306, 666 CrossRef CAS.
- A. Peigney, C. Laurent, E. Flahaut, R. R. Bacsa and A. Rousset, Carbon, 2001, 39, 507 CrossRef CAS.
- D. A. C. Brownson, D. K. Kampouris and C. E. Banks, J. Power Sources, 2011, 196, 4873 CrossRef CAS.
- Y. W. Zhu, S. Murali, W. W. Cai, X. S. Li, J. W. Suk, J. R. Potts and R. S. Ruoff, Adv. Mater., 2010, 22, 3906 CrossRef CAS.
- W. Lv, D.-M. Tang, Y.-B. He, C.-H. You, Z.-Q. Shi, X.-C. Chen, C.-M. Chen, P.-X. Hou, C. Liu and Q.-H. Yang, ACS Nano, 2009, 3, 3730 CrossRef CAS.
- Y. Xu, H. Bai, G. Lu, C. Li and G. Shi, J. Am. Chem. Soc., 2008, 130, 5856 CrossRef CAS.
- H. Bai, Y. Xu, L. Zhao, C. Li and G. Shi, Chem. Commun., 2009, 1667 RSC.
- Y. Chen, X. Zhang, P. Yu and Y. Ma, Chem. Commun., 2009, 4527 RSC.
- C. Portet, M. Á. Lillo-Rόdenas, A. Linares-Solanob and Y. Gogotsi, Phys. Chem. Chem. Phys., 2009, 11, 4943 RSC.
- J. Yan, T. Wei, W. Qiao, Z. Fan, L. Zhang, T. Li and Q. Zhao, Electrochem. Commun., 2010, 12, 1279 CrossRef CAS.
- Y. Zhu, S. Murali, M. D. Stoller, K. J. Ganesh, W. Cai, P. J. Ferreira, A. Pirkle, R. M. Wallace, K. A. Cychosz, M. Thommes, D. Su, E. A. Stach and R. S. Ruoff, Science, 2011, 332, 1537 CrossRef CAS.
- W. S. Hummers and R. E. Offeman, J. Am. Chem. Soc., 1958, 80, 1339 CrossRef CAS.
- D. Graf, F. Molitor, K. Ensslin, C. Stampfer, A. Jungen, C. Hierold and L. Wirtz, Nano Lett., 2007, 7, 238 CrossRef CAS.
- Y. Wang, Z. Shi, Y. Huang, Y. Ma, C. Wang, M. Chen and Y. Chen, J. Phys. Chem. C, 2009, 113, 13103 CAS.
- Q. Du, M. Zheng, L. Zhang, Y. Wang, J. Chen, L. Xue, W. Dai, G. Ji and J. Cao, Electrochim. Acta, 2010, 55, 3897 CrossRef CAS.
- Z. S. Wu, D. W. Wang, W. Ren, J. Zhao, G. Zhou, F. Li and H. M. Cheng, Adv. Funct. Mater., 2010, 20, 3595 CrossRef CAS.
- Q. Cheng, J. Tang, J. Ma, H. Zhang, N. Shinya and L. C. Qin, Phys. Chem. Chem. Phys., 2011, 13, 17615 RSC.
- Y. Chen, X. Zhang, D. Zhang and Y. Ma, J. Alloys Compd., 2012, 511, 251 CrossRef CAS.
- Y. Chen, X. Zhang, P. Yu and Y. Ma, J. Power Sources, 2010, 195, 3031 CrossRef CAS.
- A. Izadi-Najafabadi, S. Yasuda, K. Kobashi, T. Yamada, D. N. Futaba, H. Hatori, M. Yumura, S. Iijima and K. Hata, Adv. Mater., 2010, 22, E235 CrossRef CAS.
- X. Liu and P. G. Pickup, J. Power Sources, 2008, 176, 410 CrossRef CAS.
- H. K. Jeong, M. Jin, E. J. Ra, K. Y. Sheem, G. H. Han, S. Arepalli and Y. H. Lee, ACS Nano, 2010, 4, 1162 CrossRef CAS.
- Y. Sun, Q. Wu and G. Shi, Phys. Chem. Chem. Phys., 2011, 13, 17249 RSC.
- C.-Y. Chen, C.-Y. Fan, M.-T. Lee and J.-K. Chang, J. Mater. Chem., 2012, 22, 7697 RSC.
- Z. Fan, J. Yan, T. Wei, L. Zhi, G. Ning, T. Li and F. Wei, Adv. Funct. Mater., 2011, 21, 2366 CrossRef CAS.
| This journal is © The Royal Society of Chemistry 2012 |

