Nanostructured polyaniline-polytitanate-clay composite for photocatalytic applications: preparation and properties†
Rajaraman
Ramakrishnan
,
Janardhanan D.
Sudha
* and
Viswan L.
Reena
Chemical Sciences and Technology Division, National Institute for Interdisciplinary Science and Technology (NIIST), CSIR, Thiruvananthapuram 695 019, India. E-mail: sudhajd2001@yahoo.co.in; Tel: +914712515316
First published on 2nd May 2012
Abstract
Nanostructured polyaniline-polytitanate-clay composite (PPTC) was prepared by the polymerization of anilinium hydrochloride in a dispersion of polytitanate functionalized clay at room temperature. Modified clay-polytitanate adsorbs anilinium ions by ion-dipole interactions and will act as a template. During polymerisation, polyaniline forms linkages between these disorganized titanate modified clay layers and may co-structure with the self-assembled polyaniline layers. They then roll up to form three dimensionally ordered nanotubes by a self-assembly process which was confirmed by morphological analysis, EDS and XRD. The photocatalytic efficiency of this PPTC was demonstrated by performing the photodegradation studies of methylene blue and methyl orange at room temperature under natural light irradiation. Studies revealed that this novel PPTC nanocomposite can be used as a prospective candidate for the disposal of pollutants present in the environment.
Introduction
Designing hybrid nanocomposites by co-assembly of organic and inorganic precursors at the molecular level by controlling the interfaces, structure and morphology is a challenging task. Such hybrid materials are receiving attention because the synergism between the components often gives rise to properties that are superior to the sum of those of the individual components. Harnessing the advantages of both the components requires fine tuning of the spatial assembly of individual domains and their interfaces.Nanocrystalline titanium dioxide has unique physico-chemical properties and can be used in advanced coatings, cosmetics, sensors, solar cells and photocatalyst applications.1–8 Clays are layered materials having large surface area, high cation exchange capacity and can adsorb organic substances either on their external surfaces or within their interlaminar spaces by interaction or substitution. Titanate intercalated clays are receiving attention since they have a mesoporous structure, high adsorption ability, stable photocatalytic activity and large specific surface area.9,10 Recently, TiO2 pillared clays have been studied for their photocatalytic activity in the degradation of some organic pollutants in water.11 They can enhance the electron transfer between host and guest and can also impart high thermo-mechanical stability for the formed composite. Several methods have been developed to prepare TiO2–clay composites. They are usually prepared by the exchange of Ca2+, Na+, K+ present in the clay gallery by OH–Ti cation species.12,13 Zhao and Xiang deposited nanocrystallites of anatase on the clay particles by sol–gel method.14 Tao Guo et al. studied the photocatalytic properties of a polyaniline-intercalated layered protonic titanate nanocomposite.15 Yoda et al. prepared TiO2–MMT nanocomposites in supercritical CO2.15a In general, titanate complexes are reported to be prepared by the hydrolysis of TiCl416 or TiOSO4.17 Researchers have reported that such polytitanate cations exhibit well defined HOMO–LUMO gaps (semiconductor “band gaps”).18–20 Einaga observed the existence of polytitanate cation species [(TiO)8(OH)12]4+ in solutions prepared under certain conditions.21 The formation of semiconductor polytitanate cation by self-assembly offers distinct advantages such as low cost, uniformity and large surface area over other techniques. Ideally, photocatalysts should be able to harvest the visible source of sunlight. The most important challenge in the design of photocatalytic materials is to possess a band gap in the range of 1.8–3.1 eV. TiO2 with a band gap of 3.2 eV can be activated only by UV light with wavelength 400 nm or shorter and is considered as an n-type semiconductor. To induce visible light activity in TiO2, the band gap must be shifted to lower values. Several attempts have been made to increase the photocatalytic efficiency of TiO2 such as dye photosensitization,22 ion doping23 and preparing its precursors such as protonated polytitanate.24 It has been shown that titanium dioxide on hybridising with a conducting polymer can increase the photocatalytic activity towards the decomposition of organic molecules when irradiated with visible light.25
Conjugated polymers with extended π-electron systems such as polyaniline, polythiophene, polypyrrole and their derivatives have shown great promise due to their high absorption coefficients in the visible part of the spectrum, high mobility of charge carriers, and good stability.26 Polyaniline (PANI) is one of the most important conducting polymers because of its unique opto-electrical properties, ease of preparation, excellent environmental stability and tunable conductivity via special proton doping mechanism.27,28 Therefore, conjugated polymers with wide band gap inorganic semiconductors are receiving attention for optical, electronic, photocatalytic and photoelectric conversion applications.29–32 Conducting PANI behaves as a p-type semiconductor with a band gap absorption edge that can extend into the range of visible light, exhibits good environmental stability and has been used in a variety of applications. Thus p-n junctions can be realized by intercalating a p-type conducting polymer into the n-type polytitanate functionalised nanoclay layers. This should allow the drawbacks of the latter, such as its poor response to visible light, high rate of electron-hole recombination, leaching and thermal decomposition, to be overcome. In addition to the photocatalytic properties, a successful candidate for a global scale catalyst material needs to be non-toxic, inexpensive, stable and widely available. Thus, the preparation of a polyaniline-polytitanate-clay composite is receiving attention since it can exhibit unique properties arising from the synergetic effects of electrically conductive PANI, semiconducting and photocatalytic effect of polytitanate, absorbability and high aspect ratio of nanoclays.
In the present work, nanostructured photocatalytic polyaniline-polytitanate-clay composite was prepared by the polymerisation of anilinium hydrochloride in presence of polytitanate functionalised clay using ammonium persulphate as radical initiator at room temperature. Here, the polytitanate functionalised nanoclay acts as a template and will control the molecular configuration of the PANI guest molecules within the confined environment. The resulting PPTC nanocomposites are hybridised at the molecular level and behave as a p-n heterojunction structure. They were characterised by X-ray diffraction, Fourier transform infrared spectroscopy, UV-visible spectroscopy and TG-DTG analysis. The photocatalytic efficiency of these nanocomposites was investigated by performing the photodegradation studies of methylene blue and methyl orange at room temperature under natural light irradiation, and by performing UV-Vis absorption studies.
Experimental
Materials
Anilinium hydrochloride monomer (99.5% pure, Sigma Aldrich), ammonium persulphate (APS), titanium tetrachloride (s.d. fine Chem limited, Bombay, India) were used without further purification. Na+ cloisite clay with cation exchange capacity of 92.6 meq/100 g and a mean chemical formula of (Na,Ca)0.33(Al1.67 Mg 0.33)Si4O10(OH) 2nH2O (Loba Chemie, Bombay, India). Methyl orange (MO) chemical formula of C14H14N3NaO3S and methylene blue (MB) chemical formula of C16H18N3Cl S were purchased from Aldrich, USA.Preparation of polytitanate (PHT)
PHT was prepared by the hydrolysis of titanium tetrachloride solution with 6 M hydrochloric acid. A typical procedure is as follows: 7.778 g (0.082 mol) of titanium tetrachloride was mixed with 4.7 mL (6 N) HCl in 40.8 mL of water and stirred vigorously for 20 min. The product was dialysed to remove any chloride ions. The prepared PHT was aged for 3 days at room temperature to allow the growth of the polytitanate cation under nitrogen atmosphere.Preparation of polytitanate intercalated clay (PHTC)
0.5 g clay in 50 mL of water (1 wt%) was added slowly to a vigorously stirred solution of 2.53 mL of PHT. The ratio of cation to clay was 90 mmol/meq for the synthesis. Upon complete addition of clay to the PHT solution, the reaction mixture was stirred for an additional 2 h. The product was washed and filtered with water. The resulting material was then dried in a vacuum oven at 75 °C for 12 h and made into a powder for further characterisation.Preparation of polyaniline-polytitanate-clay composites (PPTC)
0.1 g clay in 10 mL of water (1 wt%) was added slowly to a vigorously stirred solution of 0.506 mL of PHT. It was stirred for 1 h and 2.0 g of anilinium hydrochloride (1.6 × 10⁻² mol) in 20 mL water was added. Stirring continued for further 1 h. Then the system was cooled to 5 °C and 3.5 g of APS (9.1 × 10⁻³ mol) in 35 mL of water was added dropwise to the system. After the addition of APS, polymerization was continued to achieve high molecular weight PANI species. The green emeraldine salt of PPTC formed was isolated by centrifugation. Washing and centrifugation was repeated a number of times with distilled water. The product was then dried under freeze drying for 12 h and made into a powder. PANI, polyaniline clay composites without PHT (PPC), polyaniline-PHT composites without clay (PPT) were prepared under the same conditions for comparison. Experiments were also performed by varying the composition of aniline hydrochloride content in the composites and prepared samples were designated as PPTC1, PPTC2, PPTC3 and PPTC4.Visible light photocatalytic reaction tests
Visible light photocatalytic activity was evaluated by the degradation of methylene blue (MB) and methyl orange (MO) in an aqueous solution. An aqueous suspension of (100 mL) of MB (1 × 10⁻⁵ M) and 0.01 g of PPTC nanoparticles was stirred in the dark for 30 min to establish an adsorption/desorption equilibrium before irradiation in a reaction cell made of quartz. Light from a 300 W Xe lamp passed through a UV light filter film (to remove the radiation with λ < 400 nm) and was focused onto the reaction cell. Aliquots (3 mL) were take it out at given time intervals and centrifuged to remove the particles. The residual MO concentration was detected using a UV-vis spectrophotometer. The absorbency of the original methyl orange and methylene blue solution (namely C0) and absorbencies of methyl orange and methylene blue solution for every 5 min (namely C) was measured by UV-visible spectroscopy. The photocatalytic efficiency was calculated by using the equation, d = (C0 − C)/C0. Where, d = photocatalytic efficiency; C0 = absorbency of original dye solution; C = absorbency of dye solution, were measured every 5 min. The order of photocatalytic reaction was calculated by ln(C/C0) = k(min−1) t + a; where k is the apparent reaction rate constant C0 is the initial concentration of aqueous dye solution and C is concentration of aqueous dye solution at the reaction time t.Characterisation techniques
UV-vis absorption spectra of the nanocomposites were studied by dispersing the sample in distilled water and recorded spectra using UV-vis spectrophotometer (Shimadzu model 2100) in the range of 200–1100 nm. Diffused reflectance absorption spectra (DRS) were recorded using a Shimadzu integrating sphere assembly attached to a Shimadzu UV-vis 3101PC spectrometer. BaSO4 was used as the reflectance standard. FT-IR measurements were made with a fully computerized Nicolet impact 400D FT-IR spectrophotometer. Polymers were mixed thoroughly with potassium bromide and compressed into pellets before recording. All spectra were corrected for the presence of moisture and carbon dioxide in the optical path. Powder X-ray diffraction studies were performed with an X-ray diffractometer (Philip's X'pert Pro) with Cu-Kα radiation (λ = 0.154 nm) employing an X'celarator detector and a monochromator at the diffraction beam side. Powder samples were used by employing a standard sample holder. The d-spacing of the nanocomposite was calculated from the angular position 2θ of the observed d001 reflection peaks based on the Bragg's formula nλ = 2dsinθ, where λ is the wavelength of the X-ray beam and θ is the diffraction angle. An average 2θ resolution of 0.002 from 5 to 70°. Electrical conductivity measurements were performed with a standard four-probe conductivity meter using a keithely 6881 programmable current source and a 2128A nanovoltmeter at 30 °C. The samples were pressed into a 13 mm diameter disk for the measurement. The BET surface area measurements of the samples were measured using Micrometritics tristar 3000 model surface area analyser. 0.5 gm of the sample was heated to 200 °C for 3 h under nitrogen atmosphere for degassing. Then it was subjected to absorption of nitrogen using sorptometer at liquid nitrogen temperature. Particle size and zeta potential measurement of the samples were carried out in a Nano ZS Malvern instrument employing a 4 mW He–Ne laser (λ = 632.8 nm) and equipped with a thermostated sample chamber. DLS is a non-invasive, well-established technique for measuring the size of molecules and particles typically in submicron region, and with the latest technology lower than 1 nm. SEM measurements of samples were performed by subjecting the samples for thin gold coating using a JEOL JFC-1200 fine coater. The probing side was inserted into JEOL JSM-5600 LV scanning electron microscope for imaging. Transmission electron microscopy was performed in an FEI, TECNAI S twin microscope with an accelerating voltage of 100 KV. For TEM measurements, the sample solutions were prepared by dispersion under an ultrasonic vibrator. They were then deposited on a formvar coated copper grid and dried in a vacuum at room temperature before observation. Thermal stability measurements were performed at a heating rate of 10 °C min−1 in a nitrogen atmosphere using Schimadzu, DTG-60 equipment. DSC scans were performed using a Dupont DSC 2010 differential scanning calorimeter attached to a Thermal Analyst 2100 data solution under nitrogen atmosphere at a heating rate of 10 °C min−1. Photocatalytic activities of the materials of PPTC, PHT, PHTC and PANI were evaluated by monitoring photodegradation studies of methyl orange and methylene blue solution.Results and discussion
Preparation of PPTC
Photocatalytic nanostructured PPTC was prepared by in situ polymerisation of anilinium hydrocholoride in aqueous dispersion of PHTC using APS as initiator at room temperature as shown in Scheme 1. Polytitanate was prepared by the hydrolysis of titanium tetrachloride using hydrochloric acid as shown in Scheme 1. Particle size of the nanoparticles was measured using dynamic light scattering method and was found to be ∼25 nm and the histogram of the same is shown in Fig. 1S (ESI†). PHTC was prepared by the cation exchange process of PHT by the alkaline earth metals present in the gallery of the clay as shown in Scheme 1. PHT is either intercalated inside the nanoclay layers or adsorbed on the outer surface of the exfoliated silicate layers and is stabilized by the hydrogen bond and van der Waals force of interaction between the clay layers and PHT. PHTC was prepared with different mmol/meq of PHT/clay and BET surface area was measured and details shown in Table 1S (see ESI†). A maximum B.E.T surface area of 230 m2 g−1 obtained for 90 mmol/meq titanium/clay ratio. The zeta potential of PHT and PHTC in aqueous solution is measured as −41.3 mV and −49.7 mV, respectively and the representative curves of PHT and PHTC are shown in Fig. 2Sa and 2Sb (see ESI†).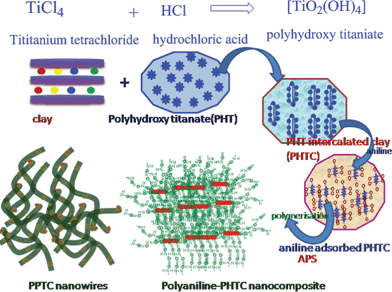 | ||
| Scheme 1 Formation of PPTC through self assembly. | ||
During the addition of aniline hydrochloride in to the highly charged PHTC, anilinium ions get adsorbed on the surface of PHTC and act as a template during the polymerisation of aniline as shown in Scheme 1. Polymerisation is initiated by the addition of APS, and is followed by the color change from colourless to blue, indicating that the polymerization reaction had taken place at a significant rate. During polymerisation, the adsorbed aniline on the surface of PHTC led to the formation of a three-dimensional network structure as observed during morphological analysis. The tubes are observed to be smoother due to the formation of engulfed PANI layers outside these tubes. The emeraldine green coloured multifunctional composite was isolated by repeated centrifugation and washing with water and finally dried by freeze drying.
UV-visible spectroscopy
Electronic structures of the prepared PHT, PHTC, PANI and PPTC samples were studied by both UV-vis absorption and UV-vis diffuse reflectance spectroscopy (DRS). The diffuse reflection spectra of PHTC, PHT, PANI and PPTC are shown in Fig. 1a–d. DRS spectrum of PHT exhibited a maxima at 387 nm and the band gap of the same calculated using the following equation, band gap = 1240/reflectance wave length (maximum) showed a value of 3.2 eV suggesting its semi-conductive nature. PHTC exhibited a UV-reflectance maxima at 403 nm with an energy band gap of 3.07 eV. PANI showed reflectance maxima at 452 nm and 502 nm corresponding to the band gap of (2.76 and 2.46 eV).33,34 The DRS spectrum of PPTC exhibited three reflectance maxima at 360 nm, 439 nm and 636 nm with a band gap of 3.44 eV, 2.82 eV and 1.94 eV, respectively. Thus, PPTC exhibits band gaps characteristic of both PANI and PHT.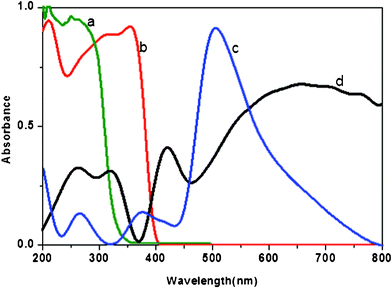 | ||
| Fig. 1 Diffuse reflectance spectra of the (a) PHTC (b) PHT (c) PANI and (d) PPTC. | ||
The protonated state and the interaction among different moieties in the composites were studied by UV-vis absorption spectroscopy using samples in aqueous dispersion. UV-vis spectra of PPTC, PPT, PPC and PANI are shown in Fig. 3Sa to 3Sd, respectively (see ESI†). The UV-vis spectrum of PANI exhibited three bands at 340 nm, 430 nm and 750 nm characteristic of the π–π*, π-polaron and polaron-π* transitions respectively.35,36 In both PPC and PPTC, the first two bands (340 nm and 430 nm) merged to form a single broad band and appeared at ∼430 and 450 nm, respectively. The red shift observed in PPTC when compared to PANI and PPC is due to the interaction between titanate ions and PANI chains present in PPTC.
In pure PANI, the strong interaction of chains caused π-conjugated defects and always leads to a “compact coil” conformation. In both PPC and PPTC, the third band is red shifted to 809 nm and 812 nm, respectively due to the presence of delocalized polarons arising from the confined environment of nanoclay layers.37 Here, the nanoclay layers not only eliminate the interaction of different PANI chains, but also limit the contraction of the chains. Thus in PPTC, PANI is in a more expanded conformation38 and there is strong interaction between PANI chains and PHT nanoparticles.39 The PPTC nanocomposite can be activated by absorbing both the UV and visible light (λ = 190–800 nm). All these results suggest that this PPTC composite can be considered as a promising candidate for the photoelectric conversion and photocatalytic activity applications.
FT-IR Analysis
The chemical structure of these nanocomposites and the interaction among the moieties were manifested from the studies made by FTIR spectroscopy. FTIR spectra of PPTC, PANI, PPT, PPC, PHT, PHTC and clay are shown in Fig. 4Sa to 4Sg, respectively (see ESI†). Generally, FTIR spectra of PPTC, PANI, PPC and PPT exhibited bands at 1552 and 1479 cm−1 and were attributed due to the C![[double bond, length as m-dash]](https://www.rsc.org/images/entities/char_e001.gif) C stretching mode of the quinoid and benzenoid ring, respectively. While the bands at 1296 and 1237 cm−1 were attributed due to the C–N stretching mode of the benzenoid ring. The bands at 1120 and 895 cm−1 were assigned to the in-plane and out-of-plane bending vibration and C–H stretching. The characteristic band of PANI at 1552 and 1237 cm−1 shifted to a higher wave number corresponding to the stretching mode of C
C stretching mode of the quinoid and benzenoid ring, respectively. While the bands at 1296 and 1237 cm−1 were attributed due to the C–N stretching mode of the benzenoid ring. The bands at 1120 and 895 cm−1 were assigned to the in-plane and out-of-plane bending vibration and C–H stretching. The characteristic band of PANI at 1552 and 1237 cm−1 shifted to a higher wave number corresponding to the stretching mode of C![[double bond, length as m-dash]](https://www.rsc.org/images/entities/char_e001.gif) C and C–N in PPTC. The bands at 1479 and 1120 cm−1 shifted to a lower wave number, corresponding to the stretching mode of C
C and C–N in PPTC. The bands at 1479 and 1120 cm−1 shifted to a lower wave number, corresponding to the stretching mode of C![[double bond, length as m-dash]](https://www.rsc.org/images/entities/char_e001.gif) C and C–H. These obvious changes in the wave number of PPTC, suggested that an interaction exists between PHT nanoparticles and PANI.40 The titanium present in PHT can form a coordination bond with the nitrogen atoms present in PANI macromolecules and hence the shift in the characteristic values of PANI in PPTC.41,42 The characteristic bands of clay observed at 3630 cm−1 (stretching vibration of the OH group of Mg–Al–OH) and broad band at 3454 cm−1 (stretching vibration of the water and hydroxyl group). The amount of water absorbed in clays is related to the deformation of H–O–H group 1640 cm−1. The bands at 1046 and 792 cm−1 are attributed to Si–O vibration. The bands at 528 and 462 cm−1 correspond to the deformation vibration of Si–O–Al and Si–O–Si, respectively. The shift in the absorption bands at 906 and 520 cm−1 may be caused by the exchange effects of the cations. The band at 906 cm−1 arises from the stretching vibration of Al–OH. Compared with clay, PHTC showed a new band at 470 cm−1 which is due to the stretching vibration of Ti–O.43
C and C–H. These obvious changes in the wave number of PPTC, suggested that an interaction exists between PHT nanoparticles and PANI.40 The titanium present in PHT can form a coordination bond with the nitrogen atoms present in PANI macromolecules and hence the shift in the characteristic values of PANI in PPTC.41,42 The characteristic bands of clay observed at 3630 cm−1 (stretching vibration of the OH group of Mg–Al–OH) and broad band at 3454 cm−1 (stretching vibration of the water and hydroxyl group). The amount of water absorbed in clays is related to the deformation of H–O–H group 1640 cm−1. The bands at 1046 and 792 cm−1 are attributed to Si–O vibration. The bands at 528 and 462 cm−1 correspond to the deformation vibration of Si–O–Al and Si–O–Si, respectively. The shift in the absorption bands at 906 and 520 cm−1 may be caused by the exchange effects of the cations. The band at 906 cm−1 arises from the stretching vibration of Al–OH. Compared with clay, PHTC showed a new band at 470 cm−1 which is due to the stretching vibration of Ti–O.43
XRD analysis
X-Ray powder diffraction patterns of the PHT, clay, PHTC,PANI and PPTC are shown in Fig. 2a–e, respectively and the details of their d spacing with diffraction angles are listed in Table 2S (see ESI†). Generally, XRD patterns of clay exhibited two distinct types of reflections, general and basal. The general reflections are called the hk bands, which are asymmetrical lines with characteristic “sawtooth” type reflections. Such reflections are caused by the structures of the smectite layers themselves and are independent of external condition. The basal reflections (hkl) on the other hand have symmetrical peaks, whose positions vary with the separation between the layers. This separation depends on the nature of the cation present in the interlayer space, the amount of water, and so forth. The diffractogram of clay showed reflection peaks at 2θ = 7.2° (d001), 19.8° (d003), 21.9° (d004), 28.6° (d006), 35.3° (d007), 54.2° (d31, d15, d24), and 61.8° (d33, d06).44 The basal reflection peak at 2θ = 7.2° with a d spacing of 12.1 Å corresponds to the d001 basal spacing of the clay. The diffraction pattern of PHT exhibited peak at 2θ = 25.2° which confirms the (101) plane of the anatase phase of TiO2. The diffractogram of PHT also exhibited additional reflections peak at 2θ = 37.4° (004), 47.7° (200), 54.4° (105), 62.3° (204) and 67.6° (116) characteristics of the crystalline anatase structure of titanium dioxide (JCPD. no. 73–1764). The diffractogram of PHTC is shown in Fig. 2c, which exhibited peaks at lower angle 2θ = 5.8° corresponding to the (d001) spacing at 21.3 Å. The increased gallery spacing in the c-axis direction of clay corresponds to the dimension of the confined PHT nanoparticles. It was also observed that the nature of the peaks corresponding to d003 and d006 spacing become sharp and only a small incremental shift happened to these peaks due to the high charge of the ions present in these layers.45,46 The diffraction pattern of PANI showed broad reflections at 2θ = 20.1° and 25.8° which are due to the periodicity parallel and perpendicular to the PANI chains.47–49 The diffraction pattern of PPC showed weak reflection peaks at 2θ = 8.9°, 18.9°, 20.1°, 25.1°, 53.0° and 61.7° and the diffraction pattern of PPT exhibited reflection peaks at 2θ = 19.7°, 24.2°, 38.4°, 43.8°, 51.6° and 62.3° (not shown here). The diffraction pattern of PPTC showed reflections peaks at 2θ = 19.0°, 24.6°, 34.5°, 53.5°, 61.60° suggesting the presence of distorted anatase phase in PPTC. Moreover, the presence of peak at 2θ = 19.0° and 24.5° suggested the presence of slightly distorted PANI chains. This is due to the increased interaction among the clay, PANI and PHT present in PPTC.50,51 During polymerization, PANI is sandwiched between the clay layers and also it is surmounting upon the clay layers to form tubular structure which is confirmed by SEM and TEM analysis.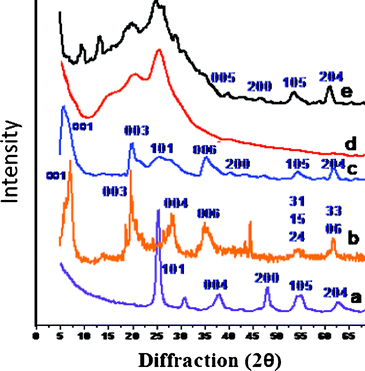 | ||
| Fig. 2 XRD of (a) PHT (b) clay (c) PHTC (d) PANI and (e) PPTC. | ||
Morphology
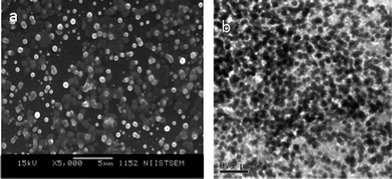
Morphological observations were made using SEM and TEM. SEM and TEM pictures of PHT are shown in Fig. 3a and 3b, respectively. It shows the spherical particles.SEM images of PPTC1, PPTC3, PPT and PHTC are shown Fig. 4a and 4d. At lower concentration of anilinium hydrochloride (PPTC1) nanotubes of 40 nm diameter and several micrometer lengths with dark and bright contrast are present. The dark portion indicates the presence of titanium adsorbed clay particles and the bright portion is due to PANI chains. The nanotubular structure is formed by the rolling of the self-assembled and co-structured PANI-PHTC. These are again engulfed by the self-assembled PANI layers. The SEM picture of PPTC3 also exhibited the same morphology with nanotubes having 50 nm diameter, which is due to the presence of more PANI content. PPT exhibited highly rigid rod like structure. The rod like structures might have formed by the self-assembled PPT layers. In PPT, the charged PHT is acting as a template and during polymerization; PANI is co-structuring with the PHT particles and rolled to form uniform highly oriented nanocylindrical structures. SEM pictures of PHTC is shown in Fig. 4d and it exhibited white spherical particles of PHT adsorbed on the surface of nano clay layers in an ordered fashion.
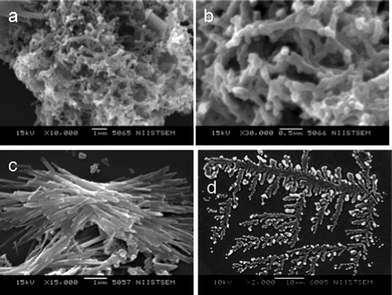 | ||
| Fig. 4 SEM images of (a) PPTC1 (b) PPTC3 (c) PPT and (d) PHTC. | ||
Further morphology was confirmed by TEM observation. TEM pictures of PPTC1, PPTC3, PPT and PHTC are shown in Fig. 5a–d, respectively. In TEM, PPTC1 also exhibited a nanotubular structure with dark and bright areas in the contrast image. The dark portion indicates the presence of clay and PHT particles, the bright portion is from the PANI layers. This contrast in the image is due to the difference in the intensity of the radiation when it is passing through the inorganic and organic moieties. The diameter of the nanotubes in PPTC1 and PPTC3 is observed to be 40 and 50 nm, respectively and is the same as measured during SEM observation.
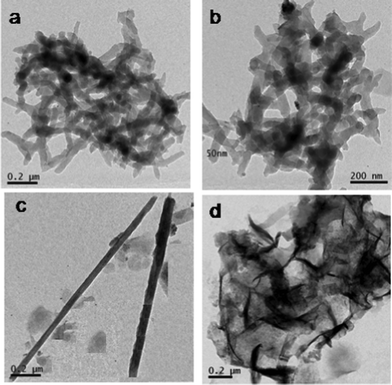 | ||
| Fig. 5 TEM images of (a) PPTC1 (b) PPTC3 (c) PPT and (d) PHTC. | ||
The TEM image of PPT exhibited a rigid nanorod morphology, which also matches the observation made during SEM analysis. PHTC exhibited spherical PHT particles confined inside the exfoliated clay layers. Further composition of PHT and PPTC is confirmed by analyzing TEM EDS spectra and is shown in Fig. 6a and 6b. The exhibited peaks correspond to Ti, Si, Al, C and N which confirmed the presence of all these elements in the PPTC nanocomposite.
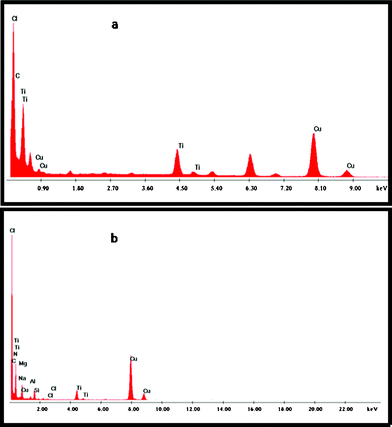 | ||
| Fig. 6 EDX of (a) PHT and (b) PPTC. | ||
Electrical conductivity measurements
The room temperature electrical conductivity of PPTC was measured using a four-probe conductivity meter. Details of the electrical conductivity measurements of PHT, PHTC, PANI, PPTC1, PPTC2, PPTC3 and PPTC4 containing different percentage of PHTC/PANI is shown in Table 1. PHT exhibited electrical conductivity of 1.8 × 10⁻⁴ S cm−1, PHTC (3.3 × 10⁻⁵ S cm−1). The decreased conductivity may be due to the presence of insulative clay layers present in PHTC. PANI showed conductivity of 3 × 10⁻³ S cm−1. Electrical conductivity of PPTC showed increase in conductivity 1.26 × 10⁻³ S cm−1 to 6.2 × 10⁻² S cm−1 with increasing PANI content in the system. Enhanced conductivity in PPTC with the increased amount of PANI might be due to the formation of a more efficient network for charge transport in the PPTC composites.51,52| Samples | PHTC![[thin space (1/6-em)]](https://www.rsc.org/images/entities/char_2009.gif) : :![[thin space (1/6-em)]](https://www.rsc.org/images/entities/char_2009.gif) PANI (%) PANI (%) |
Conductivity (S cm−1) | P.C.E M.Ba | P.C.E M.Ob |
|---|---|---|---|---|
| a P.C.E.M.B = Photocatalytic efficiency of methylene blue. b P.C.E.M.O = Photocatalytic efficiency of methylene blue. | ||||
| PHT | 100![[thin space (1/6-em)]](https://www.rsc.org/images/entities/char_2009.gif) : :![[thin space (1/6-em)]](https://www.rsc.org/images/entities/char_2009.gif) 0 0 |
1.8 × 10⁻⁴ | 34.3 | 64.5 |
| PANI | 0![[thin space (1/6-em)]](https://www.rsc.org/images/entities/char_2009.gif) : :![[thin space (1/6-em)]](https://www.rsc.org/images/entities/char_2009.gif) 100 100 |
3.0 × 10⁻³ | 43.1 | 67.6 |
| PHTC | 100![[thin space (1/6-em)]](https://www.rsc.org/images/entities/char_2009.gif) : :![[thin space (1/6-em)]](https://www.rsc.org/images/entities/char_2009.gif) 0 0 |
3.3 × 10⁻⁵ | 51.2 | 80.4 |
| PPTC1 | 15![[thin space (1/6-em)]](https://www.rsc.org/images/entities/char_2009.gif) : :![[thin space (1/6-em)]](https://www.rsc.org/images/entities/char_2009.gif) 85 85 |
1.26 × 10⁻³ | 90.4 | 97.2 |
| PPTC2 | 10![[thin space (1/6-em)]](https://www.rsc.org/images/entities/char_2009.gif) : :![[thin space (1/6-em)]](https://www.rsc.org/images/entities/char_2009.gif) 90 90 |
8.2 × 10⁻³ | 91.6 | 98.1 |
| PPTC3 | 5![[thin space (1/6-em)]](https://www.rsc.org/images/entities/char_2009.gif) : :![[thin space (1/6-em)]](https://www.rsc.org/images/entities/char_2009.gif) 95 95 |
2.1 × 10⁻² | 92.1 | 98.9 |
| PPTC4 | 1![[thin space (1/6-em)]](https://www.rsc.org/images/entities/char_2009.gif) : :![[thin space (1/6-em)]](https://www.rsc.org/images/entities/char_2009.gif) 99 99 |
6.2 × 10⁻² | 94.3 | 99.6 |
Photocatalytic activities
Photocatalytic activity of PPTC, PHTC, PANI and PHT were studied by photocatalytic decolorization studies of methylene blue and methyl orange under natural light irradiation. Photocatalytic decolorization efficiency of the catalyst was monitored by performing UV-visible spectral studies at different intervals of time. The absorption spectra of PHT, PANI, PHTC and PPTC in presence of MO are given in Fig. 7a–d, respectively. Generally, all the samples exhibited two bands at 270 nm and 464 nm. The initial band at 270 nm corresponds to the aromatic ring and the band at 464 nm related to the azo group present in the MO. It has been observed that band at 270 nm in PHT and PHTC remains intact. However, in the presence of PANI, the band at 270 nm is distorted, and it is absent in the presence of PPTC. Furthermore, the band observed at 464 nm in MO showed a red shift to 497 nm in (PHT), 469 nm in (PHTC), 508 nm in (PANI) and 510 nm in (PPTC). The high extent of red shift observed in PPTC compared with other samples is due to greater interaction of the azo group with the electrons present in PPTC. The photographs showing the decrease in color intensity with time is shown in Fig. 7 (inset snap shot). Photocatalytic degradation efficiency of these materials for MO is calculated and is shown in Table 1.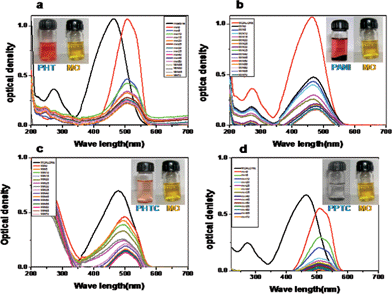 | ||
| Fig. 7 The UV-vis spectra of methyl orange in presence of (a) PHT (b) PANI (c) PHTC and (d) PPTC at different time intervals. | ||
The degradation efficiency was observed in the order PHT (64.5%) < PANI (67.6%) < PHTC (80.4%) and PPTC (99.6%) after 70 min. The curves showing plot of ln (C/C0) vs. time for MO, PHT, PANI, PHTC and PPTC are shown in Fig. 8.
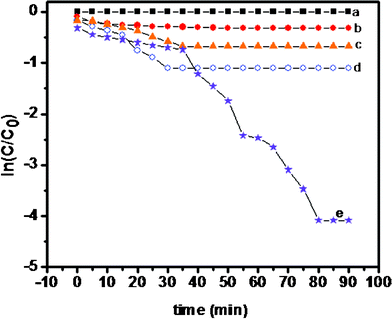 | ||
| Fig. 8 Photocatalytic degradation of methyl orange (a) blank (b) PHT (c) PANI (d) PHTC and (e) PPTC. | ||
The photocatalytic degradation reaction was calculated as a first order reaction. The reaction rate order was found to be [PPTC (0.04467 min−1) > PHTC (0.0315 min−1) > PANI (0.0212 min−1) > PHT (0.0037 min−1)] is given in Table 3S (see ESI†).
The absorption spectrum of PHT, PANI, PHTC and PPTC in presence of MB is given in Fig. 9a–d, respectively. UV-Visible spectra of MB exhibited three bands at 240 nm 296 nm and 665 nm. Generally, the absorption intensity of all the bands showed a decrease in intensity with time. The photographs showing the decrease in color intensity with time is shown in Fig. 9 (inset snap shot). Photocatalytic degradation efficiency of these materials for MB is calculated and given in Table 1. The degradation efficiency was observed in the order PHT (34.3%) < PANI (43.1%) < PHTC (51.2%) and PPTC (94.3%) after 120 min. The curve showing a plot of ln(C/C0) vs. time for PHT, PANI, PHTC and PPTC is shown in Fig. 10. The photocatalytic degradation reaction was calculated as a first order reaction. By plotting ln(C/C0) as a function of irradiation time, the rate constant k is taken from the slope of the line and the values are given Table 3S (see ESI†). The decolorization rate was found to be in the order [PPTC (0.0152 min−1) > PHTC (0.00930 min−1) > PANI (0.00634 min−1) > [PHT (0.0007 min−1)] is given in Table 3S (see ESI†).
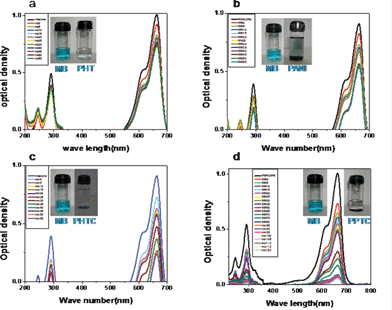 | ||
| Fig. 9 The UV-vis spectra of methylene blue in the presence of (a) PHT (b) PANI (c) PHTC and (d) PPTC at different time intervals. | ||
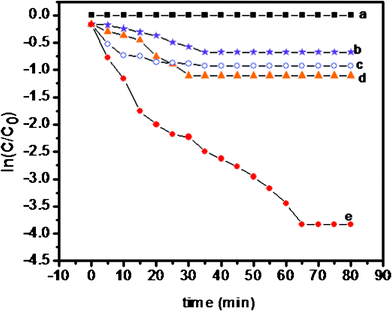 | ||
| Fig. 10 Photocatalytic degradation of methylene blue (a) blank (b) PHT (c) PANI (d) PHTC and (e) PPTC. | ||
The mechanism for the photodegradation of MB and MO in presence of PPTC can be explained as per the schematic representation given in Scheme 2. When PPTC is illuminated under natural light, both PHTC and PANI absorb photons and then charge separation occurs at the interface. The conduction band of PHTC and the lowest unoccupied molecular orbital (LUMO) level of PANI are well matched for the charge transfer. The generated electrons from PANI can be transferred to the conduction band of PHTC, whereas holes in the valence band of PHTC are transferred into the PANI, and enhancement in the charge separation occurs and promoting the photocatalytic activity of photocatalyst. It is well-known that surface Ti–OH groups play an important role in enhancing the activity of PHT photocatalysts.53 They are considered to have two effects on enhancing the photocatalytic activity. The Ti–OH groups are effective traps for the photogenerated holes, reducing their recombination with the electrons, and the surface OH groups allow the adsorption of O2 from water. Then, the photoformed electrons reduce O2 to O2− species, which in turn can interact with water to form further oxygenated radicals (mainly hydroxyl radicals •OH). Consequently, the presence of Ti–OH groups may improve the photocatalytic activity of PPTC by both photooxidation and photosensitizing mechanisms. Under the same conditions, adsorption of MB and MO on PPTC sample in the dark condition was studied. The results showed that dye is not decolourised even after 70 min, and the decolourisation efficiency of MB is only about 3% and MO is 5% which does not change with the further increase of the time. By comparison of the degradation efficiency values of MB and MO with and without natural light, it can be confirmed that the decolourisation is due to photocatalytic degradation but not adsorption.
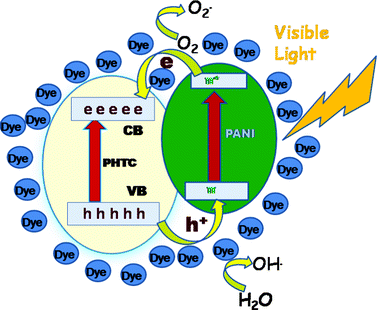 | ||
| Scheme 2 Mechanism for the photodegradation of dye in the presence of PPTC. | ||
To evaluate the reusability of the PPTC catalyst several photocatalytic degradation runs of methyl orange and methylene blue were completed under visible light. After the first run, the catalyst was separated and used immediately for further runs without any treatment. The results show that after eight recycles for the photodegradation of methyl orange and methylene blue, the activity of PPTC catalyst did not exhibit any significant loss of activity. It indicates that the PPTC composites have high stability and reusability. Moreover, the PPTC photocatalyst had an advantage over the pure PHT. They had good sedimentation ability and could decant in a few minutes by gravity sedimentation. All the nanocomposites settled on the bottom of a cylinder within 15 min, whereas pure PHT did not settle even after 2 h. Thus the easy sedimentation and reusability of PPTC implies that it is potentially employable for practical applications under mild conditions such as natural light and ambient temperature.
Thermal stability
Thermal stability of PHT, clay, PPTC and PANI were studied by thermogravimetry at a heating rate of 10 °C min−1 under nitrogen atmosphere. TG curves of PHT, clay, PPTC and PANI are shown in Fig. 5Sa–d, respectively (see ESI†). The TG curve of PHT showed a small weight loss below 300 °C which can be ascribed due to the elimination of water and partial dehydroxylation of the PHT nanoparticle. TGA curve of PANI showed two decomposition stages and the first loss observed at around 80 °C can be ascribed to the expulsion of water and volatile impurities, and the second loss starting from 250 °C may be due to the decomposition of the PANI backbone. TG curve of PPTC showed a hike in the second-stage decomposition temperature to 420 °C. The enhanced thermal stability exhibited by the PPTC nanocomposites compared to bulk PANI can be due to the synergetic contribution of insulative clay layers and existence of a strong interaction between PANI and PHT nanoparticles. The temperature at which maximum mass loss occurred was observed from differential thermogravimetric analysis as shown in Fig. 6S (see ESI†). In DTG, PANI exhibited a decomposition peak at around 270 °C, while PPTC showed decomposition at around 456 °C, revealing higher thermal stability for PPTC.Thermal phase transition changes of PANI and PPTC were studied by DSC at a heating rate of 10 °C min−1 under nitrogen atmosphere is shown in Fig. 7S (see ESI†). PANI exhibited an endothermic transition temperature at 131 °C, while PPTC exhibited two endothermic peaks centered at 98 °C and 270 °C. Upon heating, PPTC undergoes a change in energy that may arise from two factors. The first transition arises from the conformational change occurring due to the hydrogen-bonded interaction among the protonated PANI-PANI chains. The second transition might be from the guest-host interaction between protonated PANI chains, PHT, and the clay. Thus, the non-covalent interaction among PANI-PANI, PHT-PANI, and clay-PANI could be manifested from the studies made by DSC analysis.
Conclusion
Photocatalytic PPTC nanocomposite was prepared by the polymerization of anilinium hydrochloride in presence of polytitanate ion at room temperature by a facile one step strategy. Studies showed that PPTC forms electrically conductive nanotubes through a template/self-assembly process. The photocatalytic effect of PPTC for methyl orange and methylene blue were studied under visible light irradiation. Due to the photooxidation and photosensitizing mechanisms between PANI and PHTC, a rapid charge separation and slow recombination occurs in the PPTC nanocomposite. The heterojunction built between PHTC and PANI transfers the excited electrons to the conduction band of PHTC and hole transferring to the valency band of PANI which in turn increases the yield of hydroxyl, super oxide and positive carbon radicals. Studies revealed that this multifunctional PPTC nanocomposite with higher photocatalytic efficiency will be a potential candidate for environmental purification under visible light at ambient conditions. This low cost environmentally benign PPTC composite prepared in this work may find other applications in catalysis, sensors and photovoltaic fields.Acknowledgements
We thank CSIR Net work project (NWP-23) for the financial support. We also would thank Dr Suresh Das, Director, NIIST, TVM and Dr A. Ajayaghosh, Dean AcSIR, NIIST, TVM for their constant encouragement and support. We are also thankful to P. Guruswamy, M. Chandran and Kiran Mohan for XRD, SEM and TEM analysis.References
- J. Tang, Y. Wu, E. W. McFarland and G. D. Stucky, Chem. Commun., 2004, 1670 RSC.
- Y. Cho, W. Choi, C. H. Lee, T. Hyeon and H. I. Lee, Environ. Sci. Technol., 2001, 35, 2988 CrossRef.
- K. Iuchi, Y. Ohko, T. Tatsuma and A. Fujishima, Chem. Mater., 2004, 16, 1165 CrossRef CAS.
- B. O'Regan and M. Gratzel, Nature, 1991, 353, 737 CrossRef CAS.
- H. X. Li, J. X. Li and Y. N. Huo, J. Phys. Chem. B, 2006, 110, 1559 CrossRef CAS.
- J. G. Yu, M. H. Zhou, B. Cheng and X. J. Zhao, J. Mol. Catal. A: Chem., 2006, 246, 176 CrossRef CAS.
- M. S. Wong, H. P. Chou and T. S. Yang, Thin Solid Films, 2006, 494, 244 CrossRef CAS.
- M. R. Hoffmann, S. T. Martin, W. Choi and D. Bahnemann, Chem. Rev., 1995, 95, 69 CrossRef CAS.
- S. M. Sun, Y. S. Jiang, L. X. Yu, F. F. Li, Z. W. Yang, T. Y. Hou, D. Q. Hu and M. S. Xia, Mater. Chem. Phys., 2006, 98, 377 CrossRef CAS.
- C. Ooka, H. Yoshida, K. Suzuki and T. Hattori, Appl. Catal., A, 2004, 260, 47 CrossRef CAS.
- C. Ooka, S. Akita, Y. Ohashi, T. Horiuchi, K. Suzuki, S. Komai, H. Yoshida and T. Hattori, J. Mater. Chem., 1999, 9, 2943 RSC.
- G. Zhang and X. M. Ding, Langmuir, 2008, 24, 1026 CrossRef CAS.
- C. Volzone, Mater. Res., 2009, 12, 191 CrossRef CAS.
- X. P. Zhao and L. Q. Xiang, J. Mater. Chem., 2003, 13, 1529 RSC.
- (a) T. Guo and L. Wang, J. Phys. Chem. B, 2010, 114, 4765 CAS; (b) S. Yoda, Y. Sakurai, A. Endo, T. Miyata, K. Otake, H. Yanagishita and T. Tsuchiya, Chem. Commun., 2002, 14, 1526 RSC.
- R. Q. Long and R. T. Yang, J. Catal., 1999, 186, 254 CrossRef CAS.
- N. N. Binitha and S. Sugunan, Microporous Mesoporous Mater., 2006, 93, 82 CrossRef CAS.
- J. Sterte, Clays Clay Miner., 1986, 34, 658 CAS.
- B. I. Nabivanets and L. N. Kudritskaya, Russ. J. Inorg. Chem., 1967, 12, 616 Search PubMed.
- F. B. Baes and R. E. Mesmer, The hydrolysis of cations, Wiley, New York, 1976, p. 147 Search PubMed.
- H. Einaga, J. Chem. Soc., Dalton Trans., 1979, 12, 1917 RSC.
- V. P. S. Pereraa, P. K. D. D. P. Pitigala, M. K. I. Senevirathne and K. Tennakone, Sol. Energy Mater. Sol. Cells, 2005, 85, 91 Search PubMed.
- M. Iwasaki, M. Hara, H. Kawada, H. Tada and S. Ito, J. Colloid Interface Sci., 2000, 224, 202 CrossRef CAS.
- C. Ooka, H. Yoshida, K. Suzuki and T. Hattori, Microporous Mesoporous Mater., 2004, 67, 143 CrossRef CAS.
- H. Zhang, R. Zong, J. Zhao and Y. Zhu, Environ. Sci. Technol., 2008, 42, 3803 CrossRef CAS.
- A. Pron and P. Rannou, Prog. Polym. Sci., 2002, 27, 135 CrossRef CAS.
- G. Gustafsson, Y. Cao, G. M. Treacy, F. Klavetter, N. Colaneri and A. J. Heeger, Nature, 1992, 357, 477 CrossRef CAS.
- M. J. Sailor, E. J. Ginsburg, C. B. Gorman, A. Kumar, H. Grubbs and N. S. Lewis, Science, 1990, 249, 1146 CAS.
- S. H.Jang, M. G. Han and S. S. I, Synth. Met., 2000, 110, 17 CrossRef.
- S. S. Ran and M. Biswas, Synth. Met., 2000, 108, 231 CrossRef.
- Y. J. He, Mater. Chem. Phys., 2005, 92, 134 CrossRef CAS.
- R. V. Kumar, Y. Diamant and A. Gedanken, Chem. Mater., 2000, 12, 2301 CrossRef CAS.
- J. Li, L. Zhu, Y. Wu, Y. Harima, A. Zhang and H. Tang, Polymer, 2006, 47, 7361 CrossRef CAS.
- S. Min, F. Wang and Y. Han, J. Mater. Sci., 2007, 42, 9966 CrossRef CAS.
- J. Ruokolainen, H. Eerikainen, M. Torkkeli, R. Serimaa, M. Jussila and O. IKkala, Macromolecules, 2000, 33, 9272 CrossRef CAS.
- R. Lv, S. Zhang, Q. Shi and J. Kan, Synth. Met., 2005, 150, 115 CrossRef.
- V. L. Reena, J. D. Sudha and C. Pavithran, J. Appl. Polym. Sci., 2009, 113, 4066 CrossRef CAS.
- Q. Wu, Z. Xue, Z. Qi and F. Wang, Polymer, 2000, 41, 2029 CrossRef CAS.
- Hesheng Xia and Qi Wang, Chem. Mater., 2002, 14, 2158 CrossRef CAS.
- L. J. Zhang and M. X. Wan, J. Phys. Chem. B, 2003, 107, 6748 CrossRef CAS.
- X. W. Li, G. C. Wang, X. X. Li and D. M. Lu, Appl. Surf. Sci., 2004, 229, 395 CrossRef CAS.
- P. R. Somani, R. Marimuthu, U. P. Mulik, S. R. Sainkar and D. P. Amalnerkar, Synth. Met., 1999, 106, 45 CrossRef CAS.
- J. Liu, X. Li, S. Zuo and Y. Yu, Appl. Clay Sci., 2007, 37, 275 CrossRef CAS.
- B. E. Warren, Phys. Rev., 1941, 59, 693 CrossRef CAS.
- O. Elvira Alonso and C. Brime, Clays and Clay Miner., 1990, 38, 257 Search PubMed.
- P. Yuan, X. L. Yin, H. P. He, D. Yang, L. J. Wang and J. X. Zhu, Microporous Mesoporous Mater., 2006, 93, 240–247 CrossRef CAS.
- W. Feng, E. Sun, A. Fujii, H. C. Wu, K. Niihara and K. Yoshino, Bull. Chem. Soc. Jpn., 2000, 73, 2627 CrossRef CAS.
- L. J. Zhang and M. X. Wan, Adv. Funct. Mater., 2003, 13, 815 CrossRef CAS.
- F. G. Cheng, W. Tang, C. S. Li, J. Chen, H. K. Liu and P. W. Shen, Chem.–Eur. J., 2006, 12, 3082 CrossRef CAS.
- D. C. Schnitzler, M. S. Meruvia, I. A. Hummelgen and A. J. G. Zaberin, Chem. Mater., 2003, 15, 4658 CrossRef CAS.
- W. Jia, E. Segal, D. Kornemandel, Y. Lamhot, M. Narkis and A. Siegmann, Synth. Met., 2002, 128, 115 CrossRef CAS.
- S. J. Su and N. Kuramoto, Synth. Met., 2000, 114(2), 147 CrossRef CAS.
- F. Y. Chuang and S. M. Yang, Synth. Met., 2005, 152, 361 CrossRef CAS.
Footnote |
| † Electronic supplementary information (ESI) available: DLS diagrams of PHT, Z-potential measurements for PHT and PHTC, UV-visible spectra of PPTC, PPT, PPC, PANI, FT-IR spectra of PPTC, PANI, PPT, PPC, PHT, PHTC and clay, TGA, DTA, and DSC spectra for composite samples. Table 1S: Surface area analysis, Table 2S: Details of the X-ray diffraction studies and Table 3S: Photodegradation reaction rate constant of methyl orange and methylene blue. See DOI: 10.1039/c2ra20613g |
| This journal is © The Royal Society of Chemistry 2012 |

