Well-dispersed palladium nanoparticles on graphene oxide as a non-enzymatic glucose sensor†
Qiyu
Wang
,
Xiaoqiang
Cui
*,
Jianli
Chen
,
Xianliang
Zheng
,
Chang
Liu
,
Tianyu
Xue
,
Haitao
Wang
,
Zhao
Jin
,
Liang
Qiao
and
Weitao
Zheng
*
Department of Materials Science, Key Laboratory of Automobile Materials of MOE and State Key Laboratory of Superhard Materials, Jilin University, Changchun, 130012, People's Republic of China. E-mail: xqcui@jlu.edu.cn (XQ Cui); wtzheng@jlu.edu.cn (WT Zheng); Fax: +86-431-85155279; Tel: +86-431-85155279
First published on 25th April 2012
Abstract
Palladium nanoparticles with excellent uniform size and even distribution were prepared on graphene oxide (Pd NPs/GO) by using a simple and environmentally-friendly ultrasonic method in an ice bath. Ultrasonication time and composition ratios of GO and Pd influenced the morphology of the palladium nanoparticles and their electrocatalytic performance. Transmission electron microscopy (TEM) and electrochemical characterization demonstrated that GO acted as a good supportive substrate for controlling the size and activity of palladium nanoparticles. The optimized nanocomposite exhibited high electrochemical activity for electrocatalytic oxidation of glucose in alkaline medium. The Pd NPs/GO nanocomposite was developed as a non-enzymatic biosensor for the determination of glucose with a linear range of 0.2–10 mM, which is nearly insusceptible to common electroactive interfering species. This simple and effective composite platform could potentially be extended to other metal/graphene nanomaterials, and have broad applications in biosensing, fuel cells, and other fields.
1 Introduction
The quick and effective determination of glucose is of considerable interest in many areas including the food industry, clinical diagnostics, and biotechnology.1,2 In the past few decades, electrochemical non-enzymatic biosensors have been considered as one of the most popular and effective techniques for glucose detection due to their advantages in terms of simplicity, portability, short response time, sensitivity, and high selectivity by substrate specificity.3–5 The materials for direct electrocatalytic oxidation of glucose mostly are metals, such as platinum,6 gold,7,8 palladium,9,10 nickel,11 platinum–lead alloy12,13 and gold–lead alloy.14,15Recently, Pd and Pd-based nanostructures and alloys with excellent catalytic performance have attracted considerable attention in many fields, including for use in glucose detection.9,16 In order to further improve the performance of the non-enzymatic glucose sensors, different alloys and metals or metal oxides with low-dimensional carbon materials have been hybridized to take advantage of the synergistic effects of multi-component surface compositions.10,17 The emergence of graphene has opened a new avenue for utilizing 2D carbon materials as an ideal substrate for growing and anchoring metal-based materials.18,19
In this work, by introducing the ultrasonic method, we developed a simple procedure for preparing Pd/graphene nanocomposites with uniform size, even dispersion and high electrocatalytic activity. The sonication is effective for the formation of uniform sized Pd nanoparticles on the active sites of GO surfaces. The nanocomposites were analyzed with transmission electron microscopy (TEM), X-ray diffraction (XRD) and atomic force microscopy (AFM) techniques. The results showed that the morphology and catalytic performance could be controlled by changing the time of ultrasonic exposure and the ratios of composition. A non-enzymatic glucose sensor in alkaline solution is constructed by using as-prepared Pd NPs/GO nanostructures. This electrochemical amperometric glucose sensor possesses high sensitivity, fast response, and good selectivity for interfering reagents. This simple method can be extended to other metal/graphene nanomaterials, and could have broad potential applications in biosensing, fuel cells, and other fields.
2 Experimental
2.1 Apparatus and reagents
KQ-800KDE Ultrasonic Cleaner (Kunshan Co. LTD, China) was used to prepare samples. Transmission electron-microscopy (TEM) images were taken with a Tecnai F20 transmission electron microscope (FEI Co., Japan). Atomic force microscopy (AFM) images were performed by Bruker Dimension Icon scanning probe microscope (Bruker Co., Germany). X-Ray diffraction (XRD) patterns were obtained by using a Bragg-Brentano diffractometer (D8-tools), and the source was a Cu-Kα line at 0.15418 nm. The cyclic voltammetric and amperometric measurements were carried out on a CHI650D electrochemical workstation (Shanghai, Chenhua Co., China). A three-electrode cell was used with the modified glassy carbon electrode (GCE) as the working electrode, a saturated calomel electrode (SCE) as the reference electrode and a platinum foil electrode as the counter electrode.Nafion-ethanol solution was obtained from Adamas-beta Chemical Co (Switzerland) and graphite was from Alfa Aesar Co (USA). H2PdCl4 aqueous solution was prepared from hydrochloric acid (HCl) aqueous solution and palladium bichloride (PdCl2), which were purchased from Chinese Shanghai Regent Co (China). Sodium hydroxide (NaOH), D-(+)-glucose and all other reagents were of analytical grade and obtained from Beijing Regent Co (China). 0.1 M NaOH solution was used as the supporting electrolyte. Deionized water was used throughout the experiments.
2.2 The preparation of graphene oxide
GO was made by a modified Hummer's method.20,21 2.0 g of graphite powders were dissolved in the mixture of concentrated H2SO4 and NaNO3 under stirring. A strong oxidant, KMnO4, was added into the reaction container gradually under stirring in an ice bath for 2 h. The mixture was then kept at room temperature with stirring for another 96 h. Dilute sulfuric acid (5 wt%) and hydrogen peroxide were added into the reaction system. The mixture was then centrifuged and washed with dilute HCl aqueous solution and deionized water, and then dried at room temperature. Graphite oxide was obtained by drying the precipitate at room temperature. 200 mg of as-made graphite oxide powder was dispersed in 800 ml of deionized water. The graphite oxide dispersion was treated with ultrasonic (400 W) for about 2 h to exfoliate into single layer of graphene oxide. The supernatant was collected for the next procedure.2.3 The preparation of Pd NPs/GO
Typically, 2 ml of GO dispersion and 8 ml of deionized water were mixed in a reaction container with 2 min of sonication for suspension. Then, 0.1 ml of H2PdCl4 (56.4 mM) was rapidly added into the container in ice bath with ultrasonic (100 W) for 20 min (Scheme 1).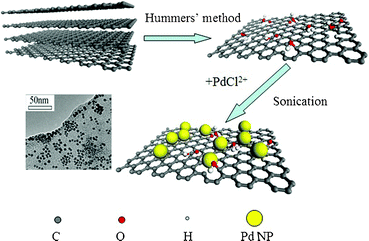 | ||
| Scheme 1 Procedure to prepare Pd NPs/GO nanocomposites using ultrasonic method. | ||
2.4 The preparation of Pd NPs/GO modified electrode
A glassy carbon electrode (GCE, 3 mm in diameter, CH Instruments) was polished sequentially with 1, 0.3 and 0.05 μm Al2O3, and then dried at room temperature. 8 μL of as-prepared Pd NPs/GO suspension was dropped onto the GCE surface and subsequently dried under vacuum for 4 h at room temperature. 4 μL of Nafion (0.5%) was used to cover the surface of the electrode for current-time dynamic detection. All electrochemical characterizations were accomplished in the solutions with nitrogen saturation.3 Results and discussion
3.1 Characterization of graphene oxide, and Pd NPs/GO nanocomposites.
The morphology and structure of as-prepared GO were characterized by TEM, XRD and AFM in Fig. 1. The TEM images show some single layers of GO with flake shapes. In the XRD patterns (Fig. 1G), the disappearance of the graphite peak at 26° and the appearance of the peak at 10° confirmed the formation of graphite oxide20. The morphology and thickness of single layer of GO nanosheets were also measured by AFM. The thickness of GO obtained from the height profile analysis of the AFM image is about 0.8 nm, which is consistent with previous reports.22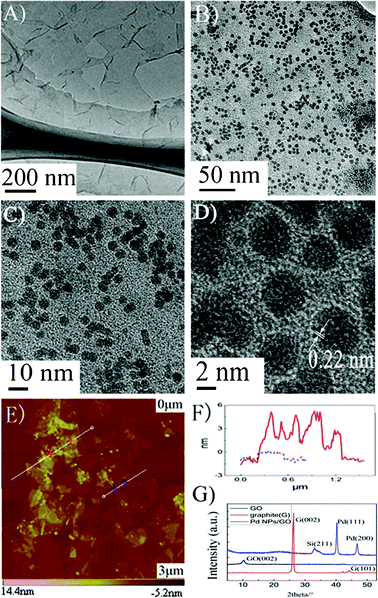 | ||
Fig. 1 Characterization of GO and Pd NPs/GO nanocomposites prepared using volume ratio of 20![[thin space (1/6-em)]](https://www.rsc.org/images/entities/char_2009.gif) : :![[thin space (1/6-em)]](https://www.rsc.org/images/entities/char_2009.gif) 1 of GO and Pd by ultrasonic reaction of 15 min: A–C) TEM images of GO and Pd NPs/GO: D) HRTEM image of Pd NPs/GO: E) AFM topography image of Pd NPs/GO: F) AFM height profile of Pd NPs/GO on mica: G) XRD image of graphite, graphite oxide and Pd NPs/GO nanocomposites. 1 of GO and Pd by ultrasonic reaction of 15 min: A–C) TEM images of GO and Pd NPs/GO: D) HRTEM image of Pd NPs/GO: E) AFM topography image of Pd NPs/GO: F) AFM height profile of Pd NPs/GO on mica: G) XRD image of graphite, graphite oxide and Pd NPs/GO nanocomposites. | ||
Well-dispersed Pd nanoparticles decorated on GO surfaces could be obtained by simple ultrasonic processing of a mixture of H2PdCl4 and GO aqueous solution. The most significant feature is that the Pd NPs with a uniform size (∼4.25 nm) are well mono-dispersed on the surfaces of GO (as shown in Fig. 1B–D).
According to the information of from the HRTEM image, the inter-planar spacing of the particle lattice is 0.22 nm, which is consistent with the (111) lattice spacing of face-centered cubic Pd.23 The AFM image and height profile analysis (Fig. 1E, F) show that the thickness of the as-synthesized nanocomposite is about 6 nm, which is consistent with the sum of Pd diameter of 4.5 nm and GO thickness of 0.8 nm. The XRD pattern of Pd NPs/GO (Fig. 1G) shows diffraction peaks at 40.24° and 46.76°, which can be indexed to the crystalline planes (111) and (200) of center faced cubic structures of Pd.24
In order to get a clear vision of the effect of the ratio of GO and PdCl2−, TEM images of the hybrids with different ratios of the raw materials were obtained. Pd nanoparticles tend to aggregate on the GO surface due to the lack of a supportive substrate in a volume ratio of 10![[thin space (1/6-em)]](https://www.rsc.org/images/entities/char_2009.gif) :
:![[thin space (1/6-em)]](https://www.rsc.org/images/entities/char_2009.gif) 1 of GO and Pd (Fig. 2A). Pd NPs are well mono-dispersed on GO surfaces by increasing the ratios of GO (20
1 of GO and Pd (Fig. 2A). Pd NPs are well mono-dispersed on GO surfaces by increasing the ratios of GO (20![[thin space (1/6-em)]](https://www.rsc.org/images/entities/char_2009.gif) :
:![[thin space (1/6-em)]](https://www.rsc.org/images/entities/char_2009.gif) 1, Fig. 2B). As the ratio of GO increases (40
1, Fig. 2B). As the ratio of GO increases (40![[thin space (1/6-em)]](https://www.rsc.org/images/entities/char_2009.gif) :
:![[thin space (1/6-em)]](https://www.rsc.org/images/entities/char_2009.gif) 1, Fig. 2C), the size of Pd NPs is obviously decreased. Ultrasonic time is another factor that affects the morphology of Pd NPs. Three nanohybrids were prepared at different ultrasonic time of 10, 15, and 20 min. The corresponding TEM images are shown in Fig. 3. Well-dispersed nanoparticles with smaller sizes of 2.5 nm are observed at 10 min, indicating the nucleation process happened very fast. The average diameter of Pd NPs increases to 4.25 nm with 15 min of sonication. With 20 min of sonication, the size of Pd NPs slightly increases to 4.5 nm with aggregation presented.
1, Fig. 2C), the size of Pd NPs is obviously decreased. Ultrasonic time is another factor that affects the morphology of Pd NPs. Three nanohybrids were prepared at different ultrasonic time of 10, 15, and 20 min. The corresponding TEM images are shown in Fig. 3. Well-dispersed nanoparticles with smaller sizes of 2.5 nm are observed at 10 min, indicating the nucleation process happened very fast. The average diameter of Pd NPs increases to 4.25 nm with 15 min of sonication. With 20 min of sonication, the size of Pd NPs slightly increases to 4.5 nm with aggregation presented.
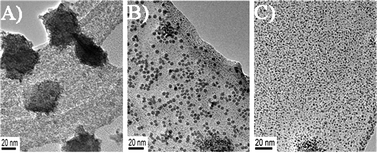 | ||
Fig. 2 TEM images of Pd NPs/GO prepared at different volume ratios of A) 10![[thin space (1/6-em)]](https://www.rsc.org/images/entities/char_2009.gif) : :![[thin space (1/6-em)]](https://www.rsc.org/images/entities/char_2009.gif) 1, B) 20 1, B) 20![[thin space (1/6-em)]](https://www.rsc.org/images/entities/char_2009.gif) : :![[thin space (1/6-em)]](https://www.rsc.org/images/entities/char_2009.gif) 1, C) 40 1, C) 40![[thin space (1/6-em)]](https://www.rsc.org/images/entities/char_2009.gif) : :![[thin space (1/6-em)]](https://www.rsc.org/images/entities/char_2009.gif) 1 between GO and Pd. Reaction time: 15 min. 1 between GO and Pd. Reaction time: 15 min. | ||
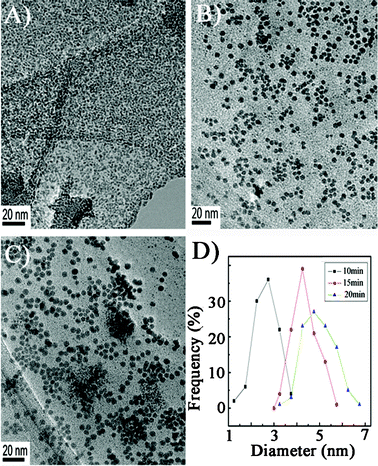 | ||
Fig. 3 TEM images (A: 10 min; B: 15 min; C: 20 min) and the distribution of particle size of Pd NPs/GO prepared at different ultrasonic time. Volume ratios of GO and Pd: 20![[thin space (1/6-em)]](https://www.rsc.org/images/entities/char_2009.gif) : :![[thin space (1/6-em)]](https://www.rsc.org/images/entities/char_2009.gif) 1. 1. | ||
3.2 Electrochemical characterization of as-synthesized nanocomposites
The electrochemical catalytic activity of the nanocomposites was investigated by cyclic voltammogram (CV) technique on Pd NPs/GO modified electrodes. The CVs of a typical Pd NPs/GO electrode in 0.1 M NaOH solution are presented in Fig. 3A. Two anodic peaks are observed at −0.17 V and 0.48 V during the positive scan in the presence of glucose. The peak at −0.17 V should be due to the electro-absorption of glucose to form the intermediate and per glucose molecule one proton is lost in this electrochemical reaction. The accumulation of the intermediate inhibits the further electrooxidation of glucose on the electrode surface, resulting in a decrease of the current. When the applied potential is increased higher than 0.35 V, Pd–OH species are formed. The poisoning intermediates produced from the electro-absorption of glucose would be oxidized by Pd–OH. Therefore, free active Pd NP sites are restored, resulting in an increase of current. The current decrease at higher applied potential with respect to the peak at 0.48 V could be due to the formation of the Pd oxide. In the negative scan, two peaks are presented in the curve. Due to the oxidation of Pd NPs, the glucose could not be oxidized in the range of 0.70 to −0.25 V. With the continuing negative scan, the Pd oxide was reduced to renew the Pd NP active sites, resulting in a new peak at −0.43 V. The accumulation of the intermediate again occurred, inducing a current decrease. The Pd NPs/GO modified electrode exhibited a typical voltammetric responses for glucose in Fig. 3B, suggesting that Pd NPs play a key role in the CV feature. Similar phenomena have also been observed on Pd/CNTs hybrid-modified electrodes.10The electrochemical catalytic performances of the Pd NPs/GO nanocomposites prepared with different volume ratios and different ultrasonic time were also investigated, as shown in Fig. S2† and Fig. S3†, respectively. The results showed that the excellent electrocatalytic performance could be obtained under the optimized parameter of a volume ratio of 20![[thin space (1/6-em)]](https://www.rsc.org/images/entities/char_2009.gif) :
:![[thin space (1/6-em)]](https://www.rsc.org/images/entities/char_2009.gif) 1 with an ultrasonic time of 15 min.
1 with an ultrasonic time of 15 min.
3.3 Amperometric sensing of glucose
The current responses measured under different concentrations of the glucose at a given potential is a significant factor in evaluating an amperometric sensor. We studied the amperometric response of the optimized Pd NPs/GO nanocomposite modified electrode at two working potentials of 0.4 V (Fig. 4C) and −0.1 V (Fig. S4†). With the successive additions of glucose (1 mM), the response increased immediately and reached 95% of the steady state value within ∼2 s. The current density at 0.4 V is higher than that at −0.1 V. At a detection potential of 0.4 V, the amperometric signal shows a linear correlation to glucose concentration in the range of 0.2–10 mM with a correlation coefficient of 0.9897, which is broader than that detected at the potential of −0.1 V (Fig. S5†). This detection range is broader than previous reports of 1.0–10.0 mM using nanoporous Pt 25 and 0.05–5.0 mM using CuS nanotubes.26 The response current remains at 80% after two weeks storage in the refrigerator.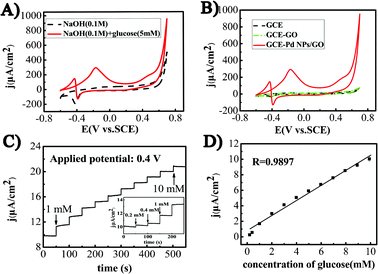 | ||
Fig. 4 A) CVs of as-synthesized Pd NPs/GO (reaction time: 15 min; volume ratio of GO and Pd: 20![[thin space (1/6-em)]](https://www.rsc.org/images/entities/char_2009.gif) : :![[thin space (1/6-em)]](https://www.rsc.org/images/entities/char_2009.gif) 1) modified electrode in 0.1 M NaOH solution with and without 5 mM glucose. B) CVs of GC electrode (GCE), GO modified GCE, and as-synthesized Pd NPs/GO modified GCE in a 5 mM glucose solution with 0.1 M NaOH. Scan rate: 10 mV s−1. C) Typical current density–time dynamic response of as-synthesized Pd NPs/GO –nafion modified GCE towards successive addition of 1 mM glucose in NaOH (0.1 M) at 0.4 V, the right inset is amplified response curve. D) the calibration curve for glucose detection 1) modified electrode in 0.1 M NaOH solution with and without 5 mM glucose. B) CVs of GC electrode (GCE), GO modified GCE, and as-synthesized Pd NPs/GO modified GCE in a 5 mM glucose solution with 0.1 M NaOH. Scan rate: 10 mV s−1. C) Typical current density–time dynamic response of as-synthesized Pd NPs/GO –nafion modified GCE towards successive addition of 1 mM glucose in NaOH (0.1 M) at 0.4 V, the right inset is amplified response curve. D) the calibration curve for glucose detection | ||
3.4 Interferences
A challenge in glucose detection is the avoidance of interfering species since the electron transfer rates of these interferences are relatively faster than that of glucose when they are oxidized9,10. Even if the concentrations of interferences, UA (0.02 mM), AP (0.02 mM), and AA (0.02 mM) are much lower than that of glucose (3–8 mM) in normal physiological samples, these interfering oxidation currents are comparable with that of glucose. We investigated the interference effects at 0.4 V and −0.1 V. The results are summarized in Table 1. The responses from the interferences of UA, AP, and AA are negligible at the working potential of 0.4 V, considering the electrochemical detection of glucose on Pd NPs/GO-Nafion modified electrode. The effects of interference at −0.1 V are much higher and cannot be neglected. The glucose sensor based on the as-prepared Pd NPs/GO nanocomposite shows better performance at a working potential of 0.4 V.| Substrate | Response at 0.4 V (μA) | Response at −0.1 V (μA) |
|---|---|---|
| Glucose (1 mM) | 1.25 | 0.3 |
| Uric acid (0.02 mM) | 0.08 | 0.2 |
| P-Acetamidophenol (0.02 mM) | 0.12 | 0.1 |
| Ascorbic (0.02 mM) | 0.15 | 0.27 |
Conclusions
In this work, we constructed mono-dispersed Pd nanoparticles with uniform size on graphene oxide by using a simple and environmentally friendly ultrasonic method, in which no additional reductant was involved. The results show that the morphology and electrocatalytic performance of Pd nanoparticles are influenced by both the ultrasonication time and by the composition ratios of GO and Pd. In alkaline solution, the sensor based on the as-prepared nanocomposite showed high sensitivity, selectivity and linear relation response to glucose in concentration range of 0.2–10 mM with a correlation coefficient of 0.9897 at a detection potential of 0.4 V.Acknowledgements
This work was financially supported by the National Natural Science Foundation of China (No.21 075 051 and 50 832 001), Program for New Century Excellent Talents in University (NCET-10-0433), the “211” and “985” project of Jilin University, China, and State Key Laboratory of Electroanalytical Chemistry, CIAC, CAS.References
- K. J. Cash and H. A. Clark, Trends Mol. Med., 2010, 16, 584–593 CrossRef CAS.
- J. Wang, Chem. Rev., 2008, 108, 814–825 CrossRef CAS.
- S. J. Bao, C. M. Li, J. F. Zang, X. Q. Cui, Y. Qiao and J. Guo, Adv. Funct. Mater., 2008, 18, 591–599 CrossRef CAS.
- C. Li and C. Cha, Front. Biosci., 2004, 9, 3324–3330 CrossRef CAS.
- Y. Zhang, S. Liu, L. Wang, X. Qin, J. Tian, W. Lu, G. Chang and X. Sun, RSC Adv., 2012, 2, 538–545 RSC.
- H. Tang, J. Chen, S. Yao, L. Nie, G. Deng and Y. Kuang, Anal. Biochem., 2004, 331, 89–97 CAS.
- Y. Bai, W. Yang, Y. Sun and C. Sun, Sens. Actuators, B, 2008, 134, 471–476 CrossRef.
- S. P. Tung, T. K. Huang, C. Y. Lee and H. T. Chiu, RSC Adv., 2012, 2, 1068–1073 RSC.
- L. Meng, J. Jin, G. Yang, T. Lu, H. Zhang and C. Cai, Anal. Chem., 2009, 81, 7271–7280 CrossRef CAS.
- X. Chen, Z. Lin, D. J. Chen, T. Jia, Z. Cai, X. Wang, G. Chen and M. Oyama, Biosens. Bioelectron., 2010, 25, 1803–1808 CrossRef CAS.
- C. Zhao, C. Shao, M. Li and K. Jiao, Talanta, 2007, 71, 1769–1773 CrossRef CAS.
- Y. Bai, Y. Sun and C. Sun, Biosens. Bioelectron., 2008, 24, 579–585 CrossRef CAS.
- N. Xonoglou and G. Kokkinidis, Bioelectrochem. Bioenerg., 1984, 12, 485–498 CrossRef CAS.
- S. B. Aoun, Z. Dursun, T. Koga, G. S. Bang, T. Sotomura and I. Taniguchi, J. Electroanal. Chem., 2004, 567, 175–183 CrossRef.
- M. Tominaga, T. Shimazoe, M. Nagashima, H. Kusuda, A. Kubo, Y. Kuwahara and I. Taniguchi, J. Electroanal. Chem., 2006, 590, 37–46 CrossRef CAS.
- Y. Li, X. Fan, J. Qi, J. Ji, S. Wang, G. Zhang and F. Zhang, Nano Res., 2010, 3, 429–437 CrossRef CAS.
- H. F. Cui, J. S. Ye, W. D. Zhang, C. M. Li, J. H. T. Luong and F. S. Sheu, Anal. Chim. Acta, 2007, 594, 175–183 CrossRef CAS.
- S. Bai and X. Shen, RSC Adv., 2012, 2, 64 RSC.
- A. K. Geim and K. S. Novoselov, Nat. Mater., 2007, 6, 183–191 CrossRef CAS.
- J. Chen, X. Zheng, H. Wang and W. Zheng, Thin Solid Films, 2011, 520, 179–158 CrossRef CAS.
- W. S. Hummers Jr and R. E. Offeman, J. Am. Chem. Soc., 1958, 80, 1339–1339 CrossRef.
- X. Sun, Z. Liu, K. Welsher, J. T. Robinson, A. Goodwin, S. Zaric and H. Dai, Nano Res., 2008, 1, 203–212 CrossRef CAS.
- X. Chen, G. Wu, J. Chen, Z. Xie and X. Wang, J. Am. Chem. Soc., 2011, 133, 3693–3695 CrossRef CAS.
- J. J. Shi and J. J. Zhu, Electrochim. Acta, 2011, 56, 6008–6013 CrossRef CAS.
- C. H. Chou, J. C. Chen, C. C. Tai, I. Sun and J. M. Zen, Electroanalysis, 2008, 20, 771–775 CrossRef CAS.
- X. Zhang, G. Wang, A. Gu, Y. Wei and B. Fang, Chem. Commun., 2008, 5945–5947 RSC.
Footnote |
| † Electronic supplementary information (ESI) available: AFM image of GO, CV diagrams, variations of current versus time at −0.1 V. See DOI: 10.1039/c2ra20425h |
| This journal is © The Royal Society of Chemistry 2012 |
