DOI:
10.1039/C2RA20280H
(Paper)
RSC Adv., 2012,
2, 5976-5982
Solution synthesis of homogeneous plate-like multifunctional CeO2 particles†
Received
16th February 2012
, Accepted 20th April 2012
First published on 25th April 2012
Abstract
Plate-like CeO2 particles were successfully synthesized by calcination of Ce2(CO3)3·8H2O single plate crystals at 400 °C. In comparison with commercial CeO2 nanoparticles, the homogeneous plate-like CeO2 particles showed lower photocatalytic and oxidation catalytic activity, higher slipping characteristic (comfort of use) and higher pearlescence (gloss value) as well as excellent UV-shielding ability, indicating the potential application as a new type of multifunctional material.
Introduction
Inorganic sunscreens are generally viewed as harmless pigments on the human skin and have been used with increasing frequency in beach and daily use photoprotection products, because of their higher chemical stability and safety compared with those of organic materials.1 Fine powders of zinc oxide (ZnO) and titania (TiO2), which possess the band gap energy of ca. 3 eV, have been widely used as inorganic UV-shielding materials in personal care products, but their high refractive indices can make the face look unnaturally white, and their photocatalytic activities lead to the generation of a reactive oxygen species which are suspected to cause damage to DNA.2,3 Recently, the ceria particles, which have a lower refractive index, high transparency in the visible light range, low photocatalytic activity, low oxidation catalytic activities as well as broad-spectrum UV-shielding ability, have been developed as a new type of UV-shielding material.4–8 For cosmetic applications, particle toxicity data is critical. Until now, it has been proved that ceria particles have no toxicity to the human body, and the ceria particles have already been commercially contained in some cosmetic products.9,10 It is also well known that different morphologies of nanostructure materials exhibit unique physical-chemical properties.11–17 Generally, the comfort of nanoparticles is modest because of the agglomeration. In contrast, the plate-like microparticles show excellent comfort of use and pearlescent characteristics.18 In order to improve the comfort of use in a cosmetic application, the ceria nanoparticles were composited with microsized plate-like mica particles.19,20 However, mica particle utilization decreased the UV-shielding properties of the composites, since mica do not possess an UV-shielding ability. In our previous research, we firstly found that the utilization of plate-like lepidocrocite type titanate (K0.8Li0.27Ti1.73O4) possessing an UV-shielding ability instead of mica particles could lead to the excellent comfort and UV-shielding ability of the composites materials. Ceria nanoparticles could be coated on the plate-like lepidocrocite type titanate (K0.8Li0.27Ti1.73O4) by various methods such as the precipitation process, sol–gel method, ball-milling treatment, or layer-by-layer precipitation,20–23 however, the procedures are complicated. If plate-like ceria microparticles could be obtained, they can be expected to show excellent comfort as well as UV-shielding ability. This is the reason why we investigated the synthesis of plate-like ceria microparticles. Until now, nanometer-size and micrometer-size ceria particles with different morphologies such as polyhedrons,24 wires,25 rod-like,26 cubes27,28 and spheres29 were synthesized by various processes such as the precipitation process,30 hydrothermal process,31 sol–gel process,32 and template method.33 However, the one-step formation of plate-like ceria microparticles seems to be difficult because of the cubic fluorite type crystal structure. Some researchers have reported the synthesis of small size rhombic plates,34 triangular plates35,36 and dendrites morphologies37via the synthesis of Ce(OH)CO3 precursors.
In the present research, it was firstly found that the plate-like single crystals of Ce2(CO3)3·8H2O could be synthesized by an environmentally friendly facile solution process. The plate-like ceria particles with similar morphologies could be obtained by calcination of the plate-like precursors in air at 400 °C. Since the particle size and aspect ratio of the plate-like cerium carbonate precursor could be controlled effectively by precisely adjusting the pH value of the reaction solution and/or by controlling the solvent composition during the precursor formation, a well-defined ceria nanostructure with a plate-like morphology and multifunctions for cosmetic materials could be successfully prepared.
Experimental
Cerium(III) nitrate, sodium hydrogen carbonate and sodium carbonate (Kanto Chem. Co., Japan) were used as starting materials. In a typical synthesis, 5 mL of 1.0 M cerium(III) nitrate solution was added slowly into 45 mL of 0.33 M–0.45 M sodium hydrogen carbonate/sodium carbonate mixed solution at 25 °C to precipitate cerium carbonate precursors. The pH value was precisely adjusted by controlling the sodium hydrogen carbonate/sodium carbonate molar ratio. The final solutions with Ce concentration of 0.1 M and pH values of 4.8–9.8 were kept in a constant temperature water bath at 25 °C for 24 h. Then, the precipitate was filtrated, washed, dried at 60 °C over night, and finally calcined in air at 400 °C–1000 °C for 1 h to form the ceria particles.
The crystalline phases of the products were identified by X-ray diffraction analysis (XRD, Shimadzu XD-D1) using graphite-monochromized Cu-Kα radiation. The chemical composition of the precursor was analyzed by inductively coupled plasma-emission spectroscopy (ICP, Thermo Fisher Scientific, IRIS Advantage Duo). Single crystal X-ray diffraction was carried out using Mo-Kα radiation with a graphite monochromator and an imaging plate on a single-crystal X-ray diffractometer (RIGAKU, R-AXIS RAPID-II). The thermogravimetric and differential thermal analyses (TG-DTA, Rigaku, TG8101D) were performed on the samples from room temperature to 900 °C with a heating rate of 10 °C min−1 in air. The particle morphology was observed using a scanning electron microscope (Hitachi, Hitachi, FE-SEM S-4800 and TM-1000) and a transmission electron microcopy (JEOL, JEM-2000EX). The average particle size of the sample was calculated by counting 30 particles based on SEM photographs. The thin film of ceria with a thickness of 12.5 μm was coated on a quartz glass plate by a blade method, where at first, 2.5 g ceria powder was mixed with 5.0 g of collodion (10%) (Wako Pure Chem., Japan) and 2.5 g of ethanol (Kanto Chem. Co. , Japan), and was dispersed well by a magnetic stirrer under 600 rpm for 24 h. The transmittance spectra of thin films were characterized by UV-Vis spectrophotometer (Shimadsu, UV-2450). The average kinetic friction coefficient (MIU) was measured by a surface friction tester (Katotech, KES-SE) which employs the artificial leather as the substrate where the samples were uniformly dispersed on using a make-up brush. The gloss value at 20°, 60°, and 85° was performed with a handy gloss meter (PG-1M, Nippon Denshoku Co., Ltd). The oxidative catalytic activity was measured by a Rancimat system (Rancimat 743, Metrohm Co., Ltd), where 0.5 g CeO2 powder was mixed with 10 g of castor oil and heated at 120 °C with bubbling 10 L h−1 of air for 25 h, and the exposed gas was trapped by 100 mL of distilled water.4,5 The oxidation catalytic activity of the samples was determined by measuring the increase in the electric conductivity of the deionized water by dissolving the volatile molecules formed by the oxidation of castor oil. Some commercial inorganic powders such as zinc oxide (ZnO(W): 0.02 μm zinc oxide, Wako Pure Chemical Industries), titania (Degussa P25), ceria (Ceriguard® W300, and Cerigard® W90, Nippon Inorganic Colour & Chemical Co., Ltd; nominated as Ceriguard), mica (Yamaguchi Mica, Y-3000) were used as standard materials.
Results and discussion
Homogeneous plate-like Ce2(CO3)3·8H2O single crystals were successfully synthesized by the facile solution process at 25 °C for 24 h. Fig. 1 shows the typical SEM and TEM images of the as-prepared particles. Homogenous plate-like particles with particle size of 40–60 μm in length could be confirmed from the images. The inserted ED image indicated the formation of plate-like single crystalline. Fig. 2 shows the typical XRD pattern of the as-prepared sample. The peaks of sample can be indexed as the single phase of orthorhombic Ce2(CO3)3·8H2O, consisted of layered structure. The lower growth rate of b-axis and faster growth rate of a- and c-axes led to the large (010) plane of Ce2(CO3)3·8H2O single crystalline, while other planes got retarded. It might be suggested that the carbonate ions reacted with cerium ions to form Ce2(CO3)3·8H2O, as shown in eqn (1)| | | 2Ce3+ + 3CO32− + 8H2O → Ce2(CO3)3·8H2O | (1) |
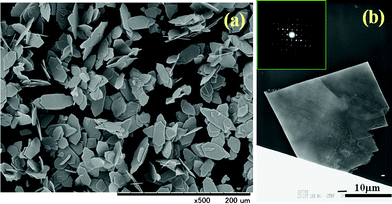 |
| | Fig. 1 Typical (a) SEM and (b) TEM image (insert SED pattern) of the as-prepared plate-like cerium carbonate hydrate single crystal synthesized in 0.1 M Ce(NO3)3 and 0.3 M NaHCO3 mixed solution. | |
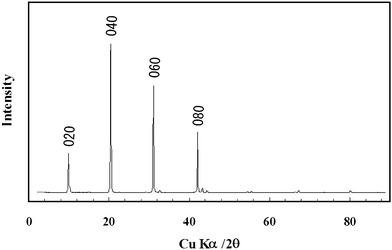 |
| | Fig. 2 Typical XRD pattern of the as-prepared plate-like cerium carbonate hydrate orthorhombic single crystal. | |
The TG-DTA curves of Ce2(CO3)3·8H2O showed two steps of weight losses. The weight loss of 23% with a large endothermic peak from room temperature to 200 °C might be attributed to dehydration, and that of 20.8% with a smaller endothermic peak from 200 °C to 300 °C might be attributed to the oxidative decarbonization to form ceria as shown by eqn (2) and (3), respectively.
| | | Ce2(CO3)3·8H2O → Ce2(CO3)3 + 8H2O | (2) |
| | | Ce2(CO3)3 + 1/2 O2 → 2CeO2 + 3CO2 | (3) |
The weight losses for the reactions in eqn (2) and (3) were calculated as 23.8% and 19.3%, respectively, and agreed with the observed values from the TG-DAT analysis, although the data is not shown here.
In order to analyse the crystalline structure of the as-prepared product, a comparatively large particle was selected and the single crystal X-ray diffraction was carried out. Diffraction data collection and unit cell refinement were performed by the program PROCESS-AUTO.38 Absorption correction was performed by the program NUMABS.39 Structure models of Ce2(CO3)3·8H2O were obtained by using SIR2004.40 The structures were refined with the program SHELXL-97.41 The crystallographic data of the Ce2(CO3)3·8H2O single crystalline are summarized in Table SI-1. † Site occupancies, atomic coordinates and displacement parameters are listed in Table SI-2. The as-prepared single crystal possessed an orthorhombic crystal system (a = 9.5324(7) Å, b = 8.4915(7) Å, c = 8.9523(8) Å, space group of Pmn21(No.31)) with a volume of 724.64(10) Å3, and a calculated density of 2.770 g cm−3. The selected single crystal possessed a transparent colour and a comparatively large size of 0.100 × 0.007 × 0.112 mm. The goodness-of-fit on F2 1.008 was obtained by the refinement. The anisotropic displacement parameters and selected interatomic distances data are summarized in Table SI-3 and SI-4.
Fig. 3 shows the crystal structure drawn with VESTA.42 The layered structure of Ce2(CO3)3·8H2O could be projected on the a–b plane, indicating the existence of CO32− inside of the interlayer structure.
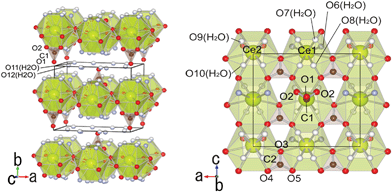 |
| | Fig. 3 The layered structure of Ce2(CO3)3·8H2O projected on the a–b and a–c planes. | |
Fig. 4 shows the SEM images of the powders treated in air at different temperatures. Plate-like cerium oxide particles could be obtained by the transcription of precursor's shape. It is obvious that the plate-like structure could be confirmed, even after calcination at such high temperatures of 800–1000 °C. The plate-like structure consisted of interconnected nanoparticles. Fig. 5 shows the XRD patterns of the CeO2 particles prepared by calcination of the Ce2(CO3)3·8H2O precursor. It is obvious that the face centred cubic (FCC) cerium oxide single phase might be achieved after calcination above 400 °C. Fig. 6 shows the HRTEM, SED and EDX spectra of the CeO2 particles synthesized by calcination of Ce2(CO3)3·8H2O at 400 °C. Selected-area electron diffraction (SEAD) pattern (Fig. 6(d)) also confirms that the calcined sample consisted of FCC CeO2 polycrystalline structure with preferential orientation growth. The lattice fringes are clearly visible with a spacing of 0.313 and 0.195 nm, corresponding to the spacing of the (111) and (220) planes of cubic ceria (Fig. 6(b,c)). Only O and Ce in the sample could be confirmed by the EDX analysis (Fig. 6(e)).
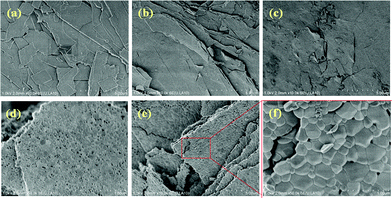 |
| | Fig. 4 SEM photographs of the powders (a) as-prepared and treated in air at different temperatures of (b) 400 °C, (c) 600 °C, (d) 800 °C, (e) and (f) 1000 °C. | |
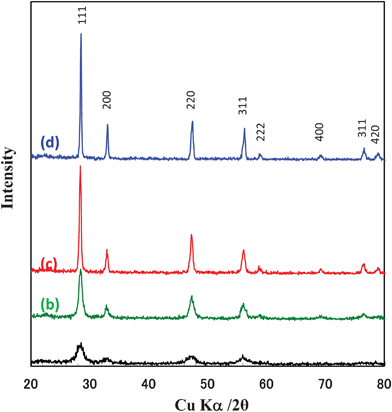 |
| | Fig. 5 XRD patterns of the particles prepared by calcination of Ce2(CO3)3·8H2O precursors in air at (a) 400 °C, (b) 600 °C, (c) 800 °C, and (d) 1000 °C. | |
Fig. 7 shows the HRTEM, SED and EDX spectra of the CeO2 particles synthesized by calcination of Ce2(CO3)3·8H2O at 800 °C. Fig. 7(a) indicates that nanoparticles of 300–500 nm in size interconnected together to form the plate-like structure, which agreed with the SEM image shown in Fig. 4(e). Even after calcination at 1000 °C, the plate-like structure could be confirmed (Fig. 4(f)). The SEAD pattern of the plate-like particles in Fig. 7(a) possessed polycrystalline characteristics (Fig. 7(b)) and agreed with that of the FCC CeO2 polycrystalline structure. The selected lattice fringes are clearly visible with a spacing of 0.281 nm, corresponding to the spacing of the (200) planes of cubic ceria. It was found that the phase composition and morphologies of cerium carbonate microparticles changed greatly depended on the synthesize conditions. The formation of plate-like Ce2(CO3)3·8H2O single crystalline depended on the pH values sensitively, i.e., low-pH values between 4.81–6.74 preferred to form Ce2(CO3)3·8H2O single crystalline, while high-pH values of the solution preferred to form CeOHCO3 and Ce(OH)3 mixture (Fig. SI-1†). It was also confirmed that morphologies of the products greatly affected by the precipitator concentration and reaction temperature (Fig. SI-2 and Fig. SI-3†).
Fig. 8 shows the formation mechanism of the plate-like crystalline in solution over time. Based on the data of Fig. SI-2 and SI-3,† it is obvious that the particle size decreased with increment of reaction temperature, solution concentration and pH value (precipitator concentration), indicating that the nucleation rate controlled the crystalline growth. As shown in the insert SEM images, a large amount of small particles were produced at first, then the nucleus growth proceeded to form large plate-like particles, in which the orientated growth might be related to its layered structure. The nucleus formation seemed to proceed even after 20 min, since the product consisted of a mixture of the plate-like micro-particles and nanosized particles. After reaction for more than 60 min, the particles changed to homogenous large crystals, which was related to the Ostwald ripening mechanism, in which smaller particles continued to shrink, and finally dissolved in solution because of its large surface energy, while large particles continued to grow and resulted in larger particle sizes with lower energy states. During the Ostwald ripening process, molecules in the solution attach to the surface of larger particles, leading to the crystal growth during the aging process. Part of the plate-like particles grew to helix on the large plate-like particle surface, because some crystal defects on the surface acted as the seeds of the crystal growth. Almost no small ceria crystallites could be found after a reaction time more than 1 h, in other words, the final products consisted of micro-sized plate-like particles with a homogenous particle size distribution.
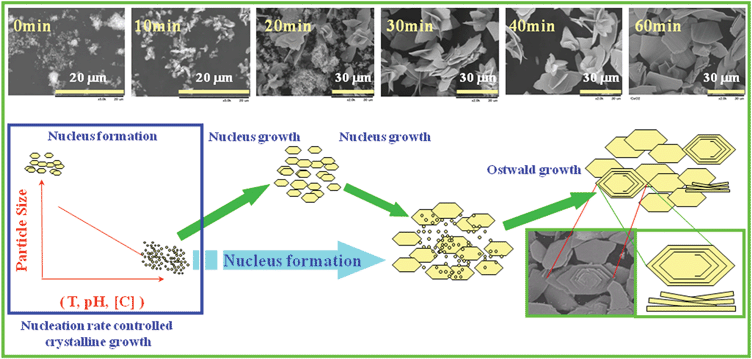 |
| | Fig. 8 Mechanism of the crystalline formation and crystalline growth. | |
Fig. 9 shows the effect of ethylene glycol (EG) additive on the particle size of CeO2 particles synthesized by the transcription of the precursor's shape. It is clear that the EG additive decreased the particle size effectively. Beside EG, some alcohols such as methanol, ethanol, and propanol also had a similar affect on the particle size of the products. Fig. 10 summarizes the effect of some organic solvents on the average particle size of the cerium carbonate precursor and CeO2 particles prepared by calcination of carbonate. It is obvious that the particle sizes of carbonate and CeO2 decreased with an increment of the organic solvent concentration. The EG showed the most effective result, which might be related to its high viscosity (16.1 mPa s at 25 °C) together with its low dielectric constant (41.1 at 20 °C). The CeO2 particles showed smaller sizes compared with those of carbonate particles, which is caused by shrinkage during the following calcination process at 400 °C. The particle size control is one of the most important factors in cosmetic material applications.
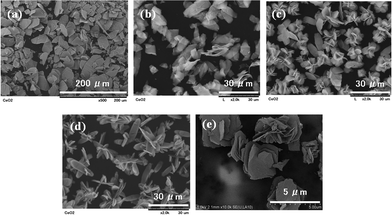 |
| | Fig. 9 SEM images of the particles synthesized in 0.1 M Ce(NO3)3–0.3 M NaHCO3 mixed solution at 25 °C with (a) 0 vol.%, (b) 4 vol.%, (c) 6 vol.%, (d) 10 vol.%, and (e) 20 vol.% EG additives followed by calcination at 400 °C for 1 h. | |
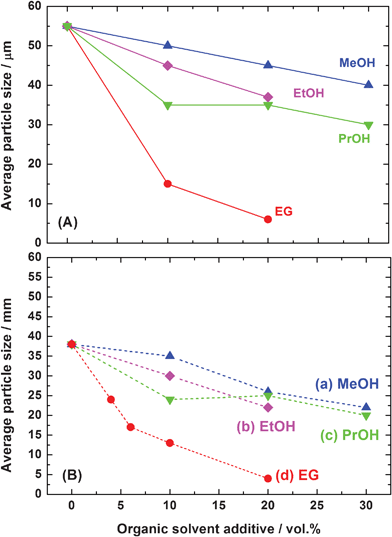 |
| | Fig. 10 Effect of the amounts of (a) methanol, (b) ethanol, (c) propanol, and (d) ethylene glycol on the average particle size of (A) Ce2(CO3)3·8H2O (solid lines) and (B) CeO2 (dotted lines). | |
Fig. 11 shows the UV-Vis transmittance spectra of the thin films consisting of plate-like ceria samples together with the commercial fine powders of zinc oxide and ceria. The UV-shielding ability greatly changed with particle size. In cosmetic applications, it is important to realize high visible light transparency as well as high UV-shielding properties. Usually, the agglomeration of particles results in the decrease of the packing density of the particles, and results in the decrease of the UV-absorption ability. It is also difficult to get high packing density for large plate-like particles because of the formation of a card-house structure. The commercial nanoparticles possessed excellent UV-shielding properties. Compared with commercial nanoparticles of ZnO and CeO2 (Cerigard® W90), plate-like CeO2 particles with particle sizes of 4–17 μm (Fig. 11(g) and (e)) possessed better UV-shielding properties. In order to evaluate the UV-shielding ability and visible light transparency, the UVA/Vis and UVB/Vis shielding factors, which were denoted in the figure caption of Fig. SI-4,† were characterized. It was also found that both UVA/Vis and UVB/Vis shielding factors decreased with the increment of average particle size (Fig. SI-4†), because of the light scattering by the micrometer sized large particles.
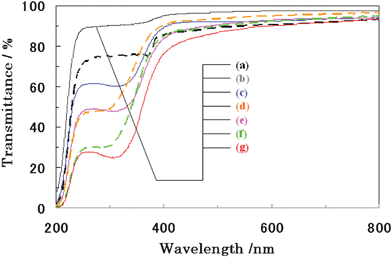 |
| | Fig. 11 UV-Vis transmittance spectra of ceria thin film consisted of plate-like ceria particles (solid lines) with various particle size of (a) 38 μm (2% EG), (c) 24 μm (4% EG), (d) 17 μm (6% EG), (f) 4 μm (20% EG) together with those of nanosized particles (dotted lines) of (b) ZnO (Kanto) and (d) CeO2(Cerigard® W90) and (f)CeO2 (Cerigard® W320) commercial particles. | |
Fig. 12 shows the oxidation catalytic activity evaluation by Rancimat method. The longer induction time implies the lower oxidation catalytic activity, which is preferred in the application of cosmetic agents. Compare with nanosized ceria powders (induction time 7 h), all the plate-like ceria particles synthesized in the present research showed a roughly 2 times longer induction time of 14–17 h, indicating their very low oxidation catalytic activities due to the small surface area of the plate-like micro particle. It was also confirmed that the plate-like CeO2 particles possessed very low photocatalytic activity compared with that of titania nanoparticles (Deggusa P25) (Fig. SI-5†). These results indicated that the plate-like CeO2 particles possessed high safety to human health, and a high potential for cosmetic material applications.
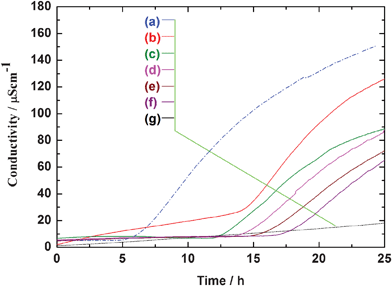 |
| | Fig. 12 Oxidative catalytic activity characterization of plate-like CeO2 with different particle sizes, together with that of commercial CeO2 nanoparticles. (a) Commercial Cirigard® W90; plate-like CeO2 with the particles sizes of (b) 5 μm, (c) 15 μm, (d) 18 μm, (e) 22 μm, (f) 38 μm, (e) blank (without sample). | |
The slipping characteristic (comfort of use) and pearlescent property are very important factors in cosmetic applications. Normally, too fine and too large a particle size will lead to bad slipping characteristic, because of their agglomeration due to the high surface energy of fine particles and abrasive effect of large particles. In order to evaluate the feeling of applying sample powder to skin, the kinetic friction coefficients of the artificial leather before and after applying various sample powders were determined using a friction tester. The value of the kinetic friction coefficient MIU ratio of the material was defined as the ratio of the value with sample to that of artificial leather without sample. Table 1 summarizes the MIU ratio and pearlescent property (gloss number at 20, 60, and 85°) of the samples with typical different particle sizes. Compared with some commercial nanoparticles, the plate-like CeO2 particles showed such lower MIU ratios of 37–58%, indicating their excellent slipping characteristic. In addition, all the plate-like ceria particles possessed high pearlescent properties as 3.7–12.0 GU at 60°, while commercial nanoparticles only showed very low gloss numbers as 2.4–2.7 at 60°. The Ce2(CO3)3·8H2O single crystal precursor showed a very high pearlescent property as 18.0 GU at 60°, even higher than that of the plate-like commercial mica which is related to its large particle size and smooth particle surface. The plate-like mica commercial particles (Yamaguchi Y-3000) with a particle size of 27 μm is widely used in cosmetic materials because of its excellent slipping characteristic (MIU = 26.6%) and pearlescent property (7.2 GU at 60°), however, mica particles show non-UV-shielding properties. The above results implied that the plate-like ceria particles might be utilized as a novel multifunctional material.
Table 1 MIU ratios and gloss numbers of typical plate-like samples, together with some commercial UV shielding materials
| Sample |
MIU ratiob/% |
Gloss number (GU) at |
| |
|
20° |
60° |
85° |
|
Commercial mica is famous for its low MIU ratio and high pearlescent (GU at 60°), and widely utilized in cosmetic materials.
MIU ratio = MIU of artificial leather with sample/MIU of artificial leather without sample.
|
| Plate-like Ce2(CO3)3·8H2O (110 μm) |
39.4 |
5.8 |
18.0 |
8.9 |
| Plate-like CeO2 (75 μm) |
44.4 |
2.3 |
12.0 |
15.4 |
| Plate-like CeO2(38 μm) |
40.6 |
1.8 |
4.5 |
2.4 |
| Plate-like CeO2(22 μm) |
36.6 |
1.5 |
3.8 |
0.6 |
| Plate-like CeO2(18 μm) |
37.7 |
1.7 |
3.7 |
0.5 |
| Plate-like CeO2(4 μm) |
57.5 |
1.8 |
4.6 |
0.8 |
| Commercial CeO2 nanoparticles (Cerigard® W90) |
70.9 |
1.3 |
2.5 |
0.6 |
| Commercial TiO2 nanoparticles (P-25) |
52.5 |
2.0 |
2.7 |
0.9 |
| Commercial ZnO nanoparticles (Wako-0.02 μ) |
67.4 |
1.3 |
2.4 |
3.7 |
| Commercial Mica (Y-3000, 23 μm)a |
26.6a |
1.9 |
7.2a |
0.8 |
The mentioned transcription of precursor's shape process is an effective and universal process for the synthesis of plate-like particles. Some rare earth oxides, such as Sm2O3, La2O3, Y2O3, Y2O3 and Eu2O3, with plate-like morphology could be successfully synthesized by the same manner, i.e., plate-like rare earth oxide could be produced by calcination treatment of plate-like rare earth carbonate precursors (Fig. SI-6 and SI-7†).
Conclusions
Plate-like cerium carbonate single crystals were successfully prepared by a facile precipitation process. The crystal structure of Ce2(CO3)3·8H2O was determined as orthorhombic phase with a layered structure. The particle size of the cerium carbonate could be controlled precisely by adjusting the pH value of the solution and addition of organic solvents such as ethylene glycol (EG) and various alcohols. Plate-like cerium oxide micro-particles could be obtained by calcination of the cerium carbonate precursor in air at 400 °C. In comparison with commercial ceria nanoparticles, the synthesized plate-like ceria particles showed lower photocatalytic and oxidation catalytic activity, higher slipping characteristics (comfort of use) and higher pearlescence (gloss value) as well as excellent UV-shielding ability, indicating the potential application as a new type of multifunctional cosmetic material. Some other cubic phase rare earth oxides with plate-like morphology were similarly synthesized by the same manner, i.e., coprecipitation followed by calcination treatment in air.
Acknowledgements
This research was partly supported by The Cosmetology Research Foundation, the Research for Promoting Technological Seeds, JST.
References
- F. P. Gasparro, K. M. Mitchnic and J. F. Nash, Photochem. Photobiol., 1998, 68, 243–256 CrossRef CAS.
- R. Cai, K. Hashimoto, K. Itoh, Y. Kubota and A. Fujita, Bull. Chem. Soc. Jpn., 1991, 64, 1268–1273 CrossRef CAS.
- T. Sato, A. M. El-Toni, S. Yin and H. Hidaka, Key Eng. Mater., 2007, 352, 293–296 CrossRef CAS.
- S. Yabe, M. Yamashita, S. Momose, K. Tahira, S. Yoshida, R. Li, S. Yin and T. Sato, Int. J. Inorg. Mater., 2001, 3, 1003–1008 CrossRef CAS.
- R. Li, S. Yabe, M. Yamashita, S. Momose, S. Yoshida, S. Yin and T. Sato, Solid State Ionics, 2002, 151, 235–241 CrossRef CAS.
- S. Yabe and T. Sato, J. Solid State Chem., 2003, 171, 7–11 CrossRef CAS.
- R. Li, S. Yabe, M. Yamashita, S. Momose, S. Yoshida, S. Yin and T. Sato, Mater. Chem. Phys., 2002, 75, 39–44 CrossRef CAS.
- T. Masui, M. Yamamoto, T. Sakata, H. Mori and G. Adachi, J. Mater. Chem., 2000, 10, 353–357 RSC.
-
http://cosmetico.jp/shop/detail/?iid=19227
.
-
http://www.matsumoto-trd.co.jp/cgi-bin/search/index.cgi?num=1154
.
- S. Yin, M. Shinozaki and T. Sato, J. Lumin., 2007, 126, 427–433 CrossRef CAS.
- S. Yin, S. Akita M.Shinozaki, R. Li and T. Sato, J. Mater. Sci., 2008, 43, 2234–2239 CrossRef CAS.
- G. J. Nohynek, E. K. Dufour and M. S. Roberts, Skin Pharmacol. Physiol., 2008, 21, 136–149 CrossRef CAS.
- H. Mai, L. Sun, Y. Zhang, R. Si, W. Feng, H. Zhang, H. Liu and C. Yan, J. Phys. Chem. B, 2005, 109, 24380–24385 CrossRef CAS.
- J. H. Zeng, B. B. Jin and Y. F. Wang, Chem. Phys. Lett., 2009, 472, 90–95 CrossRef CAS.
- B. M. Choudary, R. S. Mulukutla and K. J. Klabunde, J. Am. Chem. Soc., 2003, 125, 2020–2021 CrossRef CAS.
- M. Zhang, T. S. Tana, J. Li, H. Li, Y. Li and W. Shen, Catal. Today, 2009, 148, 179–183 CrossRef.
- H. Shiomi, E. Misaki, M. Adachi and F. Suzuki, J. Coat. Technol. Res., 2008, 5, 455–464 CrossRef CAS.
- S. Bertaux, P. Reynders and J.-M. Heintz, Thin Solid Films, 2005, 473, 80–88 CrossRef CAS.
- T. Sato, A. M. El-Toni, S. Yin and T. Kumei, J. Ceram. Soc. Jpn., 2007, 115, 571–576 CrossRef CAS.
- X. W. Liu, S. Yin and T. Sato, Mater. Chem. Phys., 2009, 116, 421–425 CrossRef CAS.
- X. W. Liu, J. X. Liu, X. Dong, S. Yin and T. Sato, J. Colloid Interface Sci., 2009, 336, 150–154 CrossRef CAS.
- X. W. Liu, M. K. Devaraju, S. Yin and T. Sato, J. Solid State Chem., 2010, 183, 1545–1549 CrossRef CAS.
- B. Tang, L. Zhuo, J. Ge, G. Wang, Z. Shi and J. Niu, Chem. Commun., 2005, 3565–3567 RSC.
- A. Vantomme, Z. Yuan, G. Du and B. Su, Langmuir, 2005, 21, 1132–1135 CrossRef CAS.
- C. Ho, J. C. Yu, T. Kwong, A. C. Mak and S. Lai, Chem. Mater., 2005, 17, 4514–4522 CrossRef CAS.
- S. Yang and L. Gao, J. Am. Chem. Soc., 2006, 128, 9330–9331 CrossRef CAS.
- C. Pan, D. Zhang, L. Shi and J. Fang, Eur. J. Inorg. Chem., 2008, 2429–2436 CrossRef CAS.
- Y. Minamidate, S. Yin and T. Sato, Mater. Sci. Eng., 2009, 1, 012003 Search PubMed.
- C. Wang, Y. Qian, Y. Xie, C. Wang, L. Yang and G. Zhao, Mater. Sci. Eng., B, 1996, 39, 160–162 CrossRef.
- C. Sun, H. Li, H. H. Zhang, Z. Wang and L. Chen, Nanotechnology, 2005, 16, 1454–1463 CrossRef CAS.
- S. Masson, P. Holliman, M. Kalajia and P. Kluson, J. Mater. Chem., 2009, 19, 3517–3522 RSC.
- S. Wang, J. Zhnag, J. Jiang, R. Liu, B. Zhu, M. Xu, Y. Wang, J. Gao, M. Li, Z. Yuan, S. Zhang, W. Huang and S. Wu, Microporous Mesoporous Mater., 2009, 123, 349–353 CrossRef CAS.
- J. Chen, S. Zhon, Q. Liu, Y. Wang, S. Wang, R. Xu, L. Luo and S. Wang, Powder Technol., 2010, 197, 136–139 CrossRef CAS.
- Z. Guo, F. Du, G. Li and Z. Cui, Inorg. Chem., 2006, 45, 4167–4169 CrossRef CAS.
- C. S. Riccardi, R. C. Lima, M. L. Dos Santos, P. R. Bueno, J. A. Varela and E. Longo, Solid State Ionics, 2009, 180, 288–291 CrossRef CAS.
- K. Li and P. S. Zhao, Mater. Res. Bull., 2010, 45, 243–246 CrossRef CAS.
- PROCESS-AUTO, Rigaku/MSC, 9009 New Trails Drive, The Woodlands, TX77381-5209, USA.
-
T. Higashi, NUMABS, Rigaku Corporation, Tokyo, Japan, 1999 Search PubMed.
- M. C. Burla, R. Caliandro, M. Camalli, B. Carrozzini, G. L. Cascarano, L. De Caro, C. Giacovazzo, G. Polidori and R. Spagna, J. Appl. Crystallogr., 2005, 38, 381–388 CrossRef CAS.
- G. M. Sheldrick, Acta Crystallogr. A, 2008, 64, 112–122 CrossRef.
- K. Momma and F. Izumi, J. Appl. Crystallogr., 2008, 41, 653–658 CrossRef CAS.
Footnote |
| † Electronic supplementary information (ESI) available. See DOI: 10.1039/c2ra20280h |
|
| This journal is © The Royal Society of Chemistry 2012 |
Click here to see how this site uses Cookies. View our privacy policy here. 


