CO2 capture at elevated temperatures by cyclic adsorption processes
Gongkui
Xiao
a,
Penny
Xiao
a,
Sangyun
Lee
b and
Paul A.
Webley
*b
aCooperative Research Center for Greenhouse Gas Technologies, Department of Chemical Engineering, Monash University, Wellington Road, Clayton, Victoria 3800, Australia
bCooperative Research Center for Greenhouse Gas Technologies, Department of Chemical and Biomolecular Engineering, The University of Melbourne, Victoria 3010, Australia. E-mail: paul.webley@unimelb.edu.au; Tel: +61 3 90357873; Fax: +61 3 83444153
First published on 26th March 2012
Abstract
Capture of CO2 from high temperature process streams, such as those arising in the Integrated Gasification Combined Cycle (IGCC) process, is receiving increasing attention. In this paper, we report the performance of zeolite 13X for CO2 capture from IGCC streams at elevated temperatures. Isotherms of CO2 adsorption on zeolite 13X at 90 °C, 120 °C, and 200 °C were measured and the fitted parameters were used for cyclic adsorption process design. Four different cycles were designed and tested with gas mixtures representing syngas compositions from a coal gasification pilot plant. These four cycles were then applied to CO2 separation from real coal gasification syngas. The experiments carried out with real syngas showed that zeolite 13X can be used for CO2 capture with acceptable performance even with impurities present in the syngas.
Introduction
Climate change is generally attributed to the accumulation of carbon dioxide (CO2) in the atmosphere, most of which results from combustion of fossil fuels for power generation.1 For the foreseeable future, the use of fossil fuels for generation of power will remain the largest portion of the fuel mix.2 Coal is the most abundant natural fossil fuel and accounted for 27 percent of world energy demand in 2005 according to the World Energy Outlook 2010. Most of the coal (63% in 2005) was consumed in the electricity generation sector.2 In Australia, 81.2% of electricity was generated from the combustion of coal in 2007, of which black coal accounted for 56.6%, and brown coal accounted for 24.2%.3 Brown coal is the cheapest source of fossil fuel for power generation in Australia, but produces the highest level of greenhouse gases per kW when burned in conventional boilers in power plants. In order to take full advantage of brown coal while mitigating the environmental impacts, more efficient ways of burning brown coal must be developed. One candidate for such improved processes is Integrated Drying and Gasification Combined Cycle (IDGCC).4 As in the case of the more general Integrated Gasification Combined Cycle (IGCC), the IDGCC process also provides the potential of capturing CO2 before the syngas is sent to the turbine. Capture of CO2 from this gas stream has the advantage of maintaining the high pressure and temperature of the syngas for energy efficiency and further geo-sequestration of CO2. There are three main technologies under development for pre-combustion CO2 capture: liquid scrubbing,5–8 membrane separation,9–12 and adsorption.13–17 In this study, the separation of CO2 from pre-combustion gas with solid adsorbents is investigated.The key factor affecting the performance of an adsorption process is the identification of a suitable adsorbent. An appropriate adsorbent should have high adsorption working capacity at the required temperature and pressure, good regenerability, and suitable kinetics for both adsorption and desorption.18 A large range of adsorbents have been reported as being capable of capturing CO2 at high temperatures.16,19 However, either because of the slow kinetics of adsorption and desorption or because of the low CO2 capacities of these adsorbents, they have not been commercially used at large scale for pre-combustion processes, although there have been some bench scale demonstrations.20,21
Although zeolite 13X has been recognised for its potential employment for CO2 adsorption at ambient conditions, only recently has it been identified as useful at higher temperatures.22,23 Siriwardane et al.22 reported the rate of CO2 adsorption and the isotherms of CO2 on zeolite 13X at 120 °C at a CO2 partial pressure up to 300 psi. They reported satisfactory regenerability of zeolite 13X at 120 °C as they regenerated the sample after each breakthrough experiment in triplicate with no change in adsorbent capacity.
Previous studies have focused on the adsorbent properties, but no previous work has been reported on the development and use of appropriate process cycles for CO2 capture at 120 °C or above. In this study, firstly, the performance of zeolite 13X for CO2 capture in pressure vacuum swing adsorption (PVSA) processes at elevated temperatures was investigated using a gas mixture simulating the compositions of syngas from a gasification pilot plant coal gasifier. The experiments were carried out with the aim of providing information for the process design of CO2 separation using zeolite 13X from a real coal gasifier. PVSA cycle design can be challenging as there are many variables and operating parameters to be optimised. This is difficult and time consuming to assess through experiments only. For this reason a reliable and validated numerical adsorption process simulator was firstly used to simulate and design PSA cycles before carrying out experiments. In this investigation, the adsorption column and adsorbents were fixed parameters; therefore only the operating parameters were adjusted and investigated. In addition to the numerical design, experiments with simulated gas mixtures were carried out to finalize the process designs. Finally, the designs obtained using the simulated gas mixtures were applied to CO2 separation from real syngas in a coal gasification pilot plant.
Experimental
Isotherm measurements
The adsorbent used in these experiments was zeolite 13X (MOLSIV Adsorbents, UOP LLC); the physical properties of which were previously reported.24 The isotherms for pure CO2 and N2 adsorption on zeolite 13X at 90 °C, 120 °C, and 200 °C were obtained by a volumetric method using a gas adsorption analyser (ASAP 2020, Micrometrics, USA) in the chemisorption mode within the pressure range of 3 kPa to 118 kPa. The samples were degassed to 5 × 10⁻³ mmHg for 12 h at 350 °C before quick transfer to a Flowthru™ sample tube and covered with glass wool for analysis. The quartz sample tube stems have a 12.5 mm outer diameter with an exhaust path for flow-through preparation, and they can be used up to 1100 °C. The flow through tube enabled better contact of the sample with the adsorption gas. The sample temperature fluctuation was controlled within ±1 °C by the temperature control system. Prior to analysis, the samples were first evacuated in situ for 3 h at the corresponding adsorption temperatures, and the adsorption of CO2 commenced from low pressure by dosing specific amounts of CO2 until equilibrium was reached for each preset pressure.High temperature pressure swing adsorption experimental apparatus
Experiments to assess CO2 separation from simulated syngas were performed on a custom-designed gas separation apparatus that can accommodate high pressure and high temperature process conditions. The apparatus consists of two tubular adsorption columns, each of which is within a vertical split tube furnace. The adsorption columns are made of stainless steel with a working length of 1000 mm (total length 1200 mm), an ID of 21 mm and 1.5 mm wall thickness. The schematic of the experimental apparatus is shown in Fig. 1. Gas flow rates were monitored by pre-calibrated mass flow controllers (Brooks Instrument, USA) installed upstream of the adsorption bed. The pressures of feed gases, gases in the column and the exit gases were measured by pressure transducers. A back-pressure controller between the adsorption bed and the product exit was installed to maintain constant adsorption pressure in the bed. The effluent gas stream was analysed using an online CO2 analyser. All the solenoid valves were controlled by Programmed Logic Controller (PLC), and the data including concentration, temperature, pressure, and flow rate, were logged continuously.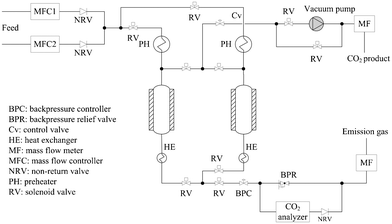 | ||
| Fig. 1 Schematic of the high pressure and temperature adsorption apparatus | ||
Both of the columns were packed with three adsorbent layers: 30 g of zeolite 3A (13 cm in column), 200 g of zeolite 13X (90 cm in column), and 40 g of zeolite 3A (17 cm in column) from upstream to downstream. The zeolite 3A at both ends of the column served as dryer for water only as it will not adsorb hydrogen in the syngas27,28 and as filler for the column as the temperature at the two ends of the column was very different from the temperature at the center of the column. The 3A will also adsorb any impurities in the gas streams. We expect that full scale designs may incorporate a guard bed (such as 3A) but more work will be needed to confirm this-this was beyond the scope of the present study. Zeolite 13X was calcined up to 350 °C in a purpose built cylindrical furnace under a flow of dry air before being packed into the columns. A simulated gas mixture (7.2 bar) of CO2 concentration at 15 vol% with nitrogen balance was introduced to the adsorption column at a total flow rate of 5 sL min−1 for all experiments. Full scale operation of the IGCC process is likely to occur at higher than 7.2 bar but for the purposes of this study, this pressure was chosen as it coincided with experiments conducted on the pilot gasifier.
Pressure vacuum swing adsorption (PVSA) experiments
The overall goal of the adsorption experiments was to achieve high CO2 product recovery and purity to meet the concentration requirements for sequestration from the I(D)GCC process. In order to investigate the impact of operating parameters on the process performance and optimise the process cycle designs, a series of two-bed PVSA simulations were conducted using our adsorption simulator MINSA prior to experimental work. First, a simple four-step cycle was designed to investigate the effect of adsorption time on cycles. Then, from the results obtained from these experiments, a pressure equalization step was added resulting in an eight-step cycle. In order to obtain higher purity of CO2 in the product stream, a “heavy” product purge step was added to the eight step cycle. For product purge, a CO2/N2 stream with the same concentration as that from the eight-step cycle was used, and purge both before and after pressure equalization was carried out. The cycle designs are shown in Fig. 2. All of the cycles were designed based on a 2-bed process since our experimental apparatus was constrained to 2 bed operation. More effective designs for full-scale operation may require more beds for more effective scheduling and to permit more sophisticated cycles to be conducted.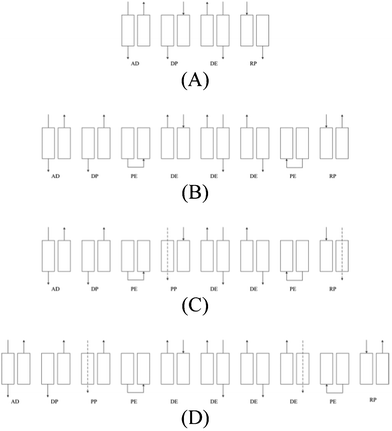 | ||
| Fig. 2 PVSA designs (A) basic 4-step cycle (B) 8-step cycle with pressure equalization (PE) step (C) 8-step with post-PE product purge (PP) step (D) 10-step with pre-PE product purge step. The arrows represent gas flow direction. | ||
The process steps are defined as follows:
Mathematical simulation
Process scale-up design was carried out with an in-house numerical simulator MINSA (Monash Integrated Numerical Simulator for Adsorption). Developed by Webley et al.,25 MINSA uses the conservation of mass and energy in a packed bed together with the Egun equation for pressure drop and the dusty gas model for mass transfer to solve for the composition and temperature profiles in the bed. The numerical method used is the solution-adaptive finite volume method. Additional assumptions are: (i) The gas phase obeys the ideal gas law; (ii) There are negligible concentration, velocity and temperature gradients in the column radial direction; (iii) Constant cross section along the column, uniform void fraction and adsorbent properties within the layers; (iv) Instantaneous thermal equilibrium between adsorbent and the bulk gas at any position and time; (v) The flow pattern is a plug flow (no axial dispersion).Results and discussion
Equilibrium isotherms
Isotherms of pure CO2 and pure N2 adsorption at 90 °C, 120 °C and 200 °C on zeolite 13X are shown in Fig. 3. The adsorption amounts of CO2 are much higher than those of N2 at corresponding pressures, and this indicates good selectivity of CO2 over N2 on the adsorbent. The equilibrium adsorption amount of CO2 increases rapidly with pressure, therefore the adsorbent appears potentially suitable for separating CO2 from streams composed of CO2 and N2 in pressure swing adsorption processes at high temperatures in pre-combustion processes. The isotherms at these three temperatures were fit to the Dual-site Langmuir isotherm equation (solid lines in Fig. 3), and this equation was used for further simulation of pressure swing cycling experiments.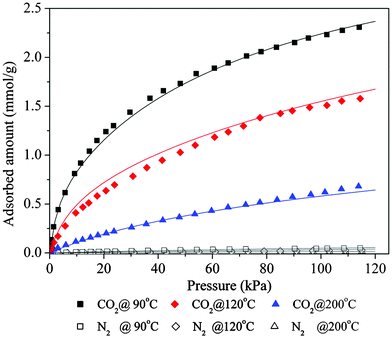 | ||
| Fig. 3 Equilibrium isotherms of CO2 and N2 on 13X at different temperatures | ||
The Dual-site Langmuir equation is :
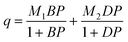 | (1) |
With 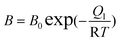
 where q (mol kg−1) is the amount adsorbed, P (kPa) is the respective gas partial pressure, M1 (mol) and M2 (mol) are the respective maximum adsorption capacity for site type 1 and 2, B (1/kPa) and D (1/kPa) are the respective Langmuir affinity constants for each site, and Q1 and Q2 (J mol−1) are the heats of adsorption on sites 1 and 2, respectively. R is the gas constant, and T is T/K.
Parameters determined for the isotherm equation are shown in Table 1.
| CO2 | N2 | |
|---|---|---|
| M 1 (mol kg−1) | 0.655 | 0.140 |
| B 0 (1/kPa) | 8.57 × 10⁻⁷ | 6.57 × 10⁻⁶ |
| Q 1 (J mol−1) | 39![[thin space (1/6-em)]](https://www.rsc.org/images/entities/char_2009.gif) 967 967 |
20063 |
| M 2 (mol kg−1) | 2.837 | 4.731 |
| D 0 (1/kPa) | 4.60 × 10⁻⁸ | 1.41 × 10⁻¹⁶ |
| Q 2 (J mol−1) | 37900 |
71003 |
Four-step PVSA experiments
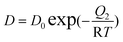
A typical pressure profile of the 4-step cycle experiment (Fig. 2 (A)) in each column obtained by MINSA is shown in Fig. 4: adsorption occurred at 7.2 bar (region I), the column was then depressurized to a desired low pressure according to different depressurization times (region II) before it was evacuated by a vacuum pump for certain time to regenerate the column (region III). Finally the column was repressurised to the adsorption pressure with feed gas to start another cycle (IV). The profile may change from experiment to experiment due to step time change or more additional steps as they varied in different experiments.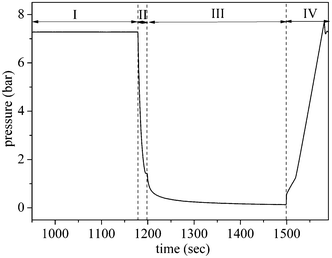 | ||
| Fig. 4 Pressure profile of one cycle: (I) AD step, (II) DP step, (III) DE step, and (IV) RP step | ||
Different adsorption step times were examined in order to find a suitable adsorption time which could produce acceptable CO2 purity and CO2 recovery. The simulation of the CO2 front movement in the adsorption bed (Fig. 5) shows that the CO2 front moves further from the top down to the bottom of the bed when adsorption time was increased as expected, and broke through the column when the adsorption time reached 320 s. The front was at the column exit when the adsorption time was set to 280 s. The simulation results were then used as a reference point for experimental operation.
 | ||
| Fig. 5 CO2 front movement in the column from simulations: 120 °C | ||
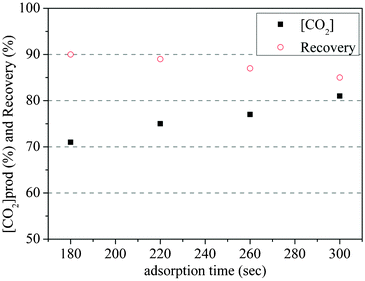
Two-bed experimental cyclic PVSA processes with the synthetic gas mixture were conducted at 120 °C with different adsorption times. It is clear from Fig. 6 that the CO2 concentration in the product stream increased and the recovery of CO2 decreased as adsorption time was extended. This is expected since longer adsorption time leads to the movement of the CO2 front further to the bottom of the column reducing the length of un-used bed which, in turn, resulted in higher CO2 concentrations when it was subsequently desorbed from the adsorbent.
 | ||
| Fig. 6 Effect of adsorption time on process performance | ||
However, a longer adsorption time leads to partial CO2 breakthrough thus lowering the recovery of CO2. Fig. 7 shows the CO2 concentrations in the waste line during cycling experiments with different adsorption times. The peaks correspond to the breakthrough of the CO2 and range from smallest (at 180 s) to largest (320 s) with a rapid increase between 260 and 300 s.
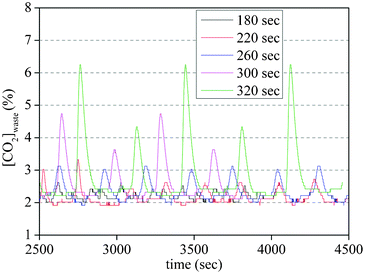 | ||
| Fig. 7 Effect of adsorption time on the waste line CO2 concentration (exit of bed) | ||
Combining the results of simulation and experiments, an adsorption time of 250 s was taken as an appropriate adsorption time for further adsorption process testing. At this adsorption time, the purity of CO2 was about 80%, and recovery was less than 90% in the 4-step cycle process. As purity is greatly affected by the starting pressure in the vacuum step,26 it was likely that the addition of a pressure equalization step would improve purity. In the 4 step cycle experiments, the final pressure reached during depressurization was in the range of 1 bar to 2 bar, depending on the depressurization time. If a pressure equalization step is added, the pressure in the column would decrease to between 0.5 and 1 bar; this would potentially increase the purity of the recovered CO2. Therefore 8-step cycle PSA experiments were carried out with the aim of increasing the purity of product CO2.
Eight-step cycle experiments with pressure equalization
The effect of equalization pressures on PSA separating performance was investigated in this experiment. At the end of the co-current depressurization step, the pressure was controlled to vary from 1 bar to 2 bar. This resulted in a final pressure of from 0.5 to 1 bar at the end of the subsequent pressure equalization step.As shown in Fig. 8, the CO2 product purity increased from 86% to 90% when the starting pressure for the pressure equalization (PE) step changed from 2 bar to 1 bar. The introduction of a PE step resulted in higher CO2 concentration in the product gas. The CO2 product purity was only 74% at the same adsorption time in the four step cycle (the pressure at end of depressurisation step is 1.6 bar). The increase of purity with the decrease of starting equalization pressure can be attributed to an increase in the partial pressure of CO2 in the column because desorption of the adsorbed CO2 enriched the gas phase in CO2. This provided higher CO2 purity in the product on the subsequent evacuation step. As Fig. 8 shows, up to 90% purity is achievable.
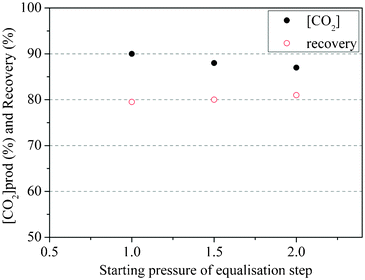 | ||
| Fig. 8 Effect of pressure equalization step at 120 °C | ||
Ten-step cycle experiment with product purge
In order to further improve the purity of CO2 in the product gas, a CO2 product purge step was added to the cycle so that strongly adsorbed CO2 is used to purge N2 from both gas phase (void space) and the adsorbed phase in the adsorption column while simultaneously enriching the adsorbed phase in CO2 and hence providing higher CO2 product purity gas on evacuation. Because of experimental limitations, the heavy purge gas used in the experiments was not real product gas, but was simulated using pure CO2 gas balanced with 10% N2 gas (the CO2 concentration in the synthesized product gas was 90%, an achievable concentration for eight-step cycles). Two kinds of product purge steps were employed in the cycles; one was product purge after the pressure equalization step (post-PE), the other was product purge before the pressure equalization step (pre-PE) (Fig. 9).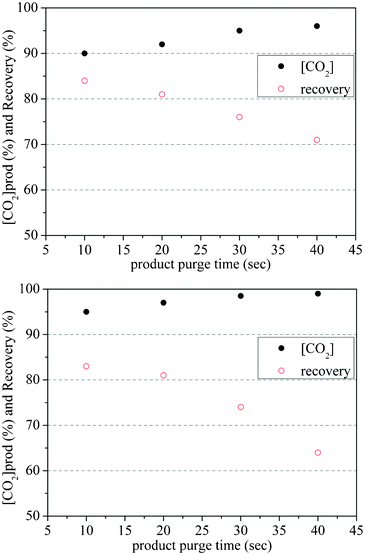 | ||
| Fig. 9 Effects of product purges after PE step (a) and before PE step (b) on PSA cycle performance at 120 °C | ||
In both of the cycles, the flow rate of the purge gas was 5 sL min−1. For the post-PE cycle, product purge occurred at 1 bar after pressure equalization starting at 2 bar, and the maximum purity which was obtained was 95% with a purge of 40 s. For pre-PE product, purge was performed at 1 bar and the pressure after the subsequent equalisation step was 0.5 bar. The desorption process started from lower pressure for pre-PE than post-PE so that less remaining N2 in the adsorption column appeared in the CO2 product gas stream; this resulted in a higher CO2 product concentration downstream. The maximum CO2 product purity in the pre-PE type of cycle was 99% with a 40 s purge step. Increase in product purge resulted in greater removal of N2 (replaced by CO2 in the product purge gas) from voids in the adsorption bed and from the solid phase. However, as more purge gas (increasing purge time) passed into the adsorption column, the CO2 concentration in the purge effluent increased, and there was a significant decline in CO2 recovery. In future, with more sophisticated cycle designs, it may be possible to recycle this purge effluent to restore the loss in CO2 recovery.
PVSA results with real coal gasification syngas
After preliminary experiments performed with simulated syngas, experiments with real coal gasification syngas were carried out at a gasification pilot plant using the optimised process parameters obtained with simulated syngas. The real gas introduced to the adsorption system was at room temperature and the pressure of the syngas was >7.2 bar. The gas compositions are as follows: CO: 13.64%, H2: 11.74%, CH4: 2.50%, CO2: 12.88%, balanced with nitrogen. The overall performance of these four processes at 120 °C is shown in Fig. 10a. The results obtained with the real coal gasification syngas followed the same trend as those with simulated syngas. Processes with a pressure equalization (PE) step (process B) showed considerably higher CO2 concentration results than that without PE step (process A). For processes with simulated product purge after pressure equalization step (process C), the product purity did not follow the expected results; it was lower than that in process B. The process with simulated product purge before pressure equalization step (process D), gave the highest CO2 product purity. Recovery results, however, showed an obvious trade-off regardless of the dissimilarity of the processes as expected. Results at 200 °C also showed a similar trend, as shown in Fig. 10b. Results with more sophisticated designs (process B, C and D) show better performance in terms of CO2 concentration and their results were not much different from those at 120 °C.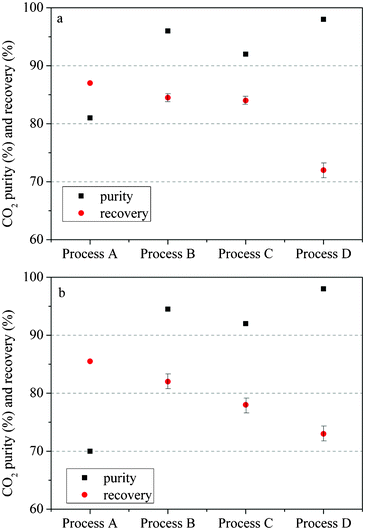 | ||
| Fig. 10 CO2 concentration and recovery results from four different PVSA processes at: (a) 120 °C; (b) 200 °C | ||
Therefore, it can be seen that zeolite 13X is still effective for CO2 capture at 120 °C and 200 °C from real coal gasification syngas with current feed gas conditions as mentioned previously. The CO2 concentration in the product stream from process D at 120 °C and 200 °C can meet the requirement of CO2 sequestration in terms of CO2 purity. Future work is needed to confirm the long term stability of the adsorbent and the effect of impurities such as H2S and NH3.
Conclusions
Zeolite 13X was investigated for its ability to capture CO2 from IGCC streams at elevated temperatures. Isotherms of CO2 adsorption on zeolite 13X at 90 °C, 120 °C, and 200 °C were measured and represented with the Dual-site Langmuir model. The fitted Langmuir parameters were then used for adsorption cycle design. Four different cycles were designed and tested with simulated coal gasification syngas. In the four step cycle experiment, it was found that the maximum CO2 concentration obtained was 80% which was far from the required 95% CO2 concentration. With the addition of pressure equalization steps, the eight step PSA experiment could result in a CO2 concentration of 90%, and it was found that the starting pressure of equalization played an important role in terms of the final product concentration. With the addition of a product purge step, the ten-step cycle could produce a CO2 concentration of more than 95%, meeting the requirement of sequestration. In summary, it is confirmed that zeolite 13X can be used for CO2 capture from real coal gasification gases at 120 °C with acceptable performance when proper cycles are designed.Acknowledgements
We acknowledge the funding provided by the Australian Government through its CRC Program to support this CO2CRC research project.References
- D. P. Schrag, Science, 2007, 315, 812–813 CrossRef CAS.
- IEA, World energy outlook 2010, 2010 Search PubMed.
- AEMO, Australian Energy Market Operator, 2009.
- T. Johnson, presented in part at the Coal 21 1st Annual Conference, Sydney, 5th–6th April, 2005.
- D. P. Hagewiesche, S. S. Ashour, H. A. Al-Ghawas and O. C. Sandall, Chem. Eng. Sci., 1995, 50, 1071–1079 CrossRef CAS.
- R. Maceiras, E. Alvarez and M. A. Cancela, Chem. Eng. J., 2008, 138, 295–300 CrossRef CAS.
- S. Paul, A. K. Ghoshal and B. Mandal, Chem. Eng. Sci., 2009, 64, 313–321 CrossRef CAS.
- F. Bougie and M. C. Iliuta, Chem. Eng. Sci., 2009, 64, 153–162 CrossRef CAS.
- M. Mavroudi, S. P. Kaldis and G. P. Sakellaropoulos, Fuel, 2003, 82, 2153–2159 CrossRef CAS.
- M. Amelio, P. Morrone, F. Gallucci and A. Basile, Energy Convers. Manage., 2007, 48, 2680–2693 CrossRef CAS.
- C. Paolo, G. K. Thomas and G. L. Giovanni, J. Eng. Gas Turbines Power, 2007, 129, 123–134 CrossRef.
- K. Okabe, H. Mano and Y. Fujioka, Int. J. Greenhouse Gas Control, 2008, 2, 485–491 CrossRef CAS.
- C. T. Yavuz, B. D. Shinall, A. V. Iretskii, M. G. White, T. Golden, M. Atilhan, P. C. Ford and G. D. Stucky, Chem. Mater., 2009, 21, 3473–3475 CrossRef CAS.
- Z. Yang, M. Zhao, N. H. Florin and A. T. Harris, Ind. Eng. Chem. Res., 2009, 48, 10765–10770 CrossRef CAS.
- G. Xiao, R. Singh, A. Chaffee and P. Webley, Int. J. Greenhouse Gas Control, 2011, 5, 634–639 CrossRef CAS.
- S. Wang, S. Yan, X. Ma and J. Gong, Energy Environ. Sci., 2011, 4, 3805–3819 CAS.
- K. B. Lee, M. G. Beaver, H. S. Caram and S. Sircar, Ind. Eng. Chem. Res., 2008, 47, 8048–8062 CrossRef CAS.
- Z. Yong, V. Mata and A. E. Rodrigues, Sep. Purif. Technol., 2002, 26, 195–205 CrossRef CAS.
- Q. Wang, J. Luo, Z. Zhong and A. Borgna, Energy Environ. Sci., 2011, 4, 42–55 CAS.
- S. Walspurger, L. Boels, P. D. Cobden, G. D. Elzinga, W. G. Haije and R. W. van den Brink, ChemSusChem, 2008, 1, 643–650 CrossRef CAS.
- Y. Ding and E. Alpay, Process Saf. Environ. Prot., 2001, 79, 45–51 CrossRef CAS.
- R. V. Siriwardane, M. S. Shen, E. P. Fisher and J. Losch, Energy Fuels, 2005, 19, 1153–1159 CrossRef CAS.
- Y. Wang and M. D. LeVan, J. Chem. Eng. Data, 2009, 54, 2839–2844 CrossRef CAS.
- G. Li, P. Xiao, P. Webley, J. Zhang, R. Singh and M. Marshall, Adsorption, 2008, 14, 415–422 CrossRef CAS.
- P. A. Webley and J. He, Comput. Chem. Eng., 2000, 23, 1701–1712 CrossRef CAS.
- P. Xiao, J. Zhang, P. Webley, G. Li, R. Singh and R. Todd, Adsorption, 2008, 14, 575–582 CrossRef CAS.
- X. Chu, Y. Zhou, Y. Zhang, W. Su, Y. Sun and L. Zhou, J. Phys. Chem. B, 2006, 110, 22596–22600 CrossRef.
- K. Kotoh, S. Takashima and Y. Nakamura, Fusion Eng. Des., 2009, 84, 1108–1112 CrossRef CAS.
| This journal is © The Royal Society of Chemistry 2012 |