A simple approach to generate efficient white light emission from a ZnO–ionic liquid complex
Arik
Kar
,
Simanta
Kundu
and
Amitava
Patra
*
Department of Materials Science, Indian Association for the Cultivation of Science, Kolkata, 700 032, India. E-mail: msap@iacs.res.in; Tel: (+91)-33-2473-4971; Fax: (+91)-33-2473-2805
First published on 23rd March 2012
Abstract
A simple method has been described for the generation of white light from cationic ionic liquid (IL) compounds 1-n-butyl-3-methylimidazolium tetrafluoroborate ([BMIM]BF4) stabilized ZnO nanocrystals (NCs). Upon mixing of the IL with the ZnO NCs, the absorption band is red shifted from 245 nm to 285 nm which is attributed to the charge-transfer band due to donor–acceptor systems. The blue emission band at 420 nm for pure IL is originated from the π–π* transition in the imidazolium moiety and the strong yellow band at 557 nm is due to the defect emission of the ZnO NCs. In the case of ZnO NCs in the IL, the combination of the blue emission from the ionic liquid and the yellow emission from ZnO gives intense white light. Control experiments have been done with varying concentration of IL and ZnO NCs to understand the best conditions for efficient white light generation. The maximum quantum efficiency of the white light emission was found to be 4.7%.
1. Introduction
Materials having tunable multicolour emissions have received considerable attention for theirs important applications in biological labeling1 and opto-electronics as potential light emitting displays.2 Mainly, three kinds of materials; quantum dots of various sizes, organic dye-doped semiconducting polymer nanoparticles and lanthanide-doped nanomaterials are being used for the generation of multicolour/white light emission. Again, white light generation by mixing different light of appropriate wavelengths is currently a hot topic of research because white light emitting devices would reduce global electricity consumption drastically.3 There are several reports on white light generation from different carbonic quantum dots,4 DNA-assisted methods through FRET,5 different dye–polymer nanoconjugates,6 different core–shell materials,7etc.ZnO is an important II-VI semiconductor, which exhibits a wide band gap (Eg = 3.37 eV at 300 K). The strong UV emission in the range 375–405 nm is due to the free exciton emission from the wide band gap and the green emission peak at 545 nm is due to a deep-level or trap-state emission. Vanheusden et al.8 suggested that the green emission is due to the singly ionized oxygen vacancy in the ZnO nanocrystals (NCs). ZnO NCs have recently attracted great attention for bio-imaging applications because it is nontoxic, chemically stable in air, and the PL emission of the ZnO NCs has been successfully tuned from blue to yellow.9 Generally the blue emission is not very bright compared to yellow emission. Again, the green and yellow emission of the ZnO NCs have better prospects in biological labeling as compared to the blue emission. Xia et al. reported polymer-stabilized nano ZnO with blue PL emission.10 It is demonstrated that stable aqueous ZnO@polymer core–shell nanoparticles with tunable photoluminescence are being used for cell imaging.11 Recently, it is reported that lanthanide-doped ZnO NCs are found to be suitable for white light generation.12 Rao et al. reported white light generation from ZnO nanoparticles admixed with graphene and GaN.13
Ionic liquids (ILs), especially those substituted with imidazolium cations, are drawing considerable attention due to their low toxicity, high chemical/thermal stability, negligible vapor pressure, non-flammability, etc.14 These types of ILs exhibit unusual fluorescence behavior, which covers a significant portion of the visible emission. There are also several reports in the literature on the synthesis of ZnO nanostructures from IL precursors.15–17 However, there is no report on white light generation from a ZnO–IL system. Chen et al. reported the preparation of ZnO NCs using an IL salt containing Zn2+ ions. They reported the blue to yellow emission of the ZnO NCs with varying reaction conditions.18 Again, Hao et al. used a new kind of IL crystal precursor containing Zn cations for obtaining blue and green fluorescent ZnO NCs.19 Chen et al. reported the spontaneous superlattice formation of ZnO NC using ionic liquid molecules.20
In this contribution, we describe a simple approach for generation of white light from ZnO NC–cationic IL complex which is new and unprecedented. Here, we used the IL 1-n-butyl-3-methylimidazolium tetrafluoroborate ([BMIM]BF4) because it shows a strong blue emission around 420 nm due to the π–π* transition. On the other hand, we have prepared three different sizes of ZnO NCs, having defect states because it is known to produce yellow emissions. Therefore, our motivation is to generate white light using a ZnO NC–IL mixed complex. Control experiments have been done with varying the concentrations of the IL and the ZnO NCs to understand the best conditions for efficient white light generation. Finally, we tried to understand the excited state interactions in the ZnO–IL complex using steady-state and time-resolved spectroscopy.
2. Experimental
2.1 Preparation of the IL
The IL 1-n-butyl-3-methylimidazolium tetrafluoroborate ([BMIM]BF4) was used as a dispersive medium for the ZnO NCs. The synthesis of ([BMIM]BF4) follows a two-step process. In the first step, 1-n-butyl-3-methylimidazolium bromide ([BMIM]Br) was prepared by a reported method21 using microwave irradiation in a mixture of 1-methyl imidazole (Aldrich) and n-butylbromide (Spectrochem). The second step involves a simple ion exchange of the [BMIM]Br with NaBF4 (Merck) in water medium as reported earlier.22 The prepared IL was then purified and dried in a vacuum. Before using the IL, it was dried under high vacuum at 60 °C to evaporate the water.2.2 Preparation of different sized ZnO NCs
ZnO NCs were prepared through a slightly modified precipitation method by using LiOH as the precipitation agent in ethanol which was reported earlier.23 In general, 0.2 mmol of zinc acetate was dissolved in 20 ml of absolute ethanol. The mixture was stirred at room temperature for 30 min to completely dissolve the zinc acetate. Then 0.86 mmol of LiOH was also dissolved in 20 ml of absolute ethanol, and this alkaline solution was added dropwise to the zinc acetate/ethanol solution and the pH value of the solution was adjusted to 9 by controlling the addition of the LiOH/ethanol solution. The total reaction mixture was then stirred for 2 h. After reaction for 2 h, the solution became turbid, indicating ZnO NCs had formed. The pH values of the solution were tuned to 11 and 13 by controlling the amount of LiOH added. The obtained ZnO NCs that precipitated at different pH values were first washed using absolute ethanol to remove unreacted precursors. This washing process was repeated three times. The purified nanocrystals were then dispersed in absolute ethanol for storage.2.3 Preparation of ZnO NCs in the IL
To prepare ZnO NCs in the IL, the required amount of ZnO NCs were taken in a 5 ml culture tube with 3.5 ml of absolute ethanol and was sonicated for 10 min in an open beaker kept in an ice bath using an ultrasonic sonicator. After dispersion of the ZnO NCs in ethanol, the required amount of IL was added to it and again sonicated for 1 h in the same open beaker kept in an ice bath. After sonication a light yellow viscous solution was obtained which was stable for a long time. This viscous solution is our prepared ZnO NCs in IL and it can be now used for the white light generation.The crystalline phases of the prepared ZnO NCs were identified by X-ray diffraction (XRD) using a Philips model PW-1730, powder X-ray diffractometer, using a Cu-Kα source (1.5418 Å radiation) and a longer scan time. Micro structural characterizations of the ZnO NCs were carried out by transmission electron microscopy (TEM, JEOL Model 200).TEM was also used to study the morphology and particle sizes of the resulting powders. The Raman spectrum was produced at room temperature on a LabRam HR Raman spectrometer with a helium–neon laser at an excitation wavelength of 633 nm. The UV-Vis spectra were taken in UV-2401 PC SHIMADZU spectrophotometer. The zeta potential values of the samples were measured in Malvern instruments. The emission spectra of all the samples were measured using a fluoro Max-P (Horiba Jobin Yvon) Luminescence Spectrometer. All measurements were done at room temperature. All samples were excited at 335 nm, under the same conditions. For the time-correlated single-photon counting (TCSPC) measurement, the samples were excited at 340 nm using a picosecond NANO-LED IBH 340.
For the various ZnO NC based materials, Quantum yields for white light emission were calculated by the formula:
 | (1) |
Here, t refers to the test sample, s refers to the standard sample, F denotes the area under the PL intensity versus wavelength curve, A stands for the absorbance and n for the refractive indices of the solvents used for the purpose. Quinine sulphate was used as the standard since it has UV excitation in the same range of wavelengths as the ZnO NC based materials. Moreover, the emission spectrum of quinine sulfate is in the same range as that of ZnO NC based materials. The quantum yield for quinine sulfate is 0.54 (in 0.1 M H2SO4) for the spectral range of 400–600 nm.
3. Results and discussion
Fig. 1a depicts the XRD pattern of the ZnO NCs prepared at pH 9, 11 and 13, respectively. All the diffraction peaks can be readily indexed to the hexagonal phase of ZnO with calculated lattice parameters a = 3.240, c = 5.188 for ZnO NCs synthesized at pH = 9; a = 3.231 and c = 5.174 for ZnO NCs synthesized at pH = 11, and a = 3.228 and c = 5.173 for ZnO NCs synthesized at pH = 13. All are in good agreement with the reported values (JCPDS card no. 36-1451). It is clearly seen from Fig. 1a that the width of the reflection is considerably broadened with increasing pH, suggesting the crystallite size decreases with increasing the pH. Fig. 1b shows the TEM pictures of the ZnO NCs synthesized at various pHs and the estimated average sizes of the particles are 30.7, 13.5 and 9.9 nm for ZnO NCs synthesized at pH 9, 11 and 13 respectively. The Raman spectrum of the ZnO NCs prepared at different pHs along with bulk ZnO is shown in Fig. 1c and three main peaks at 331, 379 and 436 cm−1 are observed. The very intensive Raman mode in ZnO–O E2high at 436 cm−1 dominantly assigned to the oxygen vibration and the most intensive second-order mode in low-wave number region at 331 cm−1 is ascribed to difference E2high − E2low.24 Another peak at 379 cm−1 corresponds to A1(TO) mode. All vibration modes are observed for different sizes of ZnO NC in good agreement with those for the bulk ZnO (Fig. 1c). The full width at half maximum (FWHM) of the E2(high phonon) at 436 cm−1 increases with increasing the pH, indicating the crystallite size decreases.25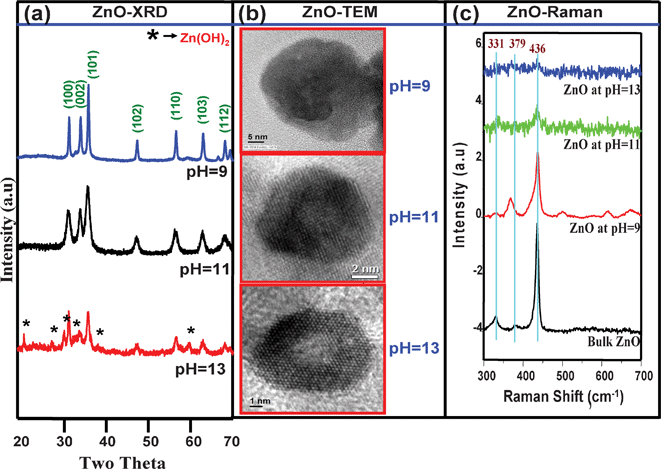 | ||
| Fig. 1 (a) XRD patterns of different sized ZnO NCs (b) TEM micrographs of different sized ZnO NCs and (c) room temperature Raman spectra of different sized ZnO NCs synthesized at different pHs along with bulk ZnO. | ||
Ground state absorption spectra for ZnO NCs in the presence and absence of the IL are compared in Fig. 2a. Upon mixing of the IL with the ZnO NCs, the absorption band is red shifted from 245 nm to 285 nm. The red shifted absorption is attributed to the charge-transfer band, which has been observed for donor–acceptor systems. Charge-transfer complexation [[BMIN][BF4]......ZnO NCs] is evident by ground state absorption.26 To further confirm the formation of the ZnO–IL complex, the zeta potential values of the IL, ZnO NCs, and the ZnO NCs in the IL are presented schematically in Fig. 2b. The surface charge of the ZnO NCs is −8.38 mV and the surface charge of the IL is +0.54 mV. However, the surface charge of the ZnO–IL complex is +3.68 mV which also indicates the formation of the ZnO–IL complex. It is seen from the TEM images (Fig. 2c) that the ZnO NCs are well dispersed in the IL.
 | ||
| Fig. 2 (a) UV spectra of the ZnO NCs and the ZnO NCs in the IL; (b) schematic representation of different zeta potential values of the IL, ZnO NCs, and ZnO NCs in IL; (c) TEM micrographs of the ZnO NCS and ZnO NCS in IL after ultrasonic irradiation. | ||
The photoluminescence (PL) spectra of different sizes of ZnO NCs, after excitation at 335 nm, are shown in Fig. 3a. The band at 377 nm is due to the band edge emission, and the band at 557 nm is attributed to the defect emission.9 The yellow emission at about 557 nm is attributed to the transition between the electron at the conduction band and the hole at the vacancy associated with the surface defects.27 This yellow emission is very prominent and broad with respect to band edge emission, due to large surface defects. The relative intensity of the yellow emission band at 557 nm increases with decreasing particles size. It is to be noted that no emission band is obtained at 557 nm for the sample prepared at pH 9 as it is a defect free sample. Fig. 3b (a, b and c) shows the PL spectra of pure IL [BMIN][BF4], ZnO NCs prepared at pH 13, and ZnO NCs in IL at room temperature, respectively. The blue emission band [Fig. 3b (a)] at 420 nm appears for pure IL, which is originates from the π–π* transition in the imidazolium moiety.28 The strong yellow band at 557 nm is observed for the ZnO NCs [Fig. 3b (b)]. It is interesting to note that the photoluminescence properties of the IL is excitation dependent28,29 and the emission band shifts towards a higher wavelength with increasing of the wavelength of excitation. We investigated the excitation dependent emission spectra of the IL and have found two emission maxima for bmim for all the cases, and it was found that the emission intensity of the IL is maximum at 335 nm excitation. Thus, we used 335 nm as the excitation wavelength for our study to get the maximum PL intensity. In the case of the ZnO NCs in IL, two strong emission bands at 420 nm and 547 nm are observed [Fig. 3b (c)]. It is interesting to note that a bright white light is observed when ZnO NCs in IL are excited at 335 nm [Fig. 3b (c)]. There is no change in the emission peak position of the IL after addition of the ZnO NCs, but the peak position due to the ZnO NCs is found to be blue shifted by 10 nm. This may be attributed to modification of the surface defects of the ZnO nanoparticles by the IL.18 Actually, the blue emission from the IL and the yellow emission from ZnO are combined together to give an intense white light emission. Fig. 3c represents the blue, yellow and white colour of the IL, ZnO and ZnO NCs in IL, respectively after UV irradiation at 335 nm and Fig. 3d is the CIE plot for the IL, ZnO NCs and ZnO NCs in IL, respectively. The quantum efficiency of this white light emission is found to be 4.7% (using eqn (1)). Rao et al.13 found the quantum yields of white light is 4–6% from their ZnO NCs in the graphene system. They also utilised the blue emission from graphene-based materials to combine with the yellow emission from ZnO to produce white light sources.30
 | ||
| Fig. 3 (a) PL spectra of different sized ZnO NCs (b) PL spectra of the IL, ZnO NCs and ZnO NCs in IL (c) The photographs of the IL, ZnO and ZnO NCs in IL after UV irradiation at 335 nm and (d) CIE x–y chromatic diagram showing the locations of the emissions of the IL, ZnO and ZnO NCs in IL. | ||
Fig. 4a and 4b represent the PL spectra of the ZnO NCs (pH = 13) in IL with varying concentrations of IL and ZnO NCs. In Fig. 4a, the IL concentration varies from 5.7 μl ml−1 to 22.8 μl ml−1 keeping the ZnO concentration same (0.28 mg ml−1) and in Fig. 4b, ZnO concentration varies from 0.14 mg ml−1 to 0.43 mg ml−1 keeping the IL concentration the same (11.4 μl ml−1). We calculated CIE coordinates for all the compositions and found that the best white light emission occurs when the ZnO concentration is 0.28 mg ml−1 and the IL concentration is 11.4 μl ml−1 (x = 0.30, y = 0.33). It is obvious that on increasing the IL conc. beyond 11.4 μl ml−1, blue emission increases and on increasing the concentration of ZnO beyond 0.28 mg ml−1, the yellow emission increases. We also explored the generation of white light using ZnO NCs synthesized at pH = 11 with varying IL concentration (Fig. 4c). It was found from the CIE coordinate calculations that the best white light emission (the quantum efficiency is found to be 4.1%) occurs when the ZnO concentration is 0.28 mg ml−1 and the IL concentration is 17.1 μl ml−1 for ZnO NCs prepared at pH = 11. Fig. 4d represents the best composition for white light emission with changing size. ZnO NCs having a size of approximately 30.7 nm (prepared at pH = 9) showed no yellow emission at 557 nm, thus only blue emission due to the π–π* transition of the IL occurs when these ZnO NCs are mixed with the IL. It reveals that the white light emission can be generated from surface defects containing ZnO NCs with an appropriate concentration of IL.
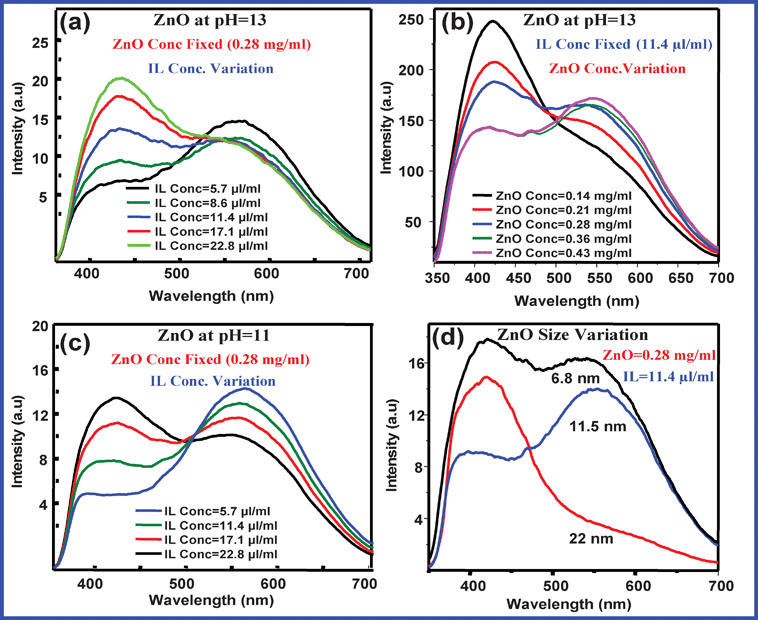 | ||
| Fig. 4 (a) PL spectra of the ZnO NCs in IL (pH = 13) at their different concentrations of IL and at a fixed concentration of ZnO NCs (b) PL spectra of ZnO NCs in IL (pH = 13) at their different concentrations of ZnO and fixed concentration of IL. (c) PL spectra of ZnO NCs in IL (pH = 11) at their different concentrations of IL and fixed concentration of ZnO NCs. (d) PL spectra of ZnO NCs in IL having different sizes of ZnO NCs at fixed concentrations of IL and ZnO NCs. The wavelength of excitation is 335 nm for all cases. | ||
To gain more insight into the mechanism of the generation of white light from the ZnO NCs in IL, we propose a schematic model for the different relaxation processes of the photoexcited IL and ZnO NCs. In the left panel of Fig. 5a, different states of the imidazole moiety of the IL [BMIN][BF4] viz. non-bonding state (n), bonding state (π) and antibonding state (π*) are presented and there are two types of transition i.e. n–π* and π–π* exists in that part.28 Due to the lower availability of the non-bonding electron, the π–π* transition is more prominent, which will give rise to the blue emission at around 420 nm. Now, as for as the ZnO NCs, some O2− ions can escape from the host lattice, leading to formation of oxygen vacancies. This oxygen vacancy centre can trap an electron, leading to formation of defect states.31 There are three energy levels viz. valence band (VB), defect states and conduction band (CB). ZnO NCs first create positive holes in the valence band and negative electrons in the conduction band after photo excitation. The hole in the VB can trap at the oxygen vacancy sites. Then, this surface trapped hole tunnels back into the particle to recombine with an electron to form the V0•• centre at the surface of the particle. Then recombination of this centre with an electron in the CB gives rise to trap emission in visible yellow light.32 In the case of ZnO NCs in IL photoexcitation, the π–π* transition in the IL gives blue light and the transition between the electron in the CB and hole trapped in the defect states give rise to yellow emissions for the ZnO NCs. Now a combination of blue emission from the IL and yellow emission from ZnO gives intense white light (Fig. 5a). Charge-transfer also occurs from the IL to the ZnO NCs, and it is confirmed by the time-resolved decay time analysis of the IL. The PL quenching and the shortening of decay time of the IL confirms the charge-transfer process from IL to ZnO. Fig. 5b shows the time-resolved PL decay curves for pure IL and ZnO NCs in IL at the emission wavelength peak of 420 nm. The decrease of average lifetime value in ZnO NCs in IL (2.3 ns) compares to pure IL (4.3 ns), clearly indicating the charge-transfer process is occurring from the IL to the ZnO NCs.
 | ||
| Fig. 5 (a) Schematic model proposed for the different transitions in the IL, different relaxation processes in the ZnO NCs and a possible mechanism which is proposed for the white light generation from the ZnO–IL complex. (b) PL decays of the IL and IL+ZnO at 420 nm emission wavelength. | ||
4. Conclusion
In conclusion, we demonstrated the efficient white light generation in a ZnO NC–IL complex. Upon mixing of the IL with ZnO NCs, the absorption band is red shifted from 245 nm to 285 nm, which is attributed to the charge-transfer band. Charge-transfer complexation [[BMIN][BF4]......ZnO NC] is evident by the ground state absorption. In the case of ZnO NCs in IL photo-excitation, the π–π* transition in the IL gives blue light and the transition between the electron in the CB and hole trapped in defect states give rise to yellow emission for the ZnO NCs. The PL quenching and the shortening of the decay time of IL indicates the charge-transfer process from the IL to the ZnO NCs. The quantum efficiency of this white light emission is found to be 4.7%.Acknowledgements
We gratefully acknowledge the CSIR for financial support. We give special thanks to Catalina David and HORIBA Jobin Yvon S.A.S Raman division for the Raman measurements of our samples.References
- (a) S. N. Baker and A. J. Baker, Angew. Chem., Int. Ed., 2010, 49, 6726–6744 CrossRef CAS; (b) A. Jaiswal, S. S. Ghosh and A. Chattopadhyay, Chem. Commun., 2012, 48, 407–409 RSC.
- S. Reineke, F. Lindner, G. Schwartz, N. Seidler, K. Walzer, B. Luessem and K. Leo, Nature, 2009, 459, 234–238 CrossRef CAS.
- S. C. Vanithakumari and K. K. Nanda, Adv. Mater., 2009, 21, 3581–3584 CrossRef CAS.
- F. Wang, Y. H. Chen, C. Y. Liu and D. G. Ma, Chem. Commun., 2011, 47, 3502–3504 RSC.
- K. S. Sanju, P. P. Neelakandan and D. Ramaiah, Chem. Commun., 2011, 47, 1288–1290 RSC.
- V. Vohra, G. Calzaferri, S. Destri, M. Pasini, W. Porzio and C. Botta, ACS Nano, 2010, 4, 1409–1416 CrossRef CAS.
- X. Wang, W. Li and K. Sun, J. Mater. Chem., 2011, 21, 8558–8565 RSC.
- K. Vanheusden, C. H. Seager, W. L. Warren, D. R. Tallant and J. A. Voigt, Appl. Phys. Lett., 1996, 68, 403–405 CrossRef CAS.
- A. van Dijken, E. A. Meulenkamp, D. Vanmaekelbergh and A. Meijerink, J. Phys. Chem. B, 2000, 104, 4355–4360 CrossRef CAS.
- H.-M. Xiong, Z.-D. Wang and Y.-Y. Xia, Adv. Mater., 2006, 18, 748–751 CrossRef CAS.
- H.-M. Xiong, Y. Xu, Q.-G. Ren and Y.-Y. Xia, J. Am. Chem. Soc., 2008, 130, 7522–7523 CrossRef CAS.
- S. Sadhu, T. Sen and A. Patra, Chem. Phys. Lett., 2007, 440, 121–124 CrossRef CAS.
- P. Kumar, L. S. Panchakarla, S. V. Bhat, U. Maitra, K. S. Subrahmanyam and C. N. R. Rao, Nanotechnology, 2010, 21, 385701–385706 CrossRef.
- R. D. Rogers and K. R. Seddon, Science, 2003, 302, 792–793 CrossRef.
- H. Zhu, J.-F. Huang, Z. Pan and S. Dai, Chem. Mater., 2006, 18, 4473–4477 CrossRef CAS.
- L. Wang, L. Chang, B. Zhao, Z. Yuan, G. Shao and W. Zheng, Inorg. Chem., 2008, 47, 1443–1452 CrossRef CAS.
- J. Zhang, J. Wang, S. Zhou, K. Duan, B. Feng, J. Weng, H. Tang and P. Wu, J. Mater. Chem., 2010, 20, 9798–9804 RSC.
- D.-P. Liu, G.-D. Li, Y. Su and J.-S. Chen, Angew. Chem., Int. Ed., 2006, 45, 7370–7373 CrossRef CAS.
- Q.-T. Wang, X.-B. Wang, W.-J. Lou and J.-C. Hao, ChemPhysChem, 2009, 10, 3201–3203 CrossRef CAS.
- D.-P. Liu, G.-D. Li, J.-X. Li, X.-H. Li and J.-S. Chen, Chem. Commun., 2007, 4131–4133 RSC.
- R. S. Varma and V. V. Namboodiri, Chem. Commun., 2001, 643–644 RSC.
- J. Dupont, C. S. Consorti, P. A. Z. Suarez and R. F. De Souza, Org. Synth., 2003, 79, 236–243 Search PubMed.
- X. Tang, E. S. G. Choo, L. Li, J. Ding and J. Xue, Chem. Mater., 2010, 22, 3383–3388 CrossRef CAS.
- R. Cusco, E. Alarcon-Llado, J. Ibanez, L. Artus, J. Jimenez, B. Wang and M. J. Callahan, Phys. Rev. B: Condens. Matter Mater. Phys., 2007, 75, 165202–165211 CrossRef.
- M. Scepanovic, M. Grujic-Brojcin, K. Vojisavljevic, S. Bernik and T. Sreckovic, J. Raman Spectrosc., 2010, 41, 914–921 CrossRef CAS.
- S. Murphy, L. Huang and P. V. Kamat, J. Phys. Chem. C, 2011, 115, 22761–22769 CAS.
- A. Van Dijken, E. A. Meulenkamp, D. Vanmaekelbergh and A. Meijerink, J. Phys. Chem. B, 2000, 104, 1715–1723 CrossRef CAS.
- A. Paul, P. K. Mandal and A. Samanta, J. Phys. Chem. B, 2005, 109, 9148–9153 CrossRef CAS.
- X.-W. Chen, J.-W. Liu and J.-H. Wang, J. Phys. Chem. B, 2011, 115, 1524–1530 CrossRef CAS.
- K. S. Subrahmanyam, P. Kumar, A. Nag and C. N. R. Rao, Solid State Commun., 2010, 150, 1774–1777 CrossRef CAS.
- L. Zhang, L. Yin, C. Wang, L. Ning, Y. Qi and D. Xiang, J. Phys. Chem. C, 2010, 114, 9651–9658 CAS.
- A. Kar, S. Kundu and A. Patra, J. Phys. Chem. C, 2011, 115, 118–124 CAS.
| This journal is © The Royal Society of Chemistry 2012 |