Influence of anion species on electrochemical dealloying of single-phase Al2Au alloy in sodium halide solutions
Zhonghua
Zhang
*,
Chi
Zhang
,
Junzhe
Sun
and
Tianyi
Kou
Key Laboratory for Liquid-Solid Structural Evolution and Processing of Materials (MOE), School of Materials Science and Engineering, Shandong University, Jingshi Road 17923, Jinan, 250061, P.R. China. E-mail: zh_zhang@sdu.edu.cn; Tel: +86-531-88396978; Fax: +86-531-88396978
First published on 13th March 2012
Abstract
The electrochemical dealloying of single-phase Al2Au alloy in 1 M sodium halide (NaF, NaCl, NaBr and NaI) aqueous solutions at 270, 290 and 340 K has been systematically investigated in this work. The effects of halide ions and temperature on the dealloying behavior have been studied with electrochemical methods like open-circuit potential measurements and dynamic polarization tests. Nanoporous gold (NPG) with a typical three-dimensional, bicontinuous, interpenetrating ligament-channel structure can be obtained from the single-phase Al2Au alloy by electrochemical dealloying in the NaCl, NaBr, and NaI solutions. In addition, the dealloyed NPG samples and the samples after coarsening at ambient conditions were characterized using field-emission scanning electron microscopy (FESEM). Morphological features like cracks and ligament sizes in NPG have been discussed. Furthermore, NPG samples that were almost free of cracks have been successfully prepared in the NaI solution at 340 K. Besides, based on the surface diffusion controlled coarsening mechanism, the surface diffusivities of gold adatoms along the alloy–electrolyte interfaces during dealloying have been evaluated in this work, as well as the activation enthalpy and activation entropy.
1. Introduction
Nanoporous (np) metals prepared by dealloying chemically or electrochemically, which was commonly known as selective corrosion of an alloy, have recently attracted great attention due to their interesting structures and potential applications. Nanoporous metals fabricated in this way generally assume a three-dimensional, bicontinuous, interpenetrating ligament-channel structure at the nanometer scale, with either monolithic or hierarchical microstructures. They have been widely investigated in such applications as catalysis, fuel cells, sensing, actuation, microfluidic controlling, etc.1–4 And nanoporous gold (NPG) is the top star thereof. However, further development of this type of interesting material, like assembly or integration into microdevices, is severely restricted by its brittle nature at the macroscopic scale although it is supremely strong and satisfactorily ductile under local deformation.5–7 Meanwhile, bulk nanoporous metals, in the form of membranes, sheets, ribbons, or blocks, are more convenient than those in the form of powders for further processing (e.g., fabrication of metallic composites by epitaxial growth1) and recycling. Besides, the fundamental study of the mechanical properties of the bicontinuous nanoporous networks generally requires bulk materials with as few pre-existing cracks before deformation as possible.5–7Fortunately, several studies have been devoted to the alleviation of the macroscopic mechanical disadvantages of np metals. For example, Jin et al.8 developed a nanoporous composite toughened by a second phase, and others9–12 introduced pre-treatment or improvement of dealloying conditions. Since the brittleness of NPG is believed to be caused by cracks or voids in the dealloyed metals, and since these cracks or voids are mostly either inherent from the precursor or brought on by the volume shrinkage during dealloying, the resultant metals are almost crack free with such procedures and improved parameters. Intriguingly, by means of preparing samples free of macroscopic crack nuclei, Jin et al.13 reported a millimeter-sized NPG sample that exhibits much higher ductility during compression and correspondingly lower strength.
Obviously, the elimination of cracks in the dealloyed np metals is of significance for the best utilization of such interesting materials. In addition to the optimized composition of the precursor alloy, the minimized volume contraction arising from dealloying is suggested to be a prerequisite for the preparation of NPG free of cracks; and in the case of dealloying electrochemically, potentials merely above the critical value for bulk dealloying and elevated temperatures seem to remarkably enhance the mechanical integrity. This combination of potential and temperature is indicative of a reduced dissolution rate of the less noble element in the alloy and enhanced surface diffusivity of the adatoms of the more noble element, so that the internal stresses introduced in the course of dealloying are largely relaxed in time. Yet, the diffusivity of the more noble element is susceptible not only to temperature but to the adsorptive ions in the electrolyte, e.g. hydroxide ions and halide ions. And if the ions in the electrolyte have an effect on both the dissolution rate and the surface diffusivity, it may render a new perspective on the investigation of the interaction or competition between the dissolution of the less noble element and the surface diffusion of the more noble element in the alloy during dealloying, and also on the study of the effects of the two competitive processes on crack formation in the dealloyed sample. With such an attempt, it seems to us that the dealloying system with an Al-based alloy as the precursor material and an aqueous solution containing halide ions as the electrolyte is the system of choice. The halide ions are well known to enhance the surface diffusivity of the adatoms, while Al in neutral aqueous solutions is safely passivated unless halide ions are present when there is dissolution of Al by pitting, which breaks the passivation film. Besides, the pitting and diffusion-enhancing abilities of the halide ions F−, Cl−, Br−, and I− are quite different. Therefore, it will be an interesting subject to systematically investigate the dealloying of Al-based alloys in electrolytes containing halide ions.
We have previously studied the electrochemical and chemical mechanisms of dealloying of the Al–Au alloy system in a NaCl aqueous solution at ambient conditions,14 and further, the electrochemical dealloying characteristics of the Al–Au, Ag, Pd, and Cu alloy systems in the NaCl solution.15 This research suggests the pitting corrosion nature of Al caused by the Cl− ion, as well as the remarkable influence on the morphologies of the resultant nanoporous metallic networks and the mobility of the more noble constituent. Based on the previous work, we try to focus here on the diffusion aspect, especially considering the effects of both halide ions and temperature. Among Al–Au systems, Al2Au is a good model material for this study compared to other Al–Au alloys which are composed of two phases (Al–Al2Au, or Al2Au–AlAu). In addition, since Au is believed to be satisfactorily stable in air, in this paper the single-phase Al2Au alloy was electrochemically dealloyed under constant potential control while the temperature and anion of the electrolyte were varied. Specifically, the electrochemical polarization behavior of the alloy in the electrolyte of 1 M NaX (X = Cl, Br, I and F) aqueous solutions at 270, 290, and 340 K was investigated and the resultant NPG samples were characterized by FESEM. Along with the above variations, interesting phenomena about the dealloying properties (e.g. critical potentials) of the same precursor alloy and the resultant morphologies (e.g. the ligament sizes and the presence of cracks) of the dealloyed NPG samples were observed. Furthermore, the diffusivities of gold adatoms were calculated and the corresponding activation enthalpy and entropy were discussed.
2. Experimental
The starting Al–33.4 Au (at. %) alloy was prepared from elemental Al (purity, 99.95 wt.%) and Au (purity, 99.9 wt.%) in a quartz crucible using a high-frequency induction furnace. Using a single roller melt spinning apparatus, the pre-alloyed ingots were remelted by high-frequency induction heating in a quartz tube and then melt-spun onto a copper roller with a diameter of 0.35 m at a speed of 1000 revolutions per minute (rpm) in a controlled argon atmosphere. The melt-spun ribbons obtained were typically 20–50 μm in thickness, 2–5 mm in width and several centimeters in length. The melt-spun Al–33.4 Au alloy was identified as being composed of a single Al2Au intermetallic compound by X-ray diffraction (XRD, Rigaku D/max-rB). For contrast, an elemental gold plate (purity, 99.9 wt.%) of ∼100 μm in thickness, was cut into a rectangular shape of 4 mm in width and 10 mm in length.Electrochemical measurements were performed in 1 M NaF, NaCl, NaBr, or NaI aqueous solution with a conventional three-electrode potentiostat (LK 2005A) under temperature control. The aggressive solutions were prepared from analytical-grade reagents and distilled water. The electrochemical setup consisted of a three-compartment electrolytic cell, with platinum foil as the counter electrode with a surface area of about 5 × 5 mm2, and a saturated calomel electrode (SCE) as the reference electrode. All potentials quoted were on the SCE scale. Temperature control was achieved with a commercial isothermal bath filled with water or a mixture of water and alcohol.
The electrochemical measurements were carried out in turn at 268, 270, 290 and 340 K in the cases of NaCl, NaBr, and NaI, but only at 290 K in NaF. Before each run of the tests, the electrodes were stabilized for 5–10 min in the solution while the curves of open circuit potential (Eocp) vs. time were recorded. Potentiodynamic curves were measured by sweeping the potential from a potential below the Eocp to an appropriate anodic potential, at a scan rate of 3 mV s−1. Both the open-circuit potential measurement and the anodic polarization step for the potentiodynamic curves were repeated at least three times to ensure a reasonable repeatability. Then the measurement results were averaged and reported, and the applied potentials for dealloying were determined according to the averaged results. The samples were dealloyed under constant potential until the currents were reduced to be near zero. After dealloying, the samples were rinsed with distilled water and anhydrous alcohol, then kept in anhydrous alcohol at 270 K (for samples prepared at this temperature) or at room temperature in air (for samples prepared at 268, 290 and 340 K). The microstructures of the dealloyed ribbons were characterized using a field-emission scanning electron microscope (FESEM, JSM-6700F).
3. Results and discussion
3.1 Electrochemical properties of Al2Au in 1 M sodium halide solutions
The open-circuit potentials (Eocp) and the corrosion potentials (Ecor), determined from Tafel curves (anodic polarization), of the alloy in sodium halide aqueous solutions at different temperatures are listed in Table 1 and typical curves are illustrated in Fig. 1 and 2.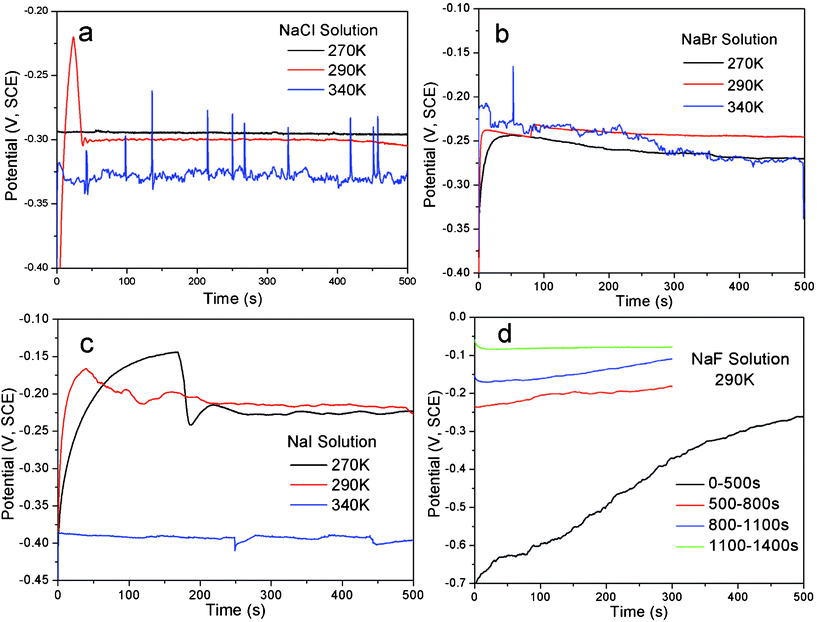 | ||
| Fig. 1 The curves showing the evolution of open-circuit potential (Eocp) with time of the single-phase Al2Au alloy, at the temperatures denoted, for 500 s, in 1 M (a) NaCl, (b) NaBr and (c) NaI solutions. In (d) are the Eocpvs. time curves of Al2Au in 1 M NaF solution for 1400 s at 290 K. | ||
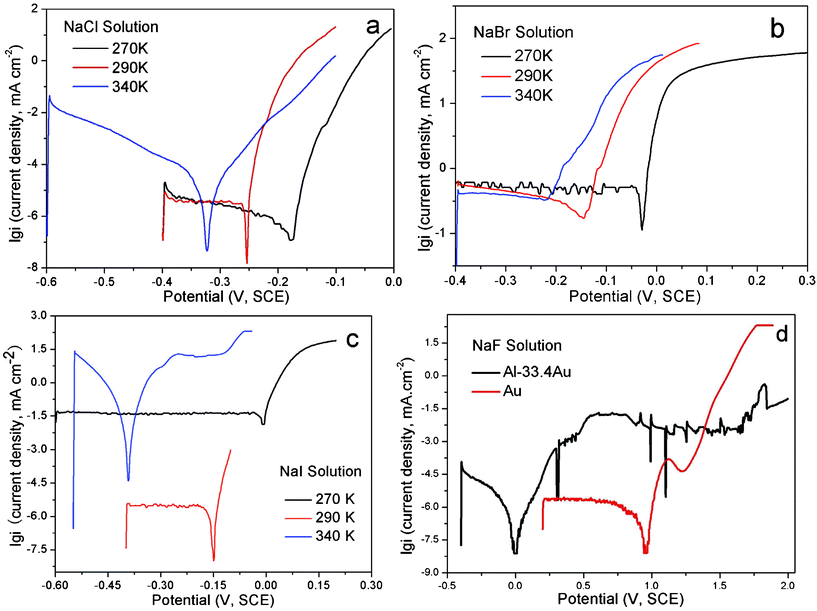 | ||
| Fig. 2 The Tafel (anodic polarization) curves of the Al2Au alloy at the temperatures denoted, in 1 M (a) NaCl, (b) NaBr and (c) NaI solutions. In (d) are the Tafel curves of Al2Au and elemental Au in 1 M NaF solution at 290 K. | ||
| T/K | |||||
|---|---|---|---|---|---|
| Halide ions | Items | 268 | 270 | 290 | 340 |
| Cl− | Eocp (V, SCE) | −0.31 | −0.30 | −0.30 | −0.33 |
| Ecor (V, SCE) | −0.17 | −0.18 | −0.25 | −0.32 | |
| ξ (mV) | 140 | 120 | 50 | 10 | |
| Br− | Eocp (V, SCE) | −0.23 | −0.24 | −0.24 | −0.27 |
| Ecor (V, SCE) | −0.05 | −0.03 | −0.15 | −0.22 | |
| ξ (mV) | 180 | 210 | 90 | 50 | |
| I− | Eocp (V, SCE) | −0.30 | −0.25 | −0.22 | −0.39 |
| Ecor (V, SCE) | −0.08 | −0.01 | −0.15 | −0.39 | |
| ξ (mV) | 220 | 240 | 70 | ∼0 | |
| F− | Eocp (V, SCE) | — | — | −0.08 | — |
| Ecor (V, SCE) | — | — | 0 | — | |
According to the results in Table 1, the open-circuit potential is generally less sensitive to temperature variation than the corrosion potential. Meanwhile, the Ecor values approach the Eocp values with increasing temperature, probably originating from the enhanced kinetics at elevated temperatures. Besides, the Eocp value of the alloy in the NaF aqueous solution at 290 K is remarkably higher than that in the other three solutions, regardless of the temperature. In contrast, the Ecor values of the alloy in NaBr and NaI solutions at low temperatures (268 and 270 K) are comparable to the Ecor value in NaF solution at 290 K, and it may suggest some similarity between the two, e.g. a tendency of passivation over pitting corrosion for Al in NaF at room temperature and in NaBr and NaI at low temperatures, as discussed below.
The results of Eocp and Ecor shown in Table 1 are inconsistent with those reported by Dursun et al.,16 who investigated the electrochemical dealloying of Ag–Au alloys in an aqueous solution of HClO4 + 0.1 M KCl/KBr/KI at room temperature and observed that Eocp and the critical overpotential ΔEcrit are the highest for KCl and the lowest for KI. The apparently contradictory results are probably caused by the differences in the composition of the precursor alloys and electrolytes between their work and ours. It is widely acknowledged that the critical overpotential of dealloying is determined by the competition between the dissolution of the less noble element (roughening effect) and the surface diffusion of the more noble element (smoothening effect). In their work, the less noble element Ag is oxidized to be dissolved directly. The reduced critical overpotential in 0.1 M I− is attributed to a remarkably large exchange current density that outweighs the enhanced surface diffusivity of gold adatoms.16 However, the less noble element of the precursor alloy in our work is Al, which will be passivated rather than be actively dissolved at potentials above the Al3+–Al equilibrium potential in neutral solutions, unless the passivation film is broken by pitting. Therefore, it is reasonably deduced that the minimum potential for dealloying to occur is the critical potential for pitting, namely the potentials Eocp and Ecor are dominated by the pitting abilities of the halide ions in our work. As such, it is well known that at a concentration of 1 M fluoride ions lead to strong passivation of Al, while the other three halide ions contribute to the pitting of the passivation film.17,18 Furthermore, the pitting ability decreases as Cl− > Br− > I−.19,20 However, Pyun and Lee21 have suggested that attack by the halide ions occurs on the bare metal surface simultaneously with the formation of anodic oxide film. Also, it is argued by them that the halide ions have the following adsorption tendencies on oxide-covered Al: F− > Cl− > I− > Br−. Such a sequence makes it understandable that the Eocp value in NaBr lies slightly above that in NaI.
The Eocpvs. time curves for the Al2Au alloy in the NaX (X = Cl, Br, I and F) aqueous solution are illustrated in Fig. 1. Within the duration of 500 s, a steady state of the Eocp is achieved in halide solutions other than the NaF solution. Both continuous fluctuation and abrupt leaps are observed in the whole range of the curve obtained in NaCl at 340 K. At the same temperature, however, fewer fluctuations or leaps are observed in the NaBr case, and even fewer can be found in NaI. On the contrary, at 290 and 270 K, a steady state is achieved first (within 50 s) in the NaCl solution and last (after 250 s) in the NaI solution. As for the case in the NaF solution, the Eocp values keep increasing in the first 500 s, and rise up from −0.7 to −0.08 V (SCE) within an interval of 1000 s, indicating a spontaneous passivation rather than corrosion or dissolution (Fig. 1d). The polarization curves depicting the passivation of Al2Au in 1 M NaF aqueous solution and the corrosion of the alloy in the other three solutions are shown in detail in Fig. 2 a–d. Strikingly in Fig. 2d, the Al2Au alloy is still passivated at potentials where elemental gold is severely oxidized in the NaF solution. Consequently, the alloy turned black after polarization instead of being dealloyed.
As described above, the abilities of pitting and adsorbing vary with halide ions. Iodine tends to lead to general corrosion and requires a relatively high critical overpotential. Our tentative experiment showed that the dealloying courses in the NaI solution were often interrupted by passivation when the applied overpotenials (relative to the open-circuit potential of Al2Au in the same electrolyte) were below 400 mV. In contrast, the dealloying went on smoothly in the NaCl and NaBr solutions, even when the overpotentials were below 200 mV. On the other hand, to make it comparable among results of dealloying in the NaCl, NaBr, and NaI solutions in this work, we set the overpotential for dealloying to be the same in different solutions at the same temperature. The overpotential here is defined as the margin in the applied potential over the open-circuit potential. The applied potentials, overpotentials and durations adopted for the dealloying in this work are listed in Table 2.
| Halide ions | Items | T/K | |||
|---|---|---|---|---|---|
| 268 | 270 | 290 | 340 | ||
| Cl− | Dealloying potential (V, SCE) | 0.09 | 0.19 | 0.10 | 0.07 |
| Overpotential (mV) | 400 | 490 | 400 | 400 | |
| Time (s) | 3600 | 3600 | 2300 | 2200 | |
| Br− | Dealloying potential (V, SCE) | 0.17 | 0.18 | 0.24 | 0.20 |
| Overpotential (mV) | 400 | 420 | 480 | 470 | |
| Time (s) | 3600 | 2700 | 900 | 920 | |
| I− | Potential (V, SCE) | 0.10 | 0.15 | 0.18 | 0.01 |
| Overpotential (mV) | 400 | 400 | 400 | 400 | |
| Time (s) | 3600 | 3000 | 2000 | 2600 | |
3.2 Microscopic morphological characteristics and evolution of NPG
Fig. 3–5 show the surface and section view of the dealloyed Al2Au alloy prepared in 1 M NaCl, NaBr, and NaI aqueous solutions respectively at different temperatures (the dealloying conditions are given in Table 2). It is clear that NPG with a bicontinuous, interpenetrating ligament-channel structure can be fabricated through electrochemically dealloying the Al2Au alloy in the NaX (X = Cl, Br and I) aqueous solutions under applied potentials and temperatures. The diameters of the ligaments in the dealloyed samples were measured manually and averaged over 30 measurements, as listed in Table 3. As expected, the lower the dealloying temperature, the smaller the ligament sizes and the more cracks appear in the surface view of the NPG samples. It is encouraging that not only is the surface rather smooth and flat, but also few cracks are observed in the surface view of the sample prepared in NaI at 340 K, as shown in Fig. 5e. Besides, cracks in the samples fabricated in the electrolyte of NaI at 270 and 290 K (Fig. 5a and c) are remarkably fewer than those in the samples obtained in the NaCl solution (Fig. 3a, c and e). In addition, the cracks in the former are mostly intergranular ones (e.g. see the grain boundaries denoted by arrows in Fig. 5a, c, and e) while in the latter intragranular (transgranular) cracks predominate. As for intergranular cracks, the cracks nucleate and propagate along grain boundaries, reserving a whole grain profile in the fracture surface. These grains are elongated across the thickness of the ribbons, which is believed to be inherited from the quenched precursor alloy.22 Meanwhile, it should be noted that the pattern of the transgranular cracks here is typical of transgranular stress-corrosion cracking (T-SCC).23 Dealloying-induced transgranular cracks are also reported by Senior and Newman,12 who attributed the transgranular fracture mainly to the formation of a monolayer of gold hydroxide that restricted the surface diffusion of gold adatoms. Furthermore, by means of elevated temperature and low dealloying potential, they prepared an NPG sheet (100 μm in thickness) with good mechanical integrity.12 Similarly in this work, elevated temperature and I− ions are believed to enhance the surface diffusivity of the gold adatoms; meanwhile the dissolution rate of aluminum is restricted to some extent by weak passivation in the NaI solution compared to that in the NaCl solution. As for the sample prepared in the NaBr solution, the intermediate abilities of aggressive pitting and diffusion-enhancing contribute to the moderate amount of cracks. In addition to the effects of the dealloying process itself, capillary forces originated from the drying course of the dealloyed sample in a gas atmosphere were suggested to lead to the cracking of porous-silicon.24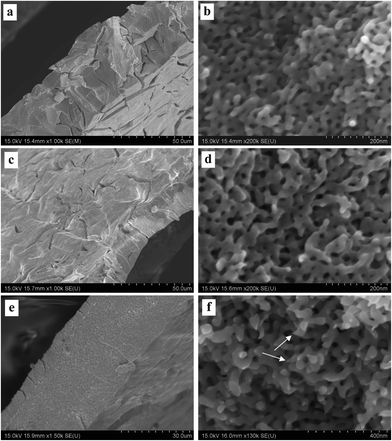 | ||
| Fig. 3 SEM characterization of dealloyed Al2Au samples in 1 M NaCl solution at temperatures of (a) and (b) 270 K, (c) and (d) 290 K, (e) and (f) 340 K. (The dealloying conditions are given in Table 2). | ||
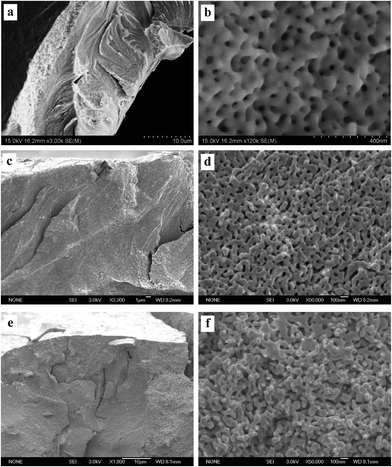 | ||
| Fig. 4 SEM characterization of dealloyed Al2Au samples in 1 M NaBr solution at temperatures of (a) and (b) 270 K, (c) and (d) 290 K, (e) and (f) 340 K. (The dealloying conditions are given in Table 2). | ||
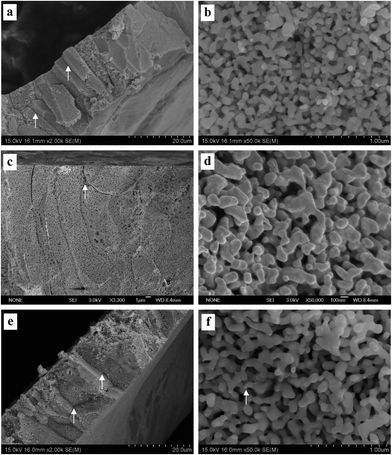 | ||
| Fig. 5 SEM characterization of dealloyed Al2Au samples in 1 M NaI solution at temperatures of (a) and (b) 270 K, (c) and (d) 290 K, (e) and (f) 340 K. (The dealloying conditions are given in Table 2). | ||
| Halide ions | Items | T/K | |||
|---|---|---|---|---|---|
| 268 | 270 | 290 | 340 | ||
| Cl− | Ligament size (d(t), nm) | 15.3 ± 1.2 | 17.5 ± 1.2 | 21.0 ± 1.5 | 35.2 ± 2.5 |
| Surface diffusivity (Ds, m2 s−1) | — | 1.1 × 10⁻¹⁹ | 3.9 × 10⁻¹⁹ | 3.7 × 10⁻¹⁸ | |
| Br− | Ligament size (d(t), nm) | 53.2 ± 2.9 | 32.6 ± 2.0 | 45.9 ± 3.4 | 51.5 ± 2.7 |
| Surface diffusivity (Ds, m2 s−1) | — | 1.76 × 10⁻¹⁸ | 2.2 × 10⁻¹⁷ | 4.05 × 10⁻¹⁷ | |
| I− | Ligament size (d(t), nm) | 72 ± 4.0 | 52.6 ± 3.2 | 73.8 ± 4.1 | 82.5 ± 3.5 |
| Surface diffusivity (Ds, m2 s−1) | — | 1.07 × 10⁻¹⁷ | 6.7 × 10⁻¹⁷ | 9.43 × 10⁻¹⁷ | |
According to the morphologies of the ligaments shown in section views at higher magnifications, the homogeneity of ligament diameters differs among NPG samples obtained under different conditions. For instance, more remarkable variety or dispersivity in ligament sizes is observed in the NPG samples obtained by dealloying in the NaI solution (Fig. 5b, d, and f) than in the other two samples prepared in the NaCl or NaBr solutions (Fig. 3 and 4); and higher temperature seems to homogenize the ligaments, as evidenced in Fig. 5b and f. Given the fact that higher diffusivity of gold adatoms is advocated in the NaI solution (see Table 3, discussed below), the higher dispersivity in ligament sizes of samples from the NaI solution may imply a more or less different dealloying course, e.g. more nucleation and less diffusion to already-formed nuclei, from the dealloying in the NaCl solution. Another example is seen in the comparison between the ligament shapes in the samples prepared in the NaCl solution at 270 and 340 K, (Fig. 3b and f). Specifically, ligaments with cone-shaped ends are present in the latter, as denoted by arrows in Fig. 3f. In contrast, the end of the ligaments in the former are generally round, as shown in Fig. 3b. The cone-shaped end was reported to be indicative of pronounced necking before the failure of each ligament and was held as a convincing sign of plastic breakage at the microscopic scale.25 It seems to us that the aforementioned cone-shaped end is indicative of good ductility of the ligaments, as well as good preservation of the less stable shape at room temperature in atmospheric conditions. On the one hand, good ductility is believed to be related to deformation by slipping of dislocations or by plastic flow when the amount or activity of the dislocations is suppressed by the nano-scale of the ligaments or grains.25 At elevated temperatures, fast surface diffusion of gold adatoms may cause more dislocations, twin crystals or stacking faults in the NPG lattices. On the other hand, the necking phenomenon on the ligament scale can be erased by Ostwald ripening, which will necessarily correlate the observed necking with the surface diffusion of gold atoms. It should be noted that the homogenization of ligament size distribution and the elimination of necking can be achieved simultaneously by Ostwald ripening. However, longer-range surface migration is required for the gold atoms to achieve uniformity in ligament sizes than what is needed for eliminating the neck of a ligament. In addition, different diffusion routes may require different driving forces. There is residual internal stress at low temperatures large enough to serve as the driving force for surface diffusion. In contrast, at elevated temperatures, where the internal stress from dealloying is released over time, the inherent driving forces for diffusion are possibly insufficient, at least at some local sites, hence necking of some ligaments is observed with FESEM. Based on the above considerations, the most remarkable necking would be expected in the samples prepared in the NaI solution at 340 K. But this is clearly not the case. Only a few ligaments end with necking (one is denoted by an arrow in Fig. 5f); and we believe that the reason comes to the intergranular crack mode. In fact, the most pronounced necking is observed in the sample prepared in NaCl at 340 K (not at 270 or 290 K), where the fracture surface (the section view) is flat.
To test the cracking and morphological stability of the resultant NPG samples prepared at low temperature, the Al2Au alloy was dealloyed at 268 K in the 1 M NaCl, 1 M NaBr, and 1 M NaI aqueous solutions respectively. The dealloying overpotentials were all 400 mV and the dealloying durations were all 3600 s, as listed in Table 2. After being rinsed with water and then with anhydrous alcohol, the dealloyed samples were kept at ambient conditions for 48 days before FESEM characterization. Morphologies at both low and high magnifications are shown in Fig. 6, and the average diameters of ligaments are included in Table 3. As expected, the amount of cracks decreases as in Cl− > Br− > I−. Besides, cleavage or transgranular patterns characterize the cracks in samples prepared in the NaCl solution (Fig. 6a), while cracks in samples obtained in the NaI solutions are of an intergranular style (Fig. 6e). Both intragranular cracks and intergranular ones are observed in samples from the NaBr solution (Fig. 6c). At higher magnifications, interestingly, ligament sizes across the figures (Fig. 6b, d, and f)are homogeneous in all three samples as compared with those shown in Fig. 3b, 4b and 5b, implying coarsening of the ligaments to different extents in the three samples, which were kept for 48 days at room temperature. It is also evidenced by the comparison of average ligament diameters between samples prepared at 268 K and those at 270 K, as listed in column 1 and column 2 in Table 3. Again, it should be noted that the driving force for homogenizing is probably different from that for cracking. The former is suggested to be the minimization of total surface and interface while the latter is suggested to be the volume shrinkage or lattice mismatch. However, both driving forces are closely related to the dealloying mechanism and the surface diffusion of the more noble element (gold in this work) along the alloy–electrolyte interface during dealloying. Therefore, the activation enthalpy and entropy for diffusion involved in dealloying, and the corresponding surface diffusivity of gold adatoms in this work, were calculated and will be discussed below.
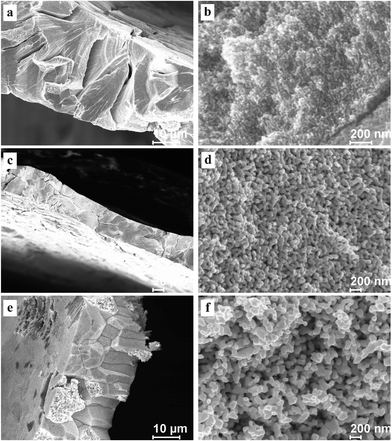 | ||
| Fig. 6 SEM characterization of dealloyed Al2Au samples after dealloying for 1 h at a temperature of 268 K in 1 M (a) and (b) NaCl, (c) and (d) NaBr, (e) and (f) NaI solutions, and room-temperature coarsening for 48 days. (The dealloying conditions are given in Table 2). | ||
3.3 Surface diffusivity of gold adatoms (Auad) and the activation enthalpy of dealloying
It is suggested that formation of the nanoporous structure is a thermal-activation process,26 and there is a built-in length scale, ξperc, which is associated with clusters comprised of interconnected atoms of the less noble species.27 Meanwhile, it is argued by Renner et al.28 that it is not a thermodynamic driving force, but rather the rate of surface diffusion, that dominates the formation of the metallic layer composing the porous structure. Based upon the surface diffusion controlled coarsening mechanism, the Ds values of Au adatoms along the alloy–solution interfaces can be evaluated by the equation29,30 | (1) |
![[thin space (1/6-em)]](https://www.rsc.org/images/entities/char_2009.gif) 16), a is the lattice parameter of Au (4.08 × 10⁻¹⁰ m), and T is the dealloying temperature. According to the ligament diameters d(t), dealloying duration t and dealloying temperature T, given in Table 2 and 3, the surface diffusivities of Auad at different temperatures in all three electrolytes were calculated and are listed in Table 3. Obviously, diffusivity increases with temperature and the most significant increase is seen in the case of the NaCl electrolyte while the smallest increase is seen in NaI. When compared at the same temperature, however, the values of diffusivity increase as in NaCl < NaBr < NaI solution. Consequently, the coarsest ligaments are obtained in the NaI solution. Besides, the diffusivity of Auad at 290 K given here is comparable to that reported by Dursun et al.,16 except that the value corresponding to the NaBr solution is higher by two orders of magnitude than the value in their work. Except for the error caused by the evaluation method itself, such factors as the applied potential and the concentration of Br− ions are probably responsible for the deviation.
16), a is the lattice parameter of Au (4.08 × 10⁻¹⁰ m), and T is the dealloying temperature. According to the ligament diameters d(t), dealloying duration t and dealloying temperature T, given in Table 2 and 3, the surface diffusivities of Auad at different temperatures in all three electrolytes were calculated and are listed in Table 3. Obviously, diffusivity increases with temperature and the most significant increase is seen in the case of the NaCl electrolyte while the smallest increase is seen in NaI. When compared at the same temperature, however, the values of diffusivity increase as in NaCl < NaBr < NaI solution. Consequently, the coarsest ligaments are obtained in the NaI solution. Besides, the diffusivity of Auad at 290 K given here is comparable to that reported by Dursun et al.,16 except that the value corresponding to the NaBr solution is higher by two orders of magnitude than the value in their work. Except for the error caused by the evaluation method itself, such factors as the applied potential and the concentration of Br− ions are probably responsible for the deviation.
Within the framework of surface diffusion as a thermo-activation process, the Arrhenius equation for the surface diffusion process is as follows:31
 | (2) |
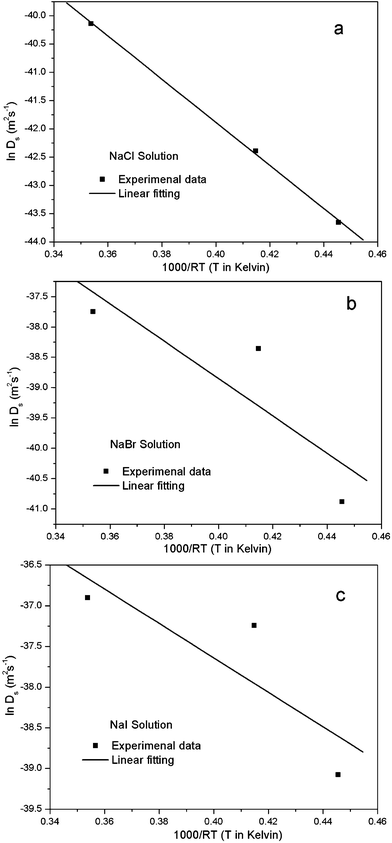 | ||
| Fig. 7 Plot of lnDs vs. 1000/RT for the estimation of the activation enthalpy and entropy for the nanopore formation in the 1 M NaX (X = Cl, Br, I) aqueous solutions. | ||
| NaCl | NaBr | NaI | |
|---|---|---|---|
| ΔH (KJ mol−1) | 38.13 ± 1.07 | 30.78 ± 17.92 | 21.17 ± 13.43 |
| ln Do (m2 s−1) | −26.63 ± 0.43 | −26.54 ± 7.28 | −29.17 ± 5.46 |
| ΔS (J mol−1K−1) | −102.23 | −101.48 | −123.35 |
It has been pointed out by Dona and Gonzalez-Velasco31 that the activation enthalpy will be reduced when the surface gold atoms are involved in interactions with the solvent molecules and ions of the supporting electrolyte, because such interactions lead to relaxation of surface layers and loss in metal character of the surface atoms. The present ΔH value in Table 4 is about 20 kJ mol−1 smaller than that reported by Dona and Gonzalez-Velasco31 for gold in the 0.5 M H2SO4 aqueous solution (55 kJ mol−1) in the potential range for double-layer formation, and is over 100 kJ mol−1 below that corresponding to self-diffusion in the Au-vacuum system (167.4 kJ mol−1). Besides, the ΔH value decreases following the sequence NaCl > NaBr > NaI, possibly suggesting that the energy barrier for the surface diffusion of gold adatoms in the NaI solution during dealloying is the smallest. On the other hand, the interaction of the adatoms with solvent molecules and active ions also has an effect on the activation entropy ΔS. The values of activation entropy ΔS were calculated according to eqn (3):31
 | (3) |
The value of ΔS is positive (53.4 J mol−1 K−1) for a gold-vacuum system, but is negative (c.a. −20 J mol−1 K−1) for the gold-electrolyte (0.5 M H2SO4 solution) system in the potential range for double-layer formation.31 However, in the potential range for gold oxidation, the value of ΔS is as negative as −184.9 J mol−1 K−1. The negative activation entropy is interpreted as being caused by the orientation of solvent molecules as a result of the accumulated charges on the adatoms, and further by the interweavement of the molecules into a quasi-lattice by hydrogen bonds.31
Another effect of special interest is the applied potential. Above the zero-charge potential (Ez), positive charges will be accumulated on the surface during dealloying and attract anions in the electrolyte by Coulomb force. Meanwhile, the Coulomb repulsion among the surface gold atoms also helps to relax the surface layers.31 Given the remarkable effect of potentials on dealloying behaviors and on the validity of the energy estimation, we are stimulated to find the relationship between activation enthalpy and dealloying potential as well as dealloying overpotential, in the context of the dealloying of Al-based alloys in electrolytes with halide ions in future work.
4. Conclusions
In summary, a systematic investigation has been reported on the electrochemical dealloying of the single-phase Al2Au alloy in 1 M sodium halide aqueous solutions at 270, 290 and 340 K. The Al2Au alloy is passivated in NaF solution but can be dealloyed in NaCl, NaBr, and NaI solutions, leading to typical nanoporous gold with a three-dimensional, bicontinuous, interpenetrating ligament-channel structure. The open-circuit potential and the corrosion potential are susceptible to the halide species, and the corrosion potential generally decreases with increasing temperature. In addition, the amount and pattern of cracks in the obtained nanoporous gold as well as the sizes and homogeneity of ligaments are remarkably affected by the temperature and the halide ions. The best mechanical integrity is seen in the nanoporous gold sample prepared in NaI solution at 340 K. Besides, based on the surface diffusion controlled coarsening mechanism, the surface diffusivities of gold adatoms along the alloy–electrolyte interface have been evaluated in this work. It has been found that the surface diffusivities of gold adatoms increase with the increase of temperature in a given halide solution, and also increase following the sequence of Cl− < Br− < I− at a given temperature. In addition, for a given halide solution, the surface diffusivity vs. temperature relationship follows an Arrhenius equation, and thereafter the activation enthalpy and activation entropy can be calculated. For the electrochemical dealloying of the Al2Au alloy in the halide (Cl−, Br− and I−) solutions, the activation enthalpy (ΔH) and entropy (ΔS) have been estimated respectively to be on the scale of 30 kJ mol−1 and −100 J mol−1 K−1. Besides, the activation enthalpy decreases following the sequence Cl− > Br− > I−.Acknowledgements
The authors gratefully acknowledge financial support by the National Natural Science Foundation of China (50971079), Program for New Century Excellent Talents in University, Open Project of Shanghai Key Laboratory of Modern Metallurgy and Materials Processing (SELF-2011-02), and Independent Innovation Foundation of Shandong University (2010JQ015). Z. H. Zhang acknowledges the support from the Alexander von Humboldt Foundation (Germany). The experimental assistance from Ruhr University at Bochum (Germany) is acknowledged. The authors give thanks to Qian Zhang for experimental assistance and useful discussion.References
- Y. Ding, M. W. Chen and J. Erlebacher, J. Am. Chem. Soc., 2004, 126, 6876 CAS.
- T. You, O. Niwa, M. Tomita and S. Hirono, Anal. Chem., 2003, 75, 2080 CAS.
- S. H. Joo, S. J. Choi, K. J. Kwa and Z. Liu, Nature, 2001, 412, 169 CAS.
- M. D. Rintoul, S. Torquato, C. Yeong, D. T. Keane, S. Erramilli, Y. N. Jun, D. M. Dabbs and I. A. Aksay, Phys. Rev. E, 1996, 54, 2663 CAS.
- C. A. Volkert, E. T. Lilleodden, D. Kramer and J. Weissmuller, Appl. Phys. Lett., 2006, 89, 061920 Search PubMed.
- J. Biener, A. M. Hodge, J. R. Hayes, C. A. Volkert, L. A. Zepeda-Ruiz, A. V. Hamza and F. F. Abraham, Nano Lett., 2006, 6, 2379 CAS.
- R. Li and K. Sieradzki, Phys. Rev. Lett., 1992, 68, 1168 CAS.
- H. J. Jin, D. Kramer, Y. Ivanisenko and J. Weissmüller, Adv. Eng. Mater., 2007, 9, 849 Search PubMed.
- E. Seker, J. T. Gaskins, H. Bart-Smith, J. Zhu, M. L. Reed, G. Zangari, R. Kelly and M. R. Begley, Acta Mater., 2008, 56, 324 CAS.
- E. Seker, J. T. Gaskins, H. Bart-Smith, J. Zhu, M. L. Reed, G. Zangari, R. Kelly and M. R. Begley, Acta Mater., 2007, 55, 4593 CAS.
- Y. Sun and T. J. Balk, Scr. Mater., 2008, 58, 727 CAS.
- N. A. Senior and R. C. Newman, Nanotechnology, 2006, 17, 2311 CAS.
- H. J. Jin, L. Kurmanaeva, J. Schmauch, H. Rosner, Y. Ivanisenko and J. Weissmüller, Acta Mater., 2009, 57, 2665 CAS.
- Q. Zhang, X. G. Wang, Z. Qi, Y. Wang and Z. H. Zhang, Electrochim. Acta, 2009, 54, 6190 CAS.
- Q. Zhang and Z. H. Zhang, Phys. Chem. Chem. Phys., 2010, 12, 1453 CAS.
- A. Dursun, D. V. Pugh and S. G. Corcoran, J. Electrochem. Soc., 2003, 150, B355 CAS.
- C. B. Breslin, L. P. Friery and W. M. Carroll, Corros. Sci., 1994, 36, 85 CAS.
- B. Zhang, Y. Li and F. H. Wang, Corros. Sci., 2009, 51, 268 CAS.
- M. Baumgärtner and H. Kaesche, Mater. Corros., 1991, 42, 158 Search PubMed.
- I. Milosev, Corros. Sci., 2007, 49, 637 CAS.
- S.-I. Pyun and E.-J. Lee, Electrochim. Acta, 1995, 40, 1963 CAS.
- Z. H. Zhang, Y. Wang, Z. Qi, J. Frenzel and X. F. Bian, J.Phys.Chem.C, 2009, 113, 12629 CAS.
- T. B. Cassagne, W. F. Flanagan and B. D. Lichter, Metall. Transac. A, 1986, 17A, 703 CAS.
- O. Belmont, C. Faivre, D. Bellet and Y. Brechet, Thin Solid Films, 1996, 276, 219 CAS.
- J. Biener, A. M. Hodge and A. V. Hamza, Appl. Phys. Lett., 2005, 87, 121908 Search PubMed.
- J. Rugolo, J. Erlebacher and K. Sieradzki, Nature Mater., 2006, 5, 946 CAS.
- K. Sieradzki, N. Dimitrov, D. Movrin, C. McCall, N. Vasiljevic and J. Erlebacher, J. Electrochem. Soc., 2002, 149, B370 CAS.
- F. U. Renner, A. Stierle, H. Dosch, D. M. Kolb and J. Zegenhagen, Electrochem. Commun., 2007, 9, 1639 CAS.
- G. Andreasen, M. Nazzarro, J. Ramirez, R. C. Salvarezza and A. J. Arvia, J. Electrochem. Soc., 1996, 143, 466 CAS.
- L. H. Qian and M. W. Chen, Appl. Phys. Lett., 2007, 91, 083105 Search PubMed.
- J. M. Dona and J. Gonzalez-Velasco, J. Phys. Chem., 1993, 97, 4714 CAS.
| This journal is © The Royal Society of Chemistry 2012 |
