Hydrogel porosity controlling DNA-directed immobilization of gold nanoparticles revealed by DNA melting and scanning helium ion microscopy
Ajfan
Baeissa
,
Nafiseh
Moghimi
and
Juewen
Liu
*
Department of Chemistry, Waterloo Institute for Nanotechnology, University of Waterloo, 200 University Avenue West, Waterloo, Ontario, Canada N2L 3G1. E-mail: liujw@uwaterloo.ca
First published on 15th February 2012
Abstract
Immobilization of nanomaterials is important for many applications, including sensor development, biomaterials design and catalysis. DNA-directed immobilization has been widely used because of its high specificity and programmability. While most previous work has been carried out using inorganic surfaces such as gold, silica, and carbon, we recently found that hydrogels are also useful for immobilization. For non-porous inorganic surfaces, DNA-directed immobilization is governed mainly by probe density, while porosity might play a major role for hydrogels. Herein, we test the effect of gel porosity on DNA-directed immobilization of gold nanoparticles (AuNPs). Porosity was varied by changing the hydrogel percentage and crosslinker density. The number of immobilized AuNPs and its binding strength were characterized by DNA melting experiments. Using scanning helium ion microscopy, the AuNP density on hydrogel was studied. The number of AuNP binding sites decreased with decreasing gel porosity or increasing AuNP size, implying that the associated AuNPs were inside the gel pores. Polyvalent binding is a key feature for nanoparticle immobilization. For a non-porous surface, polyvalent binding occurs only at one small spot. We found that hydrogels take advantage of its porous nature to establish 3-dimensional polyvalent binding. Even with a very low surface DNA density, effective AuNP immobilization can still be achieved.
1. Introduction
Selective immobilization of nanomaterials is crucial for many important applications including biosensor development,1–3 biomaterials design,4 nanotechnology,5 and catalysis.6 Conventional methods for immobilization include physical adsorption, entrapment, encapsulation, and covalent linkages. With the development of bioconjugate chemistry, immobilization can also take place via highly specific biomolecular interactions. For example, DNA-directed immobilization has been commonly used, where both the nanoparticle and the substrate surface are functionalized with DNA.7,8 For this purpose, gold nanoparticles (AuNPs) are very popular because thiol-modified DNA can be easily attached and highly mono-dispersed AuNPs from 5 nm to over 50 nm are commercially available. In addition, AuNPs are highly stable and they possess an extremely high extinction coefficient, allowing visual observation even at sub-nanomolar concentration.9–12Many different surfaces have been employed for nanoparticle immobilization, such as glass,13 gold,14 carbon,15–17 various oxides,18,19 lipids,20 and even paper.21 Most of these surfaces have a low porosity with limited surface area. We recently employed DNA-functionalized hydrogels for AuNP immobilization.22,23 Hydrogels are crosslinked hydrophilic polymer networks.24 The majority of the gel volume is water, making hydrogels highly porous with a large surface area. In addition, hydrogels are optically transparent, allowing effective optical detection with minimal background. Hydrogels can also be made into various gel percentages and chemical compositions, which are not easily achievable with many other commonly used materials. In the past 15 years, a number of DNA-functionalized hydrogels have been reported for making biosensors,22,25–28 controlled release systems,29–31 biocompatible matrices,32 and stimuli responsive materials.28,33–36
There is a major difference between DNA-directed immobilization of small molecules and nanoparticles. In the former case, there is usually only a single DNA linkage; while polyvalent binding is a key feature for nanoparticle immobilization.37–39 Multivalency becomes particularly interesting on a porous hydrogel substrate, where upon tuning the gel property, the gel pore size and the number of linkages can be controlled. By varying nanoparticle size, hydrogel porosity can in turn be probed. Understanding gel porosity and in particular its effect on nanoparticle binding is important not only for fundamental research, but also for applications such as tissue engineering, electrophoresis, controlled release, and smart materials design.24 Gel porosity is often measured using microscopy (TEM, SEM, AFM),40–42 spectroscopy such as NMR,43 various scattering techniques,44,45 or adsorption.42 These techniques usually require sophisticated instruments and sample preparation. We demonstrate herein that DNA-directed immobilization of AuNPs can provide complementary information on the hydrated state of a gel by simply studying DNA thermal denaturation and the AuNP adsorption capacity. While DNA-directed binding between AuNPs and glass surfaces has been previously studied,5,46–48 this is the first systematic work on a soft substrate.
2. Materials and methods
Chemicals
All the DNA samples were purchased from Integrated DNA Technologies (Coralville, IA) and purified by standard desalting. Acrylamide/bisacrylamide 29![[thin space (1/6-em)]](https://www.rsc.org/images/entities/char_2009.gif) :1 and 19:1 40% gel stock solution, ammonium persulfate (APS), and N,N,N′,N′-tetramethylethylenediamine (TEMED) were purchased from VWR (Mississauga, Ontario, Canada). HAuCl4, allylamine, 2-acrylamido-2-methyl-1-propanesulfonic acid (AMPS), and acrylamide were obtained from Sigma-Aldrich. Sodium chloride, sodium hydroxide, sodium citrate, and 4-(2-hydroxyethyl)-1-piperazineethanesulfonic acid (HEPES) were purchased from Mandel Scientific (Guelph, Ontario, Canada).
:1 and 19:1 40% gel stock solution, ammonium persulfate (APS), and N,N,N′,N′-tetramethylethylenediamine (TEMED) were purchased from VWR (Mississauga, Ontario, Canada). HAuCl4, allylamine, 2-acrylamido-2-methyl-1-propanesulfonic acid (AMPS), and acrylamide were obtained from Sigma-Aldrich. Sodium chloride, sodium hydroxide, sodium citrate, and 4-(2-hydroxyethyl)-1-piperazineethanesulfonic acid (HEPES) were purchased from Mandel Scientific (Guelph, Ontario, Canada).
Synthesis of DNA-functionalized hydrogels
First, the monomer stock solutions were prepared. AMPS and allylamine were made to be 40% and adjusted to pH 8.0 using NaOH or HNO3. The initiator solution was freshly prepared before use by dissolving 50 mg APS and 25 μL TEMED in 500 μL H2O. The final formulation usually contained 100 mM NaCl, 50 mM HEPES, pH 7.6, 4% or other percentages of the gel stock, 10 μM or other concentrations of the acrydite DNA, and the initiator solution was added last at 5% of the total volume. The solutions were quickly transferred into a 96 well plate (70 μL in each well). After 1 h at room temperature, the gels were harvested and soaked in water overnight to remove non-gel components.AuNP preparation and functionalization
13 nm AuNPs were prepared by the citrate reduction method described in literature,49 and 30 and 50 nm ones were purchased from Ted Pella Inc. The attachment of thiol-modified DNA to these AuNPs followed the literature reported procedure and will not be repeated here.50,51Linking AuNPs to hydrogel
The free thiol-DNAs were removed after centrifugation to obtain purified AuNPs before the attachment experiment. Each gel was placed in 1 mL buffer (300 mM NaCl, 20 mM HEPES, pH 7.6) containing 1 nM 13 nm DNA-functionalized AuNPs and 20 nM linker DNA. To attach 30 or 50 nm AuNPs, 500 μL of AuNPs (extinction = 1.0 at the plasmon peaks) were used for each gel and the linker DNA concentration was still 20 nM. The buffer contained only 100 mM instead of 300 mM NaCl. After overnight reaction, the original buffer containing free AuNPs was removed and cold buffer (50 mM NaCl, 20 mM HEPES) was added. After overnight soaking, the buffer was replaced one more time using the same 50 mM NaCl buffer. This was to ensure that the gels had the exact same ionic strength during the melting studies.Melting curves
To measure melting curves, a gel with immobilized AuNPs was soaked in a quartz micro-cuvette containing 400 μL of buffer. The gel size was large enough to sit on top of the optical window for detection while still small enough to move freely in the buffer. The cuvette was capped and sealed by parafilm to prevent evaporation. Extinction at 520 nm was then monitored as a function of temperature using an Agilent 8453 spectrophotometer. The temperature was increased at a rate of 1 °C min−1. The sample was equilibrated for 2 min at each temperature before taking the measurement. All the melting curves were normalized to have the initial extinction value of 0 and the final one to be 1.0. All the experiments were run in triplicates and the standard deviations of the Tm values was plotted as the error bars. The temperature at which the extinction value reached the mid-point was used as the Tm.SEM
Hydrogels with AuNPs were frozen at −20 °C for 30 min. A cold razor blade was used to cut a thin slice of the surface AuNP layer and the gel slice was transferred to a conductive silicon wafer. After drying at room temperature overnight, the gels were imaged by scanning electron microscopy (SEM).Scanning helium ion microscopy (SHIM)
The morphology of AuNPs in hydrogel was characterized by SHIM in a Zeiss ORION-Plus microscope operated at 25 kV, 5–7 pA, powered by an ALIS gas field ion source. Owing to the very high source brightness and shorter wavelength of the helium ions, SHIM provides better resolution rather than SEM and better contrast for hydrogel samples.3. Results and discussion
Effect of DNA concentration in hydrogel
The design of our material is shown in Fig. 1A. A 5′-acrydite-modified DNA was co-polymerized into a 70 μL polyacrylamide monolithic hydrogel. This gel was mixed with AuNPs functionalized with a 3′-thiol-modified DNA in the presence of linker DNA (in blue). The resulting gel showed a red color due to AuNP immobilization. To probe the binding between AuNPs and gel, we chose to use DNA thermal denaturation, where the amount of desorbed AuNP was measured as a function of temperature. Such experiments could provide rich information about this polyvalent binding system.46 Higher melting temperatures (Tm) and sharper melting transitions are expected for samples with more DNA linkages between the AuNPs and gel.52 The DNA sequences used in this work are shown in Fig. 1B.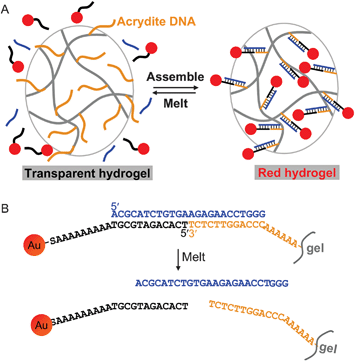 | ||
| Fig. 1 (A) Schematic presentation of DNA-directed assembly of AuNPs onto a hydrogel surface. The assembly is a reversible process and can be controlled by temperature. (B) DNA sequences and linkages used in this work. | ||
We first studied the effect of the acrydite-modified DNA concentration since it directly affected the polyvalent binding of AuNPs. Four kinds of gels were prepared with the acrydite-DNA concentration being 1, 2, 5 and 10 μM, respectively. As shown in Fig. 2A, the amount of associated AuNPs increased with increasing DNA concentration.22 To obtain melting curves, the gels were loaded into a quartz micro-cuvette and immersed in 400 μL of buffer (50 mM NaCl, 20 mM HEPES, pH 7.6). The buffer extinction at the 520 nm surface plasmon peak was monitored as a function of temperature.22 As shown in Fig. 2C, AuNPs gradually desorbed due to DNA melting. The melting transition occurred at a higher temperature for samples with higher DNA density, suggesting the presence of more DNA linkages with each AuNPs. The change of Tm was about ∼4 °C for the 10-fold change of the DNA density (Fig. 2D). The amount of attached AuNPs was quantified by measuring the final extinction after all AuNPs were thermally desorbed. As shown in Fig. 2B, increasing the DNA by 10-fold only resulted in a ∼1.3-fold increase of the immobilized AuNPs.
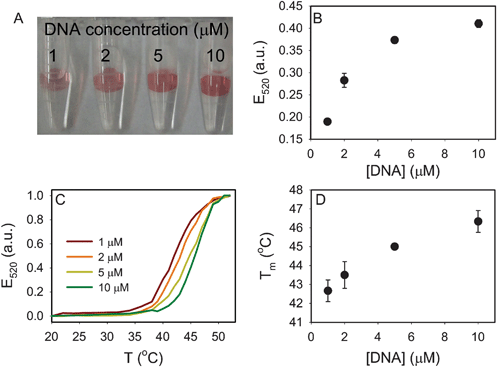 | ||
| Fig. 2 Effect of acrydite-modified DNA concentration in hydrogel (4% gels). (A) A photograph of the four hydrogels with DNA-linked AuNPs. A higher DNA concentration resulted in more AuNP attachment. (B) Quantification of AuNP on the gel after complete thermal dissociation of AuNPs. (C) The normalized melting curves of the four samples. (D) Tm as a function of DNA concentration. | ||
The melting process occurs in a temperature range of ∼10 °C, which is similar to that reported for AuNPs melting from a glass surface.46 The melting of free DNAs usually occurs over a range of >20 °C, while the melting of AuNP aggregates occurs within 6 °C.46,53 Sharp melting transitions involving AuNPs are generally attributed to the multivalent DNA linkages to other AuNPs or surfaces. In this regard, our gel surface behaved more similarly to a glass surface.
The highest DNA concentration we tested was 10 μM with a coupling efficiency of ∼60%.22 Assuming an even distribution of DNA in the gel matrix, we estimated a DNA-to-DNA distance of ∼22 nm for a 4% gel. With 1 μM DNA, this distance was estimated to be greater than 47 nm. Therefore, to form multiple linkages with 13 nm AuNPs, binding to the gel must have occurred in 3D. In other words, these AuNPs were likely to sit in the nanoscale gel pores and the nearby polymer chains may adapt their conformation to allow DNA hybridization. For a non-porous glass surface, however, DNA linkages can only take place at the single contacting region. Therefore, this simple calculation suggests that porosity is extremely important in the hydrogel matrix. Subsequent experiments were designed to probe the effect of changing the gel pore size.
Effect of hydrogel percentage
To study the effect of gel porosity, the hydrogel percentage was varied. Higher percentage gels are known to produce smaller pores. Four types of gels containing 4–16% of the 29:1 acrylamide/bisacrylamide solution were prepared using 10 μM of the acrydite-DNA. We found that the number of attached AuNPs decreased significantly with increasing gel percentage (Fig. 3A) and the decrease roughly followed a linear trend (Fig. 3B). Since all the gels had the same bulk DNA concentration, we consider the main effect to be the gel pore size. Higher percentage gels exhibited lower porosity, making it more difficult to establish polyvalent binding with AuNPs. A reduced Tm was observed with an increasing gel percentage (Fig. 3C, D), also suggesting the decreased number of DNA linkages.
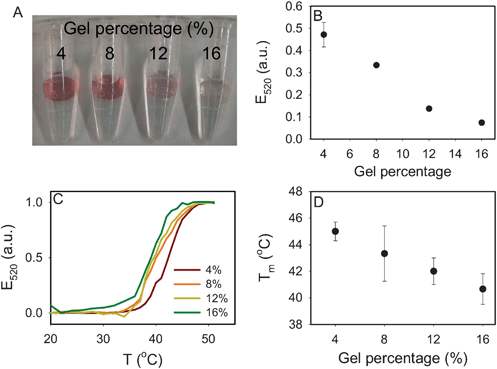 | ||
| Fig. 3 Effect of gel percentage (acrydite DNA concentration = 10 μM). (A) A photograph of the four hydrogels with DNA-linked AuNPs. A higher gel percentage resulted in less AuNP attachment. (B) Quantification of AuNP on the gel after complete thermal dissociation of AuNPs. (C) The normalized melting curves of the four samples. (D) Tm as a function of gel percentage. | ||
So far, we have identified two types of sub-optimal conditions for AuNP binding: 4% gel with 1 μM DNA and 16% gel with 10 μM DNA. The former possessed a large number of pores with the right pore size but only a fraction of those sites had the number of DNA required for AuNP attachment. In the latter case, even though the overall DNA concentration was high, the majority of the DNAs were not accessible for AuNP binding.
Effect of crosslinker density
By increasing the gel percentage, we were able to reduce the gel pore size. It was, however, difficult to increase the pore size by further reducing the gel percentage. Below 4%, the gel became very soft and difficult to handle. Another way to modulate the gel porosity was to change the crosslinker concentration. In the above experiments, a 29:1 ratio of acrylamide:bisacrylamide was used. To increase the gel pore size, we prepared 19:1, 38:1, 76:1, and 114:1 gels (all at 6%). We observed that the gel size was larger with lower crosslinker percentages (Fig. 4A, E), suggesting increased pore size. The increased gel size was also quantified by weighing (Fig. 4B). As shown in Fig. 4F and 4G, the Tm barely changed (within 1 °C) for all the samples, suggesting that the number of DNA linkages was similar for all the gels. Fig. 4C shows that the amount of associated AuNPs increased with reduced crosslinker concentration. This also indicated that the number of AuNP binding sites increased with a lower crosslinker density or larger pore size.
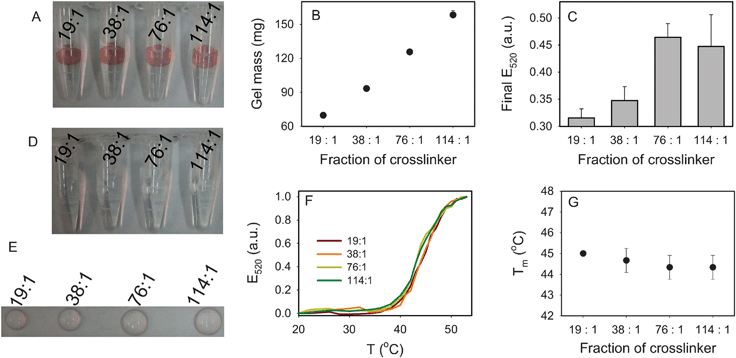 | ||
| Fig. 4 Effect of acrylamide:bisacrylamide ratio (gel percentage = 6%, acrydite-DNA concentration = 10 μM). (A) A photograph of the four hydrogels with DNA-linked AuNPs. The change in gel size can be observed. (B) The gel mass as a function of crosslinker ratio. (C) Quantification of AuNP on the gel in (A) after complete thermal dissociation of AuNPs. Although the 19:1 sample appears to have a higher AuNP density, it has a smaller surface area, leading to a lower AuNP adsorption capacity. (D) Without linker DNA, no AuNP was associated with the gels. (E) A photograph of the gels after the melting experiment; most of the AuNPs were dissociated. The gel size difference can be observed. (F) The normalized melting curves of the four samples. (G) Tm as a function of crosslinker ratio. | ||
We also studied the non-specific association of AuNPs in the absence of linker DNA. As shown in Fig. 4D, no AuNPs were adsorbed by the gels even for the 114:1 case, which had the largest pore size. This experiment confirmed that all the AuNPs in the previous experiments were adsorbed via the DNA linker and no non-specific adsorption occurred. After the melting experiment, as shown in Fig. 4E, the gels did not show much red color, suggesting that the AuNPs were almost completely dissociated and little entrapment of AuNPs occurred.
Effect of AuNP size
To further probe the gel pore size, we next tested three AuNP sizes of 13, 30 and 50 nm. The extinction coefficient of AuNPs is a strong function of particle size and it increases by ∼50-fold from 13 to 50 nm. All the gel samples showed a comparable optical density as shown in Fig. 5A. Therefore, the surface density of the larger AuNPs must be much lower than that of the 13 nm one. The larger AuNPs also showed a slightly higher melting temperature (Fig. 5B, C), suggesting that they had more DNA linkages with the gel.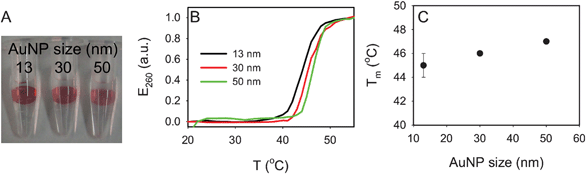 | ||
| Fig. 5 Effect of AuNP size (4% gels). (A) A photograph of the three hydrogels with DNA-linked AuNPs. (B) The normalized melting curves of the four samples. (C) Tm as a function of AuNP size. | ||
To further understand the distribution of AuNPs on the gel surface, we conducted scanning microscopy studies on the 13 and 50 nm AuNP samples. A thin slice of gel was dried on a conductive silicon wafer and imaged by SEM. The surface area of the gel slice remained after drying and thus the observed AuNP density should reflect the density in the wet gel. The surface morphology of a 4% gel is shown in Fig. 6A. The white dots in Fig. 6B were the 13 nm AuNPs; they occupied almost the whole surface area. Due to the non-conductive nature of dried hydrogel, a severe charging effect occurred in the SEM experiment, leading to blurred images. To overcome this problem, we next imaged the samples using scanning helium ion microscopy (SHIM), which also had a higher resolution. A high density of 13 nm AuNPs can then be clearly observed (Fig. 6C). These AuNPs distributed quite homogeneously on the gel surface. The 50 nm AuNPs were well-separated from each other with a much lower surface density (Fig. 6D, E), consistent with the optical density observation. There is no evidence of an AuNP density gradient across a scale of several micrometres. The size-dependent experiment further indicated the effect of gel pore size: a large AuNP needs a large pore size but a small AuNP can stay in both small and large pores.
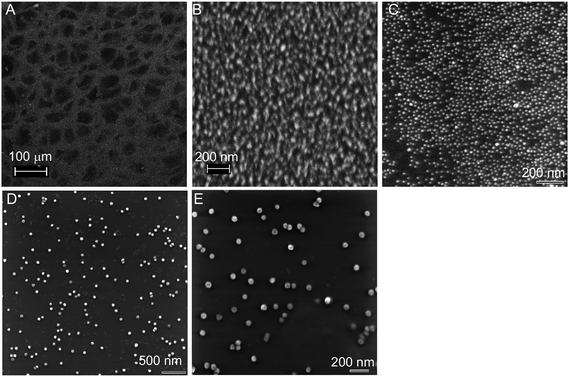 | ||
| Fig. 6 SEM and SHIM micrographs of dried hydrogel samples. (A) A low magnification SEM image of the dried gel surface. Gel surfaces containing 13 nm AuNPs imaged using SEM (B) and SHIM (C). (D,E) Gel surfaces containing 50 nm AuNPs imaged using SHIM. All the gels were 4% with 10 μM acrydite-DNA. | ||
The effect of changing the hydrogel percentage or crosslinker concentration on the gel pore size has been well documented. For example, Ugaz and co-workers concluded based on TEM studies that the gel pore size was smaller with a narrower distribution at higher gel percentage or crosslinker concentration.40 With a 6% polyacrylamide gel, the average pore size was 15 nm and the largest pores can reach 30 nm. For a 12% gel, however, the average pore size was only 7 nm and the largest pores were about 15 nm. This result was consistent with what we obtained using AuNP probes: our 13 nm AuNPs were effectively attached to the 4–8% gels, but not to the 16% one. The surface density of 50 nm AuNPs was much lower, since there were very few large pores.
Binding model
It is known that many non-porous surfaces such as gold and silica can be used for the DNA-directed binding of nanoparticles. In those cases, a high DNA concentration on the surface was required (e.g. multiple linkages can occur within the tiny contacting region, Fig. 7A, DNA linkages represented by the blue color).46 In our hydrogel, the surface DNA density was very low. As a result, porosity became extremely important to utilize not only the surface DNA but also the interior ones to form 3D binding pockets. We observed that the AuNP binding capacity dropped significantly with reduced pore size and this is schematically explained in Fig. 7B (small pores) and Fig. 7C (large pores). The black lines represent the first layers of the hydrogel matrix and the gray lines represent the subsequent layers. The density of larger pores was much smaller and therefore binding to larger AuNP occurred less frequently (Fig. 7D).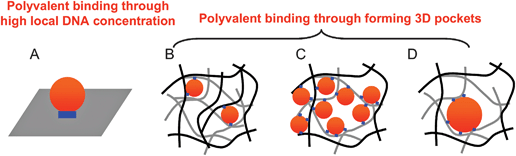 | ||
| Fig. 7 Schematic presentation of the binding between DNA-functionalized hydrogels and AuNPs. The DNA linkages are shown as the blue bars or dots. The AuNPs are shown as the red dots. The gel matrix is shown in black or gray lines. (A) In a planar surface, polyvalent binding is achieved via a high local DNA concentration in a small contacting area. In a porous hydrogel, polyvalent binding is achieved via formation of 3D binding pocket (B–D). A high percentage gel has a small number of surface binding sites (B) while a low percentage gel is more porous to bind more AuNPs (C). The number of binding sites reduced with increasing AuNP size (D). | ||
Compared to other methods to study porous hydrogels, DNA-functionalized AuNP probes work in the native state of the gel. Taking advantage of the molecular recognition function of DNA, this system can itself be used as biosensor and a controlled release system.22,23 Therefore, the information obtained in this study can guide the engineering of such hybrid soft-/nano-materials for various applications.
4. Conclusions
In this work, we employed DNA-functionalized AuNPs as a probe to study DNA-directed immobilization onto hydrogels. DNA melting, AuNP binding capacity, and electron/helium ion microscopy were used to understand the polyvalent binding. Hydrogels are a special substrate with many useful properties for nanoparticle immobilization and gel porosity is one of the most fundamental features. We tested the porosity effect on AuNP binding by tuning the gel percentage, crosslinker concentration, and AuNP size, and found that the number of binding sites is significantly reduced by reducing the pore size. For a non-porous substrate, the DNA-directed assembly of AuNPs occurs only through a small contacting area. In a hydrogel, however, the formation of a 3D binding pocket becomes very important, thus representing a totally different polyvalent binding mode. We have previously demonstrated that the AuNP–hydrogel system can be used for colorimetric detection of DNA and as a stimuli-responsive releasing system, taking advantage of the molecular recognition property of DNA. With the understanding obtained in this study, new hybrid materials can be better engineered for various analytical and biomedical applications.Acknowledgements
We thank Nina Heinig for assistance with the SEM experiment. This work is supported by the University of Waterloo, Canada Foundation for Innovation, Ontario Ministry of Research and Innovation (Early Researcher Award to J.L.), and the Natural Sciences and Engineering Research Council (NSERC) of Canada. A.B. received a scholarship from the Ministry of Higher Education of Saudi Arabia.References
- E. Katz and I. Willner, Angew. Chem., Int. Ed., 2004, 43, 6042–6108 CrossRef CAS.
- H. Xu, R. Hong, T. Lu, O. Uzun and V. M. Rotello, J. Am. Chem. Soc., 2006, 128, 3162–3163 CrossRef CAS.
- Y. Xiao, F. Patolsky, E. Katz, J. F. Hainfeld and I. Willner, Science, 2003, 299, 1877–1881 CrossRef CAS.
- H.-Y. Park, M. J. Schadt, L. Wang, I. I. S. Lim, P. N. Njoki, S. H. Kim, M.-Y. Jang, J. Luo and C.-J. Zhong, Langmuir, 2007, 23, 9050–9056 CrossRef CAS.
- T. A. Taton, C. A. Mirkin and R. L. Letsinger, Science, 2000, 289, 1757–1760 CrossRef CAS.
- J. D. Grunwaldt, C. Kiener, C. Wogerbauer and A. Baiker, J. Catal., 1999, 181, 223–232 CrossRef CAS.
- C. A. Mirkin, R. L. Letsinger, R. C. Mucic and J. J. Storhoff, Nature, 1996, 382, 607–609 CrossRef CAS.
- J. J. Storhoff and C. A. Mirkin, Chem. Rev., 1999, 99, 1849–1862 CrossRef CAS.
- N. L. Rosi and C. A. Mirkin, Chem. Rev., 2005, 105, 1547–1562 CrossRef CAS.
- J. Liu, Z. Cao and Y. Lu, Chem. Rev., 2009, 109, 1948–1998 CrossRef CAS.
- W. Zhao, M. A. Brook and Y. Li, ChemBioChem, 2008, 9, 2363–2371 CrossRef CAS.
- H. Wang, R. H. Yang, L. Yang and W. H. Tan, ACS Nano, 2009, 3, 2451–2460 CrossRef CAS.
- P. Kumar, J. Choithani and K. C. Gupta, Nucleic Acids Res., 2004, 32 Search PubMed.
- T. Niazov, V. Pavlov, Y. Xiao, R. Gill and I. Willner, Nano Lett., 2004, 4, 1683–1687 CrossRef CAS.
- G. M. Scheuermann, L. Rumi, P. Steurer, W. Bannwarth and R. Muelhaupt, J. Am. Chem. Soc., 2009, 131, 8262–8270 CrossRef CAS.
- J. Liu, S. Fu, B. Yuan, Y. Li and Z. Deng, J. Am. Chem. Soc., 2010, 132, 7279–7281 CrossRef CAS.
- L. Tang, Y. Wang, Y. Liu and J. Li, ACS Nano, 2011, 5, 3817–3822 CrossRef CAS.
- M. Haruta, CATTECH, 2002, 6, 102–115 CrossRef CAS.
- S. Sadasivan, E. Dujardin, M. Li, C. J. Johnson and S. Mann, Small, 2005, 1, 103–106 CrossRef CAS.
- N. Dave and J. Liu, Adv. Mater., 2011, 23, 3182–3186 CrossRef CAS.
- W. A. Zhao, M. M. Ali, S. D. Aguirre, M. A. Brook and Y. F. Li, Anal. Chem., 2008, 80, 8431–8437 CrossRef CAS.
- A. Baeissa, N. Dave, B. D. Smith and J. Liu, ACS Appl. Mater. Interfaces, 2010, 2, 3594–3600 CAS.
- F. El-Hamed, N. Dave and J. Liu, Nanotechnology, 2011, 22, 494011 CrossRef.
- N. A. Peppas, J. Z. Hilt, A. Khademhosseini and R. Langer, Adv. Mater., 2006, 18, 1345–1360 CrossRef CAS.
- J. Liu, Soft Matter, 2011, 7, 6757–6767 RSC.
- Z. Zhu, C. C. Wu, H. P. Liu, Y. Zou, X. L. Zhang, H. Z. Kang, C. J. Yang and W. H. Tan, Angew. Chem., Int. Ed., 2010, 49, 1052–1056 CrossRef CAS.
- N. Dave, P.-J. J. Huang, M. Y. Chan, B. D. Smith and J. Liu, J. Am. Chem. Soc., 2010, 132, 12668–12673 CrossRef CAS.
- K. A. Joseph, N. Dave and J. Liu, ACS Appl. Mater. Interfaces, 2011, 3, 733–739 CAS.
- B. Soontornworajit, J. Zhou and Y. Wang, Soft Matter, 2010, 6, 4255–4261 RSC.
- B. Soontornworajit, J. Zhou, M. T. Shaw, T. H. Fan and Y. Wang, Chem. Commun., 2010, 46, 1857–1859 RSC.
- S. Venkatesh, J. Wower and M. E. Byrne, Bioconjugate Chem., 2009, 20, 1773–1782 CrossRef CAS.
- S. H. Um, J. B. Lee, N. Park, S. Y. Kwon, C. C. Umbach and D. Luo, Nat. Mater., 2006, 5, 797–801 CrossRef CAS.
- D. C. Lin, B. Yurke and N. A. Langrana, J. Mater. Res., 2005, 20, 1456–1464 CrossRef CAS.
- E. J. Cheng, Y. Z. Xing, P. Chen, Y. Yang, Y. W. Sun, D. J. Zhou, L. J. Xu, Q. H. Fan and D. S. Liu, Angew. Chem., Int. Ed., 2009, 48, 7660–7663 CrossRef CAS.
- H. H. Yang, H. P. Liu, H. Z. Kang and W. H. Tan, J. Am. Chem. Soc., 2008, 130, 6320–6321 CrossRef CAS.
- H. Kang, H. Liu, X. Zhang, J. Yan, Z. Zhu, L. Peng, H. Yang, Y. Kim and W. Tan, Langmuir, 2011, 27, 399–408 CrossRef CAS.
- M. Mammen, S. K. Choi and G. M. Whitesides, Angew. Chem., Int. Ed., 1998, 37, 2755–2794 CrossRef CAS.
- C. A. Mirkin, MRS Bull., 2010, 35, 532–539 CrossRef CAS.
- O. S. Lee, T. R. Prytkova and G. C. Schatz, J. Phys. Chem. Lett., 2010, 1, 1781–1788 CrossRef CAS.
- J. Wang, A. D. Gonzalez and V. M. Ugaz, Adv. Mater., 2008, 20, 4482–4489 CrossRef CAS.
- N. Pernodet, M. Maaloum and B. Tinland, Electrophoresis, 1997, 18, 55–58 CrossRef CAS.
- S. H. Kim and C. C. Chu, J. Biomed. Mater. Res., 2000, 53, 258–266 CrossRef CAS.
- M. M. Chui, R. J. Phillips and M. J. McCarthy, J. Colloid Interface Sci., 1995, 174, 336–344 CrossRef CAS.
- I. Nishio, J. C. Reina and R. Bansil, Phys. Rev. Lett., 1987, 59, 684–687 CrossRef CAS.
- T. O. Thorgeirsdottir, A. L. Kjoniksen, K. D. Knudsen, T. Kristmundsdottir and B. Nystrom, Eur. J. Pharm. Biopharm., 2005, 59, 333–342 CrossRef CAS.
- R. Jin, G. Wu, Z. Li, C. A. Mirkin and G. C. Schatz, J. Am. Chem. Soc., 2003, 125, 1643–1654 CrossRef CAS.
- R. Jin, Y. C. Cao, C. S. Thaxton and C. A. Mirkin, Small, 2006, 2, 375–380 CrossRef CAS.
- X. Xue, W. Xu, F. Wang and X. Liu, J. Am. Chem. Soc., 2009, 131, 11668–11669 CrossRef CAS.
- J. J. Storhoff, R. Elghanian, R. C. Mucic, C. A. Mirkin and R. L. Letsinger, J. Am. Chem. Soc., 1998, 120, 1959–1964 CrossRef CAS.
- J. Liu and Y. Lu, Nat. Protoc., 2006, 1, 246–252 CrossRef CAS.
- S. J. Hurst, A. K. R. Lytton-Jean and C. A. Mirkin, Anal. Chem., 2006, 78, 8313–8318 CrossRef CAS.
- S. J. Hurst, H. D. Hill and C. A. Mirkin, J. Am. Chem. Soc., 2008, 130, 12192–12200 CrossRef CAS.
- R. Elghanian, J. J. Storhoff, R. C. Mucic, R. L. Letsinger and C. A. Mirkin, Science, 1997, 277, 1078–1080 CrossRef CAS.
| This journal is © The Royal Society of Chemistry 2012 |