Universal protocol for grafting PCR primers onto various lab-on-a-chip substrates for solid-phase PCR†
Jochen
Hoffmann
*a,
Sebastian
Hin
a,
Felix von
Stetten
ab,
Roland
Zengerle
abc and
Günter
Roth
abc
aRoland Zengerle, Laboratory for MEMS Applications, Department of Microsystems Engineering - IMTEK, University of Freiburg, Georges-Koehler-Allee, 103, 79110, Freiburg, Germany. E-mail: jochen.hoffmann@imtek.de; Fax: +49 761 203 73299; Tel: +49 761 203 73234
bHSG-IMIT, Wilhelm-Schickard-Straße 10, D-78052, Villingen-Schwenningen, Germany
cBIOSS-Centre for Biological Signalling Studies, University of Freiburg, 79110, Freiburg, Germany
First published on 13th March 2012
Abstract
A universal protocol for grafting PCR primers onto glass, PDMS, COP, COC, and PP is developed and evaluated by solid-phase PCR (SP-PCR). Primers are immobilized in a PCR compatible way featuring spots with high homogeneity and integrity. Furthermore, we show a protocol for binding a PCR product to immobilized PCR primers via solid-phase PCR (SP-PCR). Previously reported “enhanced SP-PCR” (Z. Kahn et al. Anal. Biochem., 2008, 375, 391–393) is improved in terms of factorial signal increase from 9.9 to 86.8 and specificity from 11.7 to 45.9. The presented immobilization- and SP-PCR protocols may enable integration of DNA microarrays directly into microfluidic lab-on-a-chip cartridges of various materials for analysis via SP-PCR. Beside planar microarrays, another interesting application could be to coat the inner surfaces of a chip with PCR primers to recover generated PCR products in digital PCR systems.
Introduction
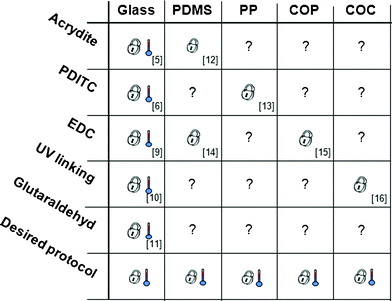
In several nucleic acid analysis systems multiple targets are amplified via primer-directed polymerase chain reaction (PCR) and identified on oligonucleotide microarrays. Targets are either detected via hybridization to target-specific probes (two-step protocol2,3 or by direct extension of immobilized probes during the PCR itself (one-step protocol). The latter technique is referred to as solid-phase PCR (SP-PCR).4 Among the various applications are genotyping5 and the identification of SNPs.6A key requirement for grafting PCR primers onto substrates in a SP-PCR compatible manner is that the chemical bond between oligonucleotide and array-substrate withstands thermocycling conditions such as incubation at temperatures around 95 °C. In addition, the binding chemistry must ensure a free 3′-OH end to be accessible and extendable by a DNA polymerase. To realize such thermally stable and oriented bonds, a number of different immobilization protocols have been developed for glass (Fig. 1) but rarely for polymers.7,8
 | ||
| Fig. 1 Various chemistries reported for grafting oligonucleotides to specific materials. Numbers indicate reference. indicates validation of temperature stability complying with SP-PCR, indicates validation for DNA immobilization, not tested for SP-PCR. | ||


Today, several immobilization protocols have proven their suitability for array based SP-PCR5,6,9–11 whereas others have not yet been tested12–16 (Fig. 1). A comprehensive overview over different immobilization strategies is given by Todt et al.17 and Sassolas et al.18Direct immobilization methods covalently bind oligonucleotides to the substrate. An example for such a method is the EDC chemistry, where 1-ethyl-3(3-dimethylaminopropyl)-carbodiimide (EDC) mediates the linkage of 5′-NH2 modified DNA to hydroxylated substrates.4 Another way is to UV-crosslink poly-dT modified DNA directly to glass10 or embedded in a 3-D hydrogel matrix to plastic substrates.3 Besides that, acrydite-modified oligonucleotides in an acrylamide gel can be spotted onto a substrate for oriented co-polymerization.5Indirect immobilization methods utilize homobifunctional linking molecules like glutaraldehyde11 and 1,4-phenylene diisothiocyanate (PDITC)6 for attaching oligonucleotides to activated or modified (mostly aminosilanized) surfaces. Fig. 1 summarizes immobilization chemistries that have been developed for different materials whereof only some have been applied to microarray based solid-phase PCR. From these data and current literature19,20 it becomes clear that there is a great technical need for a simple, robust, and versatile immobilization strategy that is applicable to a variety of different substrates and compatible to SP-PCR.
This work aims to identify and verify a universal protocol for grafting oligonucleotides to a variety of different substrates like glass and polymers fulfilling the requirements for SP-PCR. To address this issue, the PDITC chemistry was investigated in more detail. The chemistry is based on the homobifunctional linking molecule PDITC6,17,21 and has already been successfully demonstrated for SP-PCR,6 and the fabrication of DNA microarrays on glass6 and polypropylene (PP).13 The objective of this study is to graft arrays of solid-phase primers with a spot density of >400 spots cm−2 onto polydimethylsiloxane (PDMS), PP, cyclic olefin polymer (COP), cyclic olefin copolymer (COC) as well as on glass, and to investigate the SP-PCR performance on these substrates.
Methods
DNA immobilization
The general PDITC chemistry21 for DNA immobilization is visualized in Scheme 1. First, hydroxyl groups are generated on the surface by activation with oxygen plasma (Scheme 1 B). Second, 3-aminopropyltriethoxysilane (APTES)22 is condensed onto the hydroxyl groups (Scheme 1 C). A covalently interconnected silane network is obtained by a subsequent curing step at 70 °C. Next, PDITC is bound to the primary amino-groups of the APTES-silanized surface (Scheme 1 D). Finally, 5′-NH2 modified solid-phase primers for later solid-phase reactions are spotted in 1 nL droplets to the now thiocyanate activated surfaces in dilution series with concentrations of 0.05, 0.10, 0.20, 0.40, 0.80, and 1.60 μM. A 5′-NH2 and 3′-Cy5 modified, not extendable primer is used to visualize primer immobilization and as spotting control (Fig. 2). Prior to applying the PDITC protocol, the polymer substrates are cut into the format of standard microscope slides. For each substrate, DNA microarrays are printed onto two separately processed and PDITC-activated slides using a 6 × 4 nozzle Topspot® printhead, dispensing 24 spots per print.23 Three printing-blocks are deposited per substrate, with each printing-block composed of 4 × 5 single prints (Fig. 2), resulting in 480 spots per printing-block and 1440 spots per substrate in total. Detailed immobilization protocols including materials are provided in the ESI.†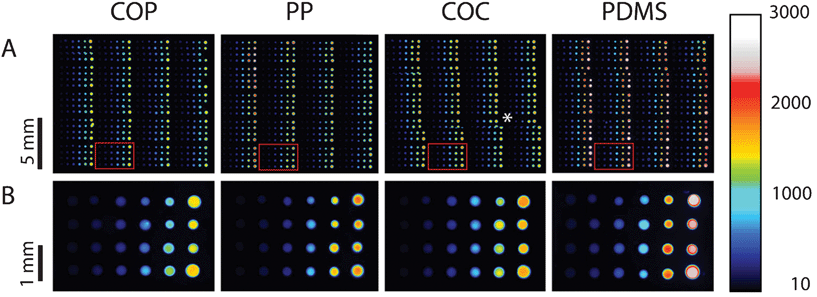 | ||
| Fig. 2 Fluorescent scans of dilution series printed onto COP, PP, COC, and PDMS. Eighty replicas of a dilution series per printing-block are immobilized onto the different materials, distributed over 20 prints (row A) with 4 replicas per print (row B). Each droplet has a volume of 1 nL, depositing on each sub-array (from left to right) 50 amol, 100 amol, 200 amol, 400 amol, 800 amol, and 1600 amol of primer. Scanning is done in the Cy5 channel with exposure times of 500 ms. Intensities can be qualitatively assessed by using the colour scale on the right. (*) misalignment of individual images due to the scanning software FIPS. | ||
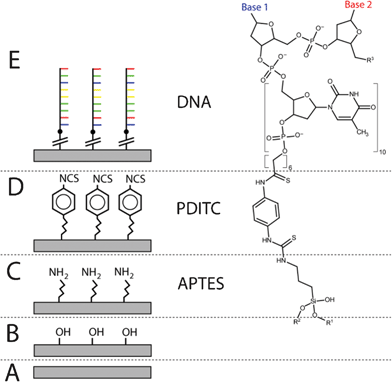 | ||
| Scheme 1 DNA immobilization using PDITC chemistry. On the surface of an unmodified substrate (A), hydroxyl groups are generated using oxygen plasma (B); next, the aminosilane APTES reacts with the hydroxyl groups, leaving an amine terminated surface (C); the homobifunctional PDITC binds to the amine groups, terminating the surface with thiocyanate groups (D); finally, an oligonucleotide with 5′- amine modification is covalently bonded to the surface (E). | ||
Principle of solid-phase PCR
When PCR is performed in a reaction compartment containing solid-phase primers as well as liquid-phase PCR primers, the latter in an asymmetric ratio (Scheme 2 A), two different reaction regimes of the amplification kinetics have to be distinguished. Phase 1: In the beginning of the reaction, liquid-phase PCR kinetically dominates until one liquid-phase primer (green primer, Scheme 2 B) is depleted. This is owed to steric restriction and lower efficacy of the surface reaction. Phase 2: after depletion of the limited liquid-phase primer the generated liquid-phase amplicons predominantly anneal to the solid-phase primers, which can then be extended by a DNA polymerase. A combination of phase 1 and phase 2 allows for an amplification and immobilization of the sequence of interest to a solid-phase. This “solid-phase PCR” process is depicted in Scheme 2 C. Successful extension of the solid-phase primers is detected by binding of streptavidin-Cy5 (Scheme 2 E, F) to incorporated biotinylated dUTP (Scheme 2 D).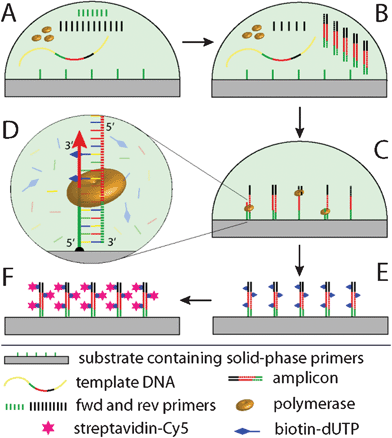 | ||
| Scheme 2 Schematics of solid-phase PCR used for evaluation of the immobilization protocol. Initially, a reaction compartment comprises solid-phase primers as well as forward (fwd) and reverse (rev) primers in an asymmetric ratio (A); in the beginning, PCR proceeds preferably in the liquid phase, until the fwd primer is depleted (B); then, solid-phase PCR dominates, where the immobilized primer is extended by polymerase activity. Biotin-dUTPs are incorporated into the reaction for labeling (C, D) and subsequent visualization of the SP-PCR product by staining with streptavidin-Cy5 (E, F). | ||
Results and discussion
DNA immobilization
Fig. 2 displays the fluorescent scan intensities of one printing-block per slide. On the different PDITC coated surfaces spot size vary due to different contact angles. Nevertheless, all spots show high integrity and homogeneity on COP, PP, COC, and PDMS. For graphical visualization, mean values and standard deviations of each concentration are calculated from 32 spots in total, on the basis of 16 signals from each replicate of an individually processed slide (Fig. 3). Fluorescence intensities of the spots increase linearly with concentration of the Cy5 primer (Fig. 2 and 3). The measured signal for the 1.60 μM spotted solid-phase primer is lower than the extrapolated value, indicating either the beginning of saturation in binding capacity or quenching which can occur at high fluorophore densities.24 Signals on PDMS showed the highest intensities of all investigated polymers. For successful immobilization, we identified several critical points of the processing protocol which are reported in the ESI.†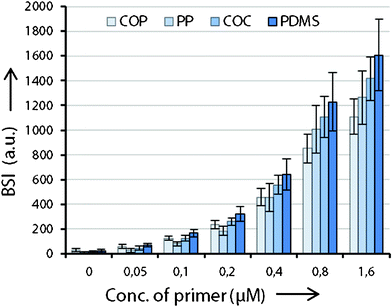 | ||
| Fig. 3 Measured fluorescence intensities of the Cy5 primer dilution series bound to the investigated substrates. The signal of the 0.05 μM Cy5 primer is the lowest amount which can be distinguished from the background signal (spotting buffer only). From 0.05 μM to 0.80 μM, signals increase linearly, only 1.60 μM spots shows lower intensities than expected, indicating a saturation limit. Numerical values represent the integral over the whole area of each spot. | ||
Solid-phase PCR reaction
For SP-PCR experiments, solid-phase primers with three different sequences are printed onto PDITC activated surfaces in final concentrations of 2.00 μM in 1 nL droplets. Besides an extendable primer (Fig. 4, line b), a 3′-Cy5 modified not extendable spotting control primer (Cy5 primer) (Fig. 4, line a) and a not extendable primer with mismatching sequence (Fig. 4, line c) are added as specificity controls. The control spots should not yield any signals during SP-PCR amplification, being a measure for unspecific signal generation. The intensity values of the three different kinds of solid-phase primers are measured before and after SP-PCR by a microarray reader. One important point in assessing solid-phase PCR is the thermal stability of the bond linking the solid-phase primer with the substrate. Due to the extensive thermocycling for 50 cycles (45 min at 94 °C and 105 min at 60 °C in total) some of the covalently grafted primers may detach or degrade. This is analysed by the signal decrease of the spotting control before and after thermocycling (Fig. 4, lane a). Depending on the substrate, the observed fluorescence loss is 31.1 (± 2.4)% on COC, 38.5 (± 5.9)% on COP, 41.5 (± 3.3)% on PP, 44.4 (± 6.7)% on PDMS, and 55.6 (± 7.4)% on glass, where n = 16. In the literature, thermally induced losses of 60% after 40 PCR cycles for the self-synthesized linker BTA25 and 40–60% after 50 PCR cycles for the linkers EDC, s-MBS, s-SIAB, s-SMCC, s-GMBS, s-MPB are reported for glass.4 Observed fluorescence intensity of not extendable Cy5 primers (spotting control) remaining on polymers after SP-PCR are 1.6 (COP), 2.1 (PP), 2.2 (COC), and 2.0 (PDMS) times higher than on glass. For absolute values, see Fig. 5. Hence, in terms of thermal stability, our protocol for grafting primers appears to be slightly more efficient on polymers than on glass.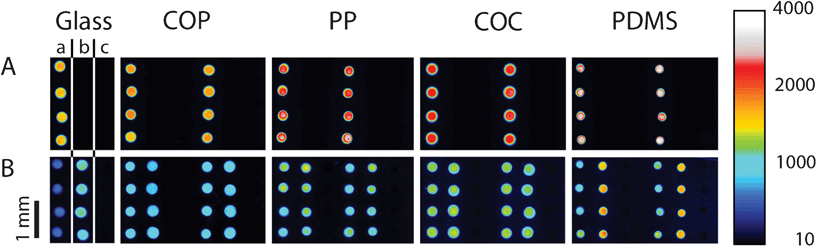 | ||
| Fig. 4 Cy5 scans of the arrays containing the Cy5 primer as not extendable spotting control (lane a), the extendable primer as extension control (lane b), and the not extendable primer as negative control (lane c) in rows of four spots per substrate. Scanning is done before (row A) and after SP-PCR and staining (row B). Highly specific extension of the extendable primer is observed on all polymers and also on glass, although a remarkable amount of Cy5 primers is lost on all substrates. | ||
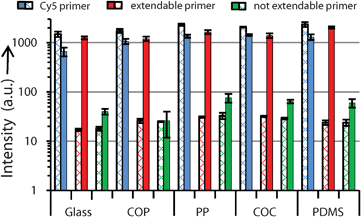 | ||
| Fig. 5 Measured fluorescence intensities for each substrate before (crossed bars) and after (bold bars) solid-phase PCR. On all substrates, signals from the extendable primer significantly increase after SP-PCR, whereas signals remain close to the background for the not extendable primer, indicating an excellent SP-PCR system. All solid-phase primers are spotted in end-concentrations of 2.00 μM, for which reason, intensities of the Cy5 primer before PCR are higher than intensities from Fig. 2 (end concentration of Cy5 primer: 1.60 μM). Gaussian standard deviations include slide to slide variations, n = 16. | ||
A prerequisite in SP-PCR is the extendibility of solid-phase primers. We determined the factorial signal increases of each type of solid-phase primer as a ratio of the intensities after and before SP-PCR. Measured signal increases of extendable primers are between 43.9 and 86.8, compared to 1.4–10.0 in the paper “enhanced SP-PCR” published in 2008.1 Signal increases of the not extendable primers (negative controls) are between 1.1 and 2.5 (Fig. 5, Table 1). When calculating specificity, in accordance to1 as the ratio between the extendable and not extendable primer after SP-PCR, we also obtain a higher specificity of 31.7 (± 4.3) (glass), 45.9 (± 20.9) (COP), 21.6 (± 3.3) (PP), 21.7 (± 2.8) (COC), and 34.2 (± 6.7) (PDMS) compared to published values of 7.6–11.7.1 The background increased only slightly after SP-PCR with factors between 1.5 (± 0.6) (COP) and 2.6 (± 0.3) (PP), which is due to the addition of 0.1% BSA (w/v) to the PCR amplification mix, preventing the absorption of PCR-components to the substrates.26 We obtained highly specific and significant signal increases of solid-phase primers on all substrates, indicating a well-balanced SP-PCR system. Details of the SP-PCR system as well as the improvements in treatment of the surfaces are described in the ESI.†
| Glass | COP | PP | COC | PDMS | |
|---|---|---|---|---|---|
| a The factorial signal increase is calculated by dividing the measured intensity signals before and after SP-PCR, n = 16. | |||||
| Extendable primer | 72.5 ± 6.7 | 45.7 ± 6.9 | 53.6 ± 5.4 | 43.9 ± 4.8 | 86.8 ± 10.2 |
| Not extendable primer | 2.2 ± 0.4 | 1.1 ± 0.6 | 2.2 ± 0.6 | 2.2 ± 0.2 | 2.5 ± 0.6 |
| Background | 1.6 ± 0.5 | 1.5 ± 0.6 | 2.6 ± 0.3 | 2.2 ± 0.3 | 2.4 ± 0.7 |
Conclusion and outlook
We presented a universal protocol for grafting PCR primers using PDITC chemistry onto the various lab-on-a-chip substrates; glass, COP, PP, COC, and PDMS. Furthermore, we could successfully amplify and immobilize a DNA sequence of interest to certain spots on all materials by SP-PCR. Thus, we demonstrated the Desired protocol from Fig. 1. In contrast, other reports analysed applicability of immobilization protocols only very specifically for either polymers3,7,8 or glass5,6,9–11, and most of these protocols have not been tested for SP-PCR. Compared to previously reported SP-PCR systems,1,4 we obtained highly intense and specific signals showing that enough extendable solid-phase primers are provided on the surfaces and an appropriate staining method is chosen. Due to the observed general applicability of our method it may lead to enhanced functionality of existing microfluidic systems or initiate novel applications.As an outlook, our SP-PCR protocol can be an interesting approach for detecting simultaneously multiple targets in microarrays analysis.27 In the field of lab-on-a-chip systems,28,29 comprehensive sample preparation capabilities can be combined by the multiplexing capabilities of microarrays based SP-PCR by directly grafting microarrays into lab-on-a-chip substrates. Beside microarrays, another interesting application could be to apply this immobilization protocol to the inner surface of a chip for digital PCR (dPCR) as it has been recently shown by our group.30 Thereby, generated PCR products can be recovered, which is an interesting novelty compared to currently published systems for dPCR.31–33
Acknowledgements
We gratefully thank the Hans L. Merkle Foundation for Excellency in Science and Technology for financial support of this project.References
- Z. Khan, K. Poetter and D. J. Park, Anal. Biochem., 2008, 375, 391–393 CrossRef CAS
.
- D. Summerer, D. Hevroni, A. Jain, O. Oldenburger, J. Parker, A. Caruso, C. F. Stahler, P. F. Stahler and M. Beier, New Biotechnol., 2010, 27, 149–155 CrossRef CAS
- T. Brandstetter, S. Bohmer, O. Prucker, E. Bisse, A. zur Hausen, J. Alt-Morbe and J. Ruhe, J. Virol. Methods, 2010, 163, 40–48 CrossRef CAS
- C. Adessi, G. Matton, G. Ayala, G. Turcatti, J. J. Mermod, P. Mayer and E. Kawashima, Nucleic Acids Res., 2000, 28, E87 CrossRef CAS
- L. Cheng, B. L. Sun, Y. Sun, P. F. Xiao, Q. Y. Ge, Y. Z. Zheng, X. Y. Ke, Y. Zhou, M. H. Zhang, P. Chen and Z. H. Lu, J. Nanosci. Nanotechnol., 2010, 10, 479–486 CrossRef CAS
- R. Kranaster, P. Ketzer and A. Marx, ChemBioChem, 2008, 9, 694–697 CrossRef CAS
- K. Kinoshita, K. Fujimoto, T. Yakabe, S. Saito, Y. Hamaguchi, T. Kikuchi, K. Nonaka, S. Murata, D. Masuda, W. Takada, S. Funaoka, S. Arai, H. Nakanishi, K. Yokoyama, K. Fujiwara and K. Matsubara, Nucleic Acids Res., 2007, 35 CAS
- A. Carmon, T. J. Vision, S. E. Mitchell, T. W. Thannhauser, U. Muller and S. Kresovich, BioTechniques, 2002, 32, 410 CAS
- M. von Nickisch-Rosenegk, X. Marschan, D. Andresen and F. F. Bier, Anal. Bioanal. Chem., 2008, 391, 1671–1678 CrossRef
- Y. Sun, R. Dhumpa, D. Bang, J. Hogberg, K. Handberg and A. Wolff, Lab Chip, 2011, 11, 1457–1463 RSC
- D. A. Khodakov, N. V. Zakharova, D. A. Gryadunov, F. P. Filatov, A. S. Zasedatelev and V. M. Mikhailovich, BioTechniques, 2008, 44, 241 CrossRef CAS
- D. J. Liu, R. K. Perdue, L. Sun and R. M. Crooks, Langmuir, 2004, 20, 5905–5910 CrossRef CAS
- M. Beier and J. D. Hoheisel, Nucleic Acids Res., 1999, 27, 1970–1977 CrossRef CAS
- G. A. az-Quijada and D. D. M. Wayner, Langmuir, 2004, 20, 9607–9611 CrossRef
- S. Laib and B. D. MacCraith, Anal. Chem., 2007, 79, 6264–6270 CrossRef CAS
- D. M. Dankbar and G. Gauglitz, Anal. Bioanal. Chem., 2006, 386, 1967–1974 CrossRef CAS
-
S. Todt and D. H. Blohm, in Methods of Molecular Biology, Humana Press, Totowa, 2009, ch. 6, 81–100 Search PubMed
- A. Sassolas, B. D. Leca-Bouvier and L. J. Blum, Chem. Rev., 2008, 108, 109–139 CrossRef CAS
- H. O. Ham, Z. Q. Liu, K. H. A. Lau, H. Lee and P. B. Messersmith, Angew. Chem., Int. Ed., 2011, 50, 732–736 CrossRef CAS
- S. H. North, E. H. Lock, C. R. Taitt and S. G. Walton, Anal. Bioanal. Chem., 2010, 397, 925–933 CrossRef CAS
- Z. Guo, R. A. Guilfoyle, A. J. Thiel, R. F. Wang and L. M. Smith, Nucleic Acids Res., 1994, 22, 5456–5465 CrossRef CAS
- S. J. Oh, S. J. Cho, C. O. Kim and J. W. Park, Langmuir, 2002, 18, 1764–1769 CrossRef CAS
- O. Gutmann, R. Kuehlewein, S. Reinbold, R. Niekrawietz, C. P. Steinert, B. de Heij, R. Zengerle and M. Daub, Biomed. Microdevices, 2004, 6, 131–137 CrossRef CAS
- P. A. C. 't Hoen, F. de Kort, G. J. B. van Ommen and J. T. den Dunnen, Nucleic Acids Res., 2003, 31 Search PubMed
- M. Fedurco, A. Romieu, S. Williams, I. Lawrence and G. Turcatti, Nucleic Acids Res., 2006, 34 Search PubMed
- I. Erill, S. Campoy, N. Erill, J. Barbe and J. Aguilo, Sens. Actuators, B, 2003, 96, 685–692 CrossRef
- R. Schoske, P. M. Vallone, C. M. Ruitberg and J. M. Butler, Anal. Bioanal. Chem., 2003, 375, 333–343 CAS
- D. Mark, S. Haeberle, G. Roth, F. von Stetten and R. Zengerle, Chem. Soc. Rev., 2010, 39, 1153–1182 RSC
- A. Arora, G. Simone, G. B. Salieb-Beugelaar, J. T. Kim and A. Manz, Anal. Chem., 2010, 82, 4830–4847 CrossRef CAS
- J. Hoffmann, H. M. Trotter, F. von Stetten, R. Zengerle and G. Roth, Proceeding of the μTAS conference, 2011, 900–902 Search PubMed
- K. A. Heyries, C. Tropini, M. VanInsberghe, C. Doolin, O. I. Petriv, A. Singhal, K. Leung, C. B. Hughesman and C. L. Hansen, Nat. Methods, 2011, 8, 649-U64 CrossRef
- F. Shen, W. B. Du, J. E. Kreutz, A. Fok and R. F. Ismagilov, Lab Chip, 2010, 10, 2666–2672 RSC
- J. Liu, C. Hansen and S. R. Quake, Anal. Chem., 2003, 75, 4718–4723 CrossRef CAS
Footnote |
| † Electronic Supplementary Information (ESI) available: See DOI: 10.1039/c2ra01250b/ |
| This journal is © The Royal Society of Chemistry 2012 |